– There was an uneasy calm across financial markets on Wednesday as investors exercised caution ahead of the Jackson Hole Symposium this week.
European stocks were mixed, the dollar stabilised while gold prices wobbled above $1740 ahead of Federal Reserve Powell’s speech on Friday. The central bank head is expected to strike a hawkish note which may reinforce aggressive rate hike bets – ultimately boosting the dollar. In the event of an unexpected ‘dovish’ Fed pivot, the dollar could be dealt a heavy blow.
Given how this major event could inject markets with fresh volatility, this may present some opportunities across the FX space. If heavy technicals are what you seek, then check out the setups below covering major and minor currencies.
Dollar bulls back in action
Despite yesterday’s selloff, the dollar continues to flex its safe-haven muscles ahead of this week’s potential market shaker. Prices are heavily bullish on the daily charts as there have been consistently higher highs and higher lows. A strong move above 109.14 may encourage an incline towards 109.70 and 110.00, respectively. Should prices slip back under 108.00, bears may target 107.30.
Equally weighted USD Index on standby…
Prices are likely to hover around the 1.1950 regions until a fresh directional catalyst is brought into the picture. Should this level prove to be reliable support, a move towards 1.2080 and 1.2184 could be expected. Below 1.1950, bears are likely to target the 50-day SMA and 1.1700, respectively.
EURUSD kisses 0.9900
After securing a solid daily close below parity, euro bears have marked their territory. The currency pair is heavily bearish on the daily timeframe with 0.9900 still a key level of interest. A breakdown below this level could encourage a selloff towards 0.9650 which acted as strong support back in the autumn of 2002. Should 0.9900 prove to be reliable support, prices could experience a bounce back to parity before resuming the selloff.
GBPUSD bears in control for now
Bears remain in the driving seat with prices wobbling above 1.1760 as of writing. The GBPUSD is under pressure on the daily charts with a break below 1.1760 opening the doors to 1.1700 and 1.1600. A move back above 1.1900 is seen triggering a move higher towards 1.2000.
AUDUSD back within range
An appreciating dollar could drag the AUDUSD out of its current range with a breakdown below the 0.6850 support opening a path back towards 0.6700. Should 0.6850 prove to be a tough nut to crack, prices may rebound back towards 0.7000.
USDJPY to resume uptrend?
The USDJPY is bullish on the daily charts. Prices are trading above the 50, 100, and 200-day Simple Moving Average while the MACD trades above zero. A solid break above 137.50 could trigger a move towards 139.38. Under 135.00, prices are seen testing 131.34.
EURGBP dips below 200-day SMA
As the subtitle says, the EURGBP is trading below the 200-day Simple Moving Average. This is a bearish sign and could result in further downside if 0.8440 proves to be reliable resistance. A EURGBP selloff may take prices back towards 0.8340.
GBPJPY respects bearish channel
Expect the GBPJPY to drift lower if prices fail to push above 162.00. A strong breakdown under 160.00 may signal a selloff towards the 200-day SMA at 159.00 and 157.50, respectively.
CADJPY supported above 104.80
We could see the CADJPY push higher if 104.80 proves to be reliable support. If prices use this level to push higher, the next key level of interest can be found at 107.50. A selloff below 104.800 could open the doors back towards the 100-day SMA and 102.00, respectively.
The Biden administration has identified two zones for offshore wind power development in the Gulf of Mexico, which up until now has been firmly identified with oil and gas production. As part of his climate strategy, President Joe Biden has set a goal for the deployment of 30 gigawatts (30,000 megawatts) of offshore wind generating capacity by 2030 – enough to power 10 million homes with carbon-free electricity.
As energyresearchers based in Texas, we see this as an exciting new phase in our nation’s ongoing clean power transition. In our view, offshore wind in the Gulf of Mexico presents a unique opportunity for a geographic region with a strong energy workforce and infrastructure to help meet society’s need for reliable low-carbon energy.
Why go offshore?
Wind power on land has seen remarkable growth in the U.S. over the last 15 years, including in Texas, the top wind-generating state in the nation. Wind power’s comparative ease of permitting and siting, affordable installation costs, abundant resources, free fuel and low marginal operating costs have reduced electricity costs for consumers. And wind power avoids significant amounts of air pollution, greenhouse gas emissions and water demand for cooling – impacts associated with power plants that burn coal, oil or natural gas.
But onshore wind has downsides. Winds often are weakest in the hottest hours of summer, when air conditioners are working hard to keep people cool. And many of the best wind energy zones are far from electricity demand centers. For example, most wind farms here in the Lone Star State are located on the high plains in west Texas, and were only built after the state spent billions of dollars on long-distance transmission lines to move their power to where it’s needed.
Many of the best U.S. land-based wind generating areas (dark blue zones) are far from coastal population centers, but those cities could be served by offshore wind farms. NREL
Solar power and batteries can solve some of these problems. But generating wind offshore also offers many benefits.
Just as onshore wind lowered electricity costs for consumers, offshore wind is expected to do the same.
More than half of the U.S. population lives within 50 miles of a coast, so offshore wind sites are close to electricity demand centers. This is especially true in the Gulf of Mexico, which is home to major cities such as Houston and New Orleans and a large concentration of petrochemical facilities and ports. Power companies can use subsea cables to bring wind energy to industrial facilities, instead of building hundreds of miles of overhead wires, with associated right-of-way and land access disputes.
Importantly, offshore wind complements onshore wind. As air speeds slow in west Texas on a hot summer afternoon, coastal winds pick up, helping to meet summer peak demand and improving grid reliability.
The offshore wind market is already robust globally, but until now has been practically non-existent in the U.S. Abundant land here has spurred growth of onshore wind, but inhibited a rush to the water.
That’s changing with tighter setback rules in leading wind states like Iowa that limit how close to homes turbines can be placed, which are driving up construction costs and limiting the availability of acceptable sites. Transmission capacity limits on the U.S. power grid are also making it harder to move wind-generated electrons to market.
Constructing offshore wind farms requires specialized ships, port facilities and labor. Many of these resources are already available along the U.S. Gulf Coast, a major offshore oil and gas production region.
Compared to cold and bitter conditions in regions like the North Sea, the North Atlantic and coastal Japan, where offshore wind generation is already happening, the Gulf’s shallower water depths, warmer temperatures and calmer waves are relatively easy to manage. Water depths up to 160 feet – currently the maximum depth for fixed-bottom wind turbines – extend nearly 90 miles off the coasts of southeast Texas and southern Louisiana, compared with only about 40 miles off Nantucket and Martha’s Vineyard in the Northeast.
The Gulf’s seafloor topography features a more even and gentle slope than areas already under consideration for development off the coast of Virginia. This means that fixed-bottom wind turbines can be used in more places, rather than floating systems, which reduces complexity.
Importantly, the Gulf Coast has a robust offshore industry that was established to serve oil and gas producers, with many specialized companies offering services such as underwater welding, platform manufacturing and helicopter and boat services to get people and equipment to sea. Gulf of Mexico oil and gas production supported an estimated 345,000 jobs in 2019.
Wind farms in the Gulf can leverage existing infrastructure. There are nearly 1,200 miles of existing subsea power cables that could transfer wind energy to shore. Wind generation could also be incorporated into a larger energy system that includes green hydrogen generation and storage and carbon sequestration.
A boost for workers and vulnerable communities
We also believe that offshore wind energy can help advance environmental justice goals. Generating more clean, carbon-free electricity will help to displace refineries and plants that process fossil fuels and generate power from them. These facilities disproportionately harm the health of communities of color in cities like Houston and across the U.S..
Permitting for energy projects is notoriously slow at the federal level, and wind energy projects in federal waters may require multi-year lead times. But projects in state waters – extending up to three nautical miles from shore in most areas, and nine miles from shore in Texas – could proceed more rapidly.
Much depends on whether energy states like Texas and Louisiana see opportunities to extend their reputations as energy leaders into offshore wind. As we see it, an offshore wind boom in the Gulf would be good for the region, the nation and the world’s climate.
It’s an odd quirk of history that, on the first day of his ill-fated presidential campaign in March 1968, Robert F Kennedy chose to talk to his audience about the limitations of gross domestic product* (GDP) – the world’s headline indicator of economic progress.
It seems stranger still that, despite the power of that iconic speech, growth in GDP remains to this day the predominant measure of progress across the world. Economic success is measured by it. Government policy is assessed by it. Political survival hangs on it.
Kennedy’s speech inspired a host of critiques. It has been quoted by presidents, prime ministers and Nobel laureates. Yet GDP itself has survived until now, more-or-less unscathed. But amid ever-louder concerns about the failure of national economies to tackle the multiple threats posed by climate change, spiralling energy costs, insecure employment and widening levels of inequality, the need to define and measure progress in a different way now looks as unarguable as it is urgent.
The goods, the bads, and the missing
In simple terms, GDP is a measure of the size of a country’s economy: how much is produced, how much is earned, and how much is spent on goods and services across the nation. The monetary total, whether in dollars or euros, yuan or yen, is then adjusted for any general increase in prices to give a measure of “real” economic growth over time. When governments adopt policies to pursue economic growth, this is how those policies are evaluated.
Since 1953, GDP has been the headline measure in a complex system of national accounts overseen by the United Nations. Developed during the second world war, these accounts were motivated in part by the need to determine how much governments could afford to spend on the war effort.
This story is part of Conversation Insights
The Insights team generates long-form journalism and is working with academics from different backgrounds who have been engaged in projects to tackle societal and scientific challenges.
But in measuring the monetary value of economic activity, GDP can incorporate many of the “bads” that detract from our quality of life. War, pollution, crime, prostitution, traffic congestion, disasters like wildfires and the destruction of nature – all can have a positive impact on GDP. Yet they cannot really be construed as components of economic success.
At the same time, there are numerous aspects of our lives that simply go missing from this conventional account. The inequality in our societies. The contributions from unpaid work. The labour of those who care for the young and the elderly at home or in the community. The depletion of natural resources or biodiversity. And the value of data and many digital services.
What lies outside the market, including public services funded out of taxation, remains unmeasured in a metric of monetary exchange. Kennedy was blunt: “[GDP] measures everything, in short, except that which makes life worthwhile.”
It’s a sentiment that has resonance half a century later. In a striking encounter during the Brexit debate, a UK academic was trying to convey to a public meeting the dangers of leaving the EU. The impact on GDP would dwarf any savings from the UK’s contributions to the EU budget, he told the audience. “That’s your bloody GDP!” shouted a woman in the crowd. “It’s not ours.”
This sense of an indicator out of touch with reality may be one of the reasons there is momentum for reform. When GDP conceals crucial differences between the richest and the poorest in society, it inevitably says little about the prospects for ordinary people.
But there are other reasons too for an emerging change of heart. The pursuit of GDP growth as a policy goal, and the impact that has on government, business and personal decision-making, has accompanied increasing devastation of the natural world, a loss of forests and habitats, the destabilisation of the climate, and near-meltdowns of the world’s financial markets. At the same time, GDP has become a poor measure of the technological transformation of society.
Its tenacity as a measure of progress, despite these well-known limitations, arises from factors which are on the one hand technocratic, and on the other sociological. As the headline measure in a sophisticated system of national accounts, GDP has a technocratic convenience and analytical elegance that remains unsurpassed by many alternative measures. Its authority arises from its ability to be simultaneously a measure of production output, consumption expenditure and income in the economy.
Despite this complex framework, it also offers the deceptive simplicity of a single headline figure which appears to be directly comparable from year to year and across nations, based on the simple (if inadequate) idea that more economic activity necessarily leads to a better life.
However, the combined technical authority and political usefulness of this idea has led to “path dependence” and forms of social lock-in that are difficult to address without significant effort. Think of switching to an alternative as being like switching from driving on the left to the right-hand side of the road.
Yet what we measure matters. And while we’re busy looking in the wrong direction, as Kennedy pointed out, bad things can happen. Kennedy’s campaign – and his critique of GDP – was cut cruelly short on June 5 1968, when he was fatally wounded by an assassin’s bullet. More than half a century later, his call for reform of how we assess progress (or its absence) has never been stronger.
The trouble with GDP: historical flaws
The way societies have understood and measured progress has changed considerably over the centuries. Measurement of “the economy” as a whole is a relatively modern, 20th-century concept, beginning with efforts by statisticians and economists such as Colin Clark and Simon Kuznets in the 1920s and 1930s to understand the impact of financial crisis and depression.
Kuznets, now best known for his curve describing the relationship between GDP and income inequality, was particularly concerned to develop a measure of economic welfare rather than just activity. For example, he argued for omitting expenditures that were unwelcome necessities rather than services or goods consumers actively wanted – such as defence spending.
However, the second world war overtook and absorbed these earlier notions of a single measure of economic welfare, resulting in what first became modern gross national product (GNP), and then GDP. The imperative – set out on the Allied side by John Maynard Keynes in his 1940 pamphlet How to Pay for the War – was measuring productive capacity, and the reduction in consumption required to have enough resources to support the military effort. Economic welfare was a peacetime concern.
Post-war, unsurprisingly, American and British economists such as Milton Gilbert, James Meade and Richard Stone took the lead in codifying these statistical definitions through the UN – and its process for agreeing and formalising definitions in the system of national accounts (SNA) is still in place today. However, since at least the 1940s, some important inadequacies of both the SNA and GDP have been widely known and debated.
Indeed, as long ago as 1934, Margaret Reid published her book Economics of Household Production, which pointed out the need to include unpaid work in the home when thinking about economically useful activity.
The question of whether and how to measure the household and informal sectors was debated during the 1950s – particularly as this makes up a larger share of activity in low-income countries – but was omitted until some countries, including the UK, started to create household satellite accounts around 2000. Omitting unpaid work meant, for instance, that the UK’s increased productivity growth between the 1960s and 1980s was then overstated, because it in part reflected the inclusion of many more women in paid work whose contributions had previously been invisible to the national GDP metric.
Another longstanding and widely understood failure of GDP is not including environmental externalities and the depletion of natural capital. The metric takes incomplete account of many activities that do not have market prices, and ignores the additional social costs of pollution, greenhouse gas emissions and similar outputs associated with economic activities.
What’s more, the depletion or loss of assets such as natural resources (or indeed buildings and infrastructure lost in disasters) boosts GDP in the short term because these resources are used in economic activities, or because there is a surge in construction after a disaster. Yet the long-term opportunity costs are never counted. This massive shortcoming was widely discussed at the time of landmark publications such as the 1972 Limits to Growth report from the Club of Rome, and the 1987 Brundtland Report from the World Commission on Environment and Development.
As with household and informal activity, there has been recent progress in accounting for nature, with the development of the System of Environmental Economic Accounting (SEEA) and publication of regular (but separate) statistics on natural capital in a number of countries. The UK has again been a pioneer in this area, while the US recently announced it would start following this approach too.
New challenges to the value of GDP
Other, perhaps less obvious failings of GDP have become more prominent recently. Digitisation of the economy has transformed the way many people spend their days in work and leisure, and the way many businesses operate, yet these transformations are not apparent in official statistics.
Measuring innovation has always been tricky, because new goods or improved quality need to be incorporated into observable prices and quantities – and what is the metric for a unit of software or management consultancy? But it is harder now because many digital services are “free” at point of use, or have the features of public goods in that many people can use them at the same time, or are intangible. For example, data is without doubt improving the productivity of companies that know how to use it to improve their services and produce goods more effectively – but how should a dataset’s value, or potential value, to society (as opposed to a big tech company) be estimated?
Recent work looking at the price of telecommunications services in the UK has estimated that output growth in this sector since 2010 has ranged anywhere from about 0% to 90%, depending on how the price index used to convert market prices to real (inflation-adjusted) prices takes account of the economic value of our rapidly growing use of data. Similarly, it is not obvious how to incorporate advertising-funded “free” search, crypto currencies and NFTs in the measurement framework.
A key limitation of GDP, particularly in terms of its use as an indicator of social progress, is that it offers no systematic account of the distribution of incomes. It is entirely possible for average or aggregate GDP to be rising, even as a significant proportion of the population find themselves worse off.
Ordinary incomes have stagnated or fallen in recent decades even as the richest in society have become wealthier. In the US, for example, Thomas Piketty and his colleagues have shown that in the period between 1980 and 2016, the top 0.001% of society saw their incomes grow by an average of 6% per year. Income for the poorest 5% of society fell in real terms.
Given these many issues, it might seem surprising that the debate about “Beyond GDP” is only now – possibly – turning into actions to change the official statistical framework. But paradoxically, one hurdle has been the proliferation of alternative progress metrics.
Whether these are single indices that combine a number of different indicators or dashboards showcasing a wide range of metrics, they have been ad hoc and too varied to build consensus around a new global way of measuring progress. Few of them provide an economic framework for consideration of trade-offs between the separate indicators, or guidance as to how to interpret indicators moving in different directions. There is a breadth of information but as a call to action, this cannot compete against the clarity of a single GDP statistic.
Statistical measurement is like a technical standard such as voltage in electricity networks or the Highway Code’s rules of the road: a shared standard or definition is essential. While an overwhelming majority might agree on the need to go beyond GDP, there also needs to be enough agreement about what “beyond” actually involves before meaningful progress on how we measure progress can be made.
Politicians can make it sound straightforward. Writing in 2009, the then-French president Nicolas Sarkozy explained he had convened a commission – led by internationally acclaimed economists Amartya Sen, Joseph Stiglitz and Jean-Paul Fitoussi – on the measurement of economic performance and social progress on the basis of a firm belief: that we will not change our behaviour “unless we change the ways we measure our economic performance”.
Sarkozy also committed to encouraging other countries and international organisations to follow the example of France in implementing his commission’s recommendations for a suite of measures beyond GDP. The ambition was no less than the construction of a new global economic, social and environmental order.
In 2010, the recently-elected UK prime minister, David Cameron, launched a programme to implement the Sarkozy commission’s recommendations in the UK. He described this as starting to measure progress as a country “not just by how our economy is growing, but by how our lives are improving – not just by our standard of living, but by our quality of life”.
Once again, the emphasis was on measurement (how far have we got?) rather than behaviour change (what should people do differently?). The implication is that changing what we measure necessarily leads to different behaviours – but the relationship is not that simple. Measures and measurers exist in political and social spheres, not as absolute facts and neutral agents to be accepted by all.
This should not dissuade statisticians from developing new measures, but it should prompt them to engage with all who might be affected – not just those in public policy, commerce or industry. The point after all is to change behaviour, not just to change the measures.
Economists are increasingly adopting complex systems thinking, including both social and psychological understandings of human behaviour. For example, Jonathan Michie has pointed to ethical and cultural values, as well as public policy and the market economy, as the big influences on behaviour. Katharina Lima di Miranda and Dennis Snower have highlighted social solidarity, individual agency and concern for the environment alongside the “traditional” economic incentives captured by GDP.
GDP alternatives in practice
Since Kennedy’s 1968 critique, there have been numerous initiatives to replace, augment or complement GDP over the years. Many dozens of indicators have been devised and implemented at local, national and international scales.
Some aim to account more directly for subjective wellbeing, for example by measuring self-reported life satisfaction or “happiness”. Some hope to reflect more accurately the state of our natural or social assets by developing adjusted monetary and non-monetary measures of “inclusive wealth” (including a team at the University of Cambridge led by this article’s co-author Diane Coyle). The UK government has accepted this as a meaningful approach to measurement in several recent policy documents, including its Levelling Up white paper.
There are two fundamental arguments for a wealth-based approach:
It embeds consideration for sustainability in the valuing of all assets: their value today depends on the entire future flow of services they make available. This is exactly why stockmarket prices can fall or rise suddenly, when expectations about the future change. Similarly, the prices at which assets such as natural resources or the climate are valued are not just market prices; the true “accounting prices” include social costs and externalities.
It also introduces several dimensions of progress, and flags up the correlations between them. Inclusive wealth includes produced, natural and human capital, and also intangible and social or organisational capital. Using a comprehensive wealth balance sheet to inform decisions could contribute to making better use of resources – for example, by considering the close links between sustaining natural assets and the social and human capital context of people living in areas where those assets are under threat.
Other initiatives aim to capture the multi-dimensional nature of social progress by compiling a dashboard of indicators – often measured in non-monetary terms – each of which attempts to track some aspect of what matters to society.
New Zealand’s Living Standards Framework is the best-known example of this dashboard approach. Dating back to a 1988 Royal Commission on Social Policy and developed over more than a decade within the New Zealand Treasury, this framework was precipitated by the need to do something about the discrepancy between what GDP can reflect and the ultimate aim of the Treasury: to make life better for people in New Zealand.
The NZ Treasury now uses it to allocate fiscal budgets in a manner consistent with the identified needs of the country in relation to social and environmental progress. The relevance to combating climate change is particularly clear: if government spending and investment are focused on narrow measures of economic output, there is every possibility that the deep decarbonisation needed to achieve a just transition to a net zero carbon economy will be impossible. Equally, by identifying areas of society with declining wellbeing, such as children’s mental health, it becomes possible to allocate Treasury resources directly to alleviate the problem.
The UK’s Measuring National Wellbeing (MNW) programme, directed by Paul Allin (a co-author of this article), was launched in November 2010 as part of a government-led drive to place greater emphasis on wellbeing in national life and business. Much of the emphasis was on the subjective personal wellbeing measures that the UK’s Office for National Statistics (ONS) continues to collect and publish, and which appear to be increasingly taken up as policy goals (driven in part by the What Works Centre for Wellbeing).
The MNW team was also charged with addressing the full “beyond GDP” agenda, and undertook a large consultation and engagement exercise to find out what matters to people in the UK. This provided the basis for a set of indicators covering ten broad areas which are updated by the ONS from time to time. While these indicators continue to be published, there is no evidence that they are being used to supplement GDP as the UK’s measure of progress.
Accounting for inequality within a single aggregate index is obviously tricky. But several solutions to this problem exist. One of them, advocated by the Sen-Stiglitz-Fitoussi commission, is to report median rather than mean (or average) values when calculating GDP per head.
Another fascinating possibility is to adjust the aggregate measure using a welfare-based index of inequality, such as the one devised by the late Tony Atkinson. An exercise using the Atkinson index carried out by Tim Jackson, also a co-author of this article, calculated that the welfare loss associated with inequality in the UK in 2016 amounted to almost £240 billion – around twice the annual budget of the NHS at that time.
Among the most ambitious attempts to create a single alternative to GDP is a measure which has become known as the Genuine Progress Indicator (GPI). Proposed initially by economist Herman Daly and theologian John Cobb, GPI attempts to adjust GDP for a range of factors – environmental, social and financial – which are not sufficiently well reflected in GDP itself.
GPI has been used as a progress indicator in the US state of Maryland since 2015. Indeed, a bill introduced to US Congress in July 2021 would, if enacted, require the Department of Commerce to publish a US GPI, and to “use both the indicator and GDP for budgetary reporting and economic forecasting”. GPI is also used in Atlantic Canada, where the process of building and publishing the index forms part of this community’s approach to its development.
A potential gamechanger?
In 2021, the UN secretary-general António Guterres concluded his Our Common Agenda report with a call for action. “We must urgently find measures of progress that complement GDP, as we were tasked to do by 2030 in target 17.19 of the Sustainable Development Goals.” He repeated this demand in his priorities for 2022 speech to the UN General Assembly.
Guterres called for a process “to bring together member states, international financial institutions and statistical, science and policy experts to identify a complement or complements to GDP that will measure inclusive and sustainable growth and prosperity, building on the work of the Statistical Commission”.
The first manual explaining the UN’s system of national accounts was published in 1953. It has since been through five revisions (the last in 2008) designed to catch up with developments in the economy and financial markets, as well as to meet user needs across the world for a wider spread of information.
The next SNA revision is currently in development, led by the UN Statistics Division and mainly involving national statistical offices, other statistical experts and institutional stakeholders such as the IMF, World Bank and Eurostat.
But unlike the UN’s COP processes relating to climate change and, to a lesser extent, biodiversity, there has, to date, been little wider engagement with interested parties – from business leaders and political parties to civil society, non-governmental organisations and the general public.
As the British science writer Ehsan Masood has observed, this revision process is happening below the radar of most people who are not currently users of national accounts. And this means many very useful ideas that could be being fed in are going unheard by those who will ultimately make decisions about how nations measure their progress in the future.
The essence of sustainable development was captured in the 1987 Brundtland Report: “To contribute to the welfare and wellbeing of the current generation, without compromising the potential of future generations for a better quality of life.” Yet it remains unclear how the next SNA revision will provide such an intergenerational lens, despite a new focus on “missing” capitals including natural capital.
Similarly, while the revision programme is addressing globalisation issues, these are only about global production and trade – not, for example, the impacts of national economies on the environment and wellbeing of other countries and populations.
Ambitious deadlines have been set further into the future: achieving the UN’s Sustainable Development Goals by 2030, and reducing global net emissions of greenhouse gases to zero before 2050. The SNA revision process – which will see a new system of national accounts agreed in 2023 and enacted from 2025 – is a key step in achieving these longer-term goals. That is why opening up this revision process to wider debate and scrutiny is so important.
It’s time to abandon this ‘GDP fetish’
One lesson to learn from the history of indicators, such as those about poverty and social exclusion, is that their impact and effectiveness depends not only on their technical robustness and their fitness for purpose, but also on the political and social context – what are the needs of the time, and the prevailing climate of ideas?
The current SNA revision should be a process as much about the use and usefulness of new measures as about their methodological rigour. Indeed, we might go as far as Gus O’Donnell, the former UK cabinet secretary, who said in 2020: “Of course measurement is hard. But roughly measuring the right concepts is a better way to make policy choices than using more precise measures of the wrong concepts.”
In short, there is an inherent tension involved in constructing an alternative to GDP – namely achieving a balance between technical robustness and social resonance. The complexity of a dashboard of indicators such as New Zealand’s Living Standards Framework is both an advantage in terms of meaningfulness, and a disadvantage in terms of communicability. In contrast, the simplicity of a single measure of progress such as the Genuine Progress Indicator – or, indeed, GDP – is both an advantage in terms of communication, and a disadvantage in terms of its inability to provide a more nuanced picture of progress.
Ultimately, a plurality of indicators is probably essential in navigating a pathway towards a sustainable prosperity that takes full account of individual and societal wellbeing. Having a wider range of measures should allow for more diverse narratives of progress.
Some momentum in the current SNA revisions process and ongoing statistical research is directed toward measurement of inclusive wealth – building on the economics of sustainability brought together in Partha Dasgupta’s recent review of the economics of biodiversity. This framework can probably gain a broad consensus among economists and statisticians, and is already being implemented by the UN, starting with natural capital and environmental accounting.
Including wellbeing measures in the mix would signal that wellbeing matters, at least to some of us, while also recognising that many different things can affect wellbeing. The evidence to date is that planting wellbeing measures in a different part of the data ecosystem means they will be overlooked or ignored. Wellbeing measures are not a panacea, but without them we will continue to do things that restrict rather than enhance wellbeing and fail to recognise the potential economic, social and environmental benefits that a wellbeing focus should bring.
The task of updating the statistical framework to measure economic progress better is non-trivial. The development of the SNA and its spread to many countries took years or even decades. New data collection methodologies should be able to speed things up now – but the first step in getting political buy-in to a better framework for the measurement of progress is an agreement about what to move to.
National accounting needs what the name suggests: an internally-consistent, exhaustive and mutually exclusive set of definitions and classifications. A new framework will require collecting different source data, and therefore changing the processes embedded in national statistical offices. It will need to incorporate recent changes in the economy due to digitalisation, as well as the long-standing issues such as inadequate measurement of environmental change.
Ultimately, this “beyond GDP” process needs to grapple not only with measurement problems but also with the various uses and abuses to which GDP has been put. Kennedy’s neat summary that it measures “everything except that which makes life worthwhile” points as much to the misuse of GDP as to its statistical limitations. Its elegance in being simultaneously a measure of income, spending and output means that in some form, it is likely to remain a valid tool for macroeconomic analysis. But its use as an unequivocal arbiter of social progress was never appropriate, and probably never will be.
Clearly, the desire to know if society is moving in the right direction remains a legitimate and important goal – perhaps more so now than ever. But in their search for a reliable guide towards social wellbeing, governments, businesses, statisticians, climate scientists and all other interested parties must abandon once and for all what the Nobel Laureate Stiglitz called a “GDP fetish”, and work with civil society, the media and the public to establish a more effective framework for measuring progress.
*Strictly speaking, Robert Kennedy referred to gross national product (GNP) in his 1968 speech. You can read more about the UN’s Towards the 2025 SNA process here.
– Shame on those who doubted the Dollar (at least of late).
The greenback has staged a recovery and is on a quest to revisit recent highs, as markets restore their bets for an ultra-hawkish Fed.
As a result, major G10 currencies are wilting under the weight of the resurgent buck:
EURUSD is flirting with parity again, having last done so in mid-July.
GBPUSD also hit a one-month low, trading around levels not seen since the onset of the pandemic.
Such moves are captured within the equally-weighted US Dollar index, which measures the greenback’s performance against these six G10 currencies:
GBP
EUR
CHF
CAD
AUD
NZD
As a result, this USD Index is retesting the mid-1.19 resistance levels which had previously repelled dollar bulls in mid-May and mid-June, also around where the 61.8% Fibonacci retracement level currently sits from its July-august descent.
Whether or not the US dollar can punch higher and break above the psychologically-important 1.20 level could well depend on what’s conveyed out of the Jackson Hole Economic Symposium later this week.
What is the Jackson Hole Symposium and why it matters?
Organized by the Kansas City Fed, this year’s gathering will be held from August 25th – 27th in Jackson Hole, Wyoming (though recent symposiums have been held virtually as well due to the pandemic).
This annual conference features the top central bankers, economists, academics, and even government representatives, where they discuss the most important issues facing the global economy, as well as how policymakers could and should respond.
In other words, what is said during this closely-watched symposium has the potential to prompt market participants to move trillions of dollars across asset classes including stocks, bonds, and currencies.
And Fed Chair Jerome Powell’s speech that’s scheduled for this Friday, August 26th, at 2:00 PM GMT, is set to dominate the market’s collective attention this week.
What Powell says (or doesn’t say) could dictate how global markets perform in the weeks ahead.
What markets want to know out of Jackson Hole?
Markets want to know how much the Fed intends to raise US interest rates for its September meeting, and beyond.
1) As things stand, markets are forecasting a 63.7% chance of yet another 75-basis point (bps) hike by the Fed at its September policy meeting.
Those odds have been increased substantially from 46.8% just from this time last week. Hence, the US dollar rising over the past week in tandem with such restored bets.
If the Fed does proceed with yet another 75bps hike, that would be its third successive supersized hike, following similar 75bps hikes at each of the Fed’s policy meetings back in June and July.
2) Markets also presently believe that that US benchmark rates could go up as high as 3.7% by May 2023, as the Fed continues aggressively raising interest rates to combat multi-decade high inflation.
Major deviations from the above (the existing narrative that markets are holding on to at present) should result in major moves for the US dollar.
Potential scenarios for USD Index:
Should Powell signal that the Fed has to stay aggressive to bring down US inflation (think more 75bps hikes in Q4), that could mean more immediate gains for the US dollar.
If the 1.20536 Fibonacci level can be conquered, then this equally-weighted USD Index could be on the path to revisit the mid-July peak above 1.21.
However, if Powell officially signals that the Fed can start to ease up on its rate hikes on signs that US inflation has peaked, that could prompt the unwinding of last week’s gains for the US dollar.
Support may arrive at the: – previous cycle high of 1.19102, followed by … – the next Fib line below at 1.18769 – 50-day simple moving average around 1.183
Despite the Fed’s suggestions to pay less attention to what it says it will do (forward guidance is less meaningful over the immediate term), but instead pay greater heed to the incoming US economic data (such as nonfarm payrolls and CPI), that likely won’t be enough to dissuade forward-looking investors and traders worldwide from reacting to Powell’s policy clues.
In short, don’t be surprised if we see heightened volatility for the US Dollar and the rest of the FX universe as the Jackson Hole symposium looms.
Here are the latest charts and statistics for the Commitment of Traders (COT) data published by the Commodities Futures Trading Commission (CFTC).
The latest COT data is updated through Tuesday August 16th and shows a quick view of how large traders (for-profit speculators and commercial entities) were positioned in the futures markets. All currency positions are in direct relation to the US dollar where, for example, a bet for the euro is a bet that the euro will rise versus the dollar while a bet against the euro will be a bet that the euro will decline versus the dollar.
Weekly Speculator Changes Week 33: CAD bets up, Euro bets down
The COT currency market speculator bets were overall higher this week as seven out of the eleven currency markets we cover had higher positioning while the other four markets had lower speculator positions.
Leading the gains for the currency markets was the Mexican peso (6,250 contracts) with the Canadian dollar (5,644 contracts), Brazilian real (4,790 contracts), Swiss franc (4,686 contracts), New Zealand dollar (2,045 contracts), British pound sterling (1,359 contracts) and Bitcoin (137 contracts) also having positive weeks.
The currencies leading the declines in speculator bets this week were the Euro (-8,248 contracts) with the Japanese yen (-3,859 contracts), Australian dollar (-1,660 contracts) and the US Dollar Index (-676 contracts) also registering lower bets on the week.
Highlighting the COT currency changes this week is the Canadian dollar‘s recent gains in the speculator positions. The CAD positions rose this week and have now gained for five straight weeks and in ten out of the past thirteen weeks for a total 13-week gain of +41,363 contracts. The speculative position had fallen into bearish territory from April 26th to June 7th before getting a large sentiment boost by +24,264 contracts on June 14th that flipped the position from bearish to bullish. Since then, the bullish position has steadily increased and this week, reached the most bullish level since July 6th of 2021, a span of fifty-eight weeks.
Euro speculative bets this week, meanwhile, fell for the first time in the past four weeks but made a new low for this recent bearish cycle. Euro bets dropped by over -8,000 contracts this week and have now been in an overall bearish position for the past ten weeks. The decline of bets this week brought the current speculator standing to the most bearish level since March 3rd of 2020, a span of one hundred and twenty-eight weeks. The EURUSD currency pair fell rather sharply to end the week (weekly decline by over -2.00 percent) and closed just a hair above parity at the 1.0041 exchange rate. The EURUSD dropped below parity for a quick time on July 14th with a low of 0.9952 (20-year lows) before staging a rally back over 1.0350 in the following weeks but with deteriorating speculator sentiment, it seems possible the pair will be testing below parity again.
Strength Scores (a normalized measure of Speculator positions over a 3-Year range, from 0 to 100 where above 80 is extreme bullish and below 20 is extreme bearish) show that the US Dollar Index (88.2 percent) remains at the highest levels for the currency markets and continues in a bullish extreme position (above 80 percent). Bitcoin (78.6 percent), the New Zealand Dollar (74.2 percent) and the Canadian Dollar (69.5 percent) round out the next highest strength scores in the currency markets. On the downside, the Mexican Peso (18.2 percent) comes in at the lowest strength level and is in a bearish extreme level (below 20 percent). The next currencies at the lower range of strength scores are the EuroFX at 21.9 percent and the Australian Dollar at 29.9 percent.
Strength Statistics: US Dollar Index (88.2 percent) vs US Dollar Index previous week (89.4 percent) EuroFX (21.9 percent) vs EuroFX previous week (24.4 percent) British Pound Sterling (46.1 percent) vs British Pound Sterling previous week (45.0 percent) Japanese Yen (51.1 percent) vs Japanese Yen previous week (53.5 percent) Swiss Franc (43.6 percent) vs Swiss Franc previous week (31.7 percent) Canadian Dollar (69.5 percent) vs Canadian Dollar previous week (63.2 percent) Australian Dollar (29.9 percent) vs Australian Dollar previous week (31.4 percent) New Zealand Dollar (74.2 percent) vs New Zealand Dollar previous week (70.8 percent) Mexican Peso (18.2 percent) vs Mexican Peso previous week (15.6 percent) Brazil Real (56.8 percent) vs Brazil Real previous week (52.1 percent) Bitcoin (78.6 percent) vs Bitcoin previous week (76.1 percent)
Strength Trends
Strength Score Trends (or move index, calculates the 6-week changes in strength scores) show that the Canadian Dollar (25.3 percent) leads the past six weeks trends for the currency markets this week. The British Pound Sterling (18.0 percent), the Japanese Yen (15.7 percent) and the New Zealand Dollar (14.8 percent) fill out the other highest movers in the latest trends data. The Australian Dollar (-10.8 percent) leads the downside trend scores currently while the next market with lower trend scores were the Brazilian Real (-9.6 percent) followed by Bitcoin (-9.3 percent) and the EuroFX (-8.0 percent).
Strength Trend Statistics: US Dollar Index (-2.2 percent) vs US Dollar Index previous week (-7.7 percent) EuroFX (-8.0 percent) vs EuroFX previous week (-7.3 percent) British Pound Sterling (18.0 percent) vs British Pound Sterling previous week (14.5 percent) Japanese Yen (15.7 percent) vs Japanese Yen previous week (17.0 percent) Swiss Franc (12.8 percent) vs Swiss Franc previous week (-3.0 percent) Canadian Dollar (25.3 percent) vs Canadian Dollar previous week (13.6 percent) Australian Dollar (-10.8 percent) vs Australian Dollar previous week (-13.5 percent) New Zealand Dollar (14.8 percent) vs New Zealand Dollar previous week (8.4 percent) Mexican Peso (-3.0 percent) vs Mexican Peso previous week (-5.8 percent) Brazil Real (-9.6 percent) vs Brazil Real previous week (-34.7 percent) Bitcoin (-9.3 percent) vs Bitcoin previous week (-23.9 percent)
Individual Markets:
US Dollar Index Futures:
The US Dollar Index large speculator standing this week was a net position of 37,961 contracts in the data reported through Tuesday. This was a weekly fall of -676 contracts from the previous week which had a total of 38,637 net contracts.
This week’s current strength score (the trader positioning range over the past three years, measured from 0 to 100) shows the speculators are currently Bullish-Extreme with a score of 88.2 percent. The commercials are Bearish-Extreme with a score of 11.2 percent and the small traders (not shown in chart) are Bearish with a score of 46.2 percent.
US DOLLAR INDEX Statistics
SPECULATORS
COMMERCIALS
SMALL TRADERS
– Percent of Open Interest Longs:
86.2
3.5
8.2
– Percent of Open Interest Shorts:
21.8
72.6
3.6
– Net Position:
37,961
-40,673
2,712
– Gross Longs:
50,782
2,078
4,843
– Gross Shorts:
12,821
42,751
2,131
– Long to Short Ratio:
4.0 to 1
0.0 to 1
2.3 to 1
NET POSITION TREND:
– Strength Index Score (3 Year Range Pct):
88.2
11.2
46.2
– Strength Index Reading (3 Year Range):
Bullish-Extreme
Bearish-Extreme
Bearish
NET POSITION MOVEMENT INDEX:
– 6-Week Change in Strength Index:
-2.2
1.3
5.0
Euro Currency Futures:
The Euro Currency large speculator standing this week was a net position of -42,784 contracts in the data reported through Tuesday. This was a weekly reduction of -8,248 contracts from the previous week which had a total of -34,536 net contracts.
This week’s current strength score (the trader positioning range over the past three years, measured from 0 to 100) shows the speculators are currently Bearish with a score of 21.9 percent. The commercials are Bullish-Extreme with a score of 82.0 percent and the small traders (not shown in chart) are Bearish-Extreme with a score of 10.6 percent.
EURO Currency Statistics
SPECULATORS
COMMERCIALS
SMALL TRADERS
– Percent of Open Interest Longs:
28.5
57.3
11.4
– Percent of Open Interest Shorts:
34.6
54.3
8.3
– Net Position:
-42,784
20,916
21,868
– Gross Longs:
199,226
400,458
79,589
– Gross Shorts:
242,010
379,542
57,721
– Long to Short Ratio:
0.8 to 1
1.1 to 1
1.4 to 1
NET POSITION TREND:
– Strength Index Score (3 Year Range Pct):
21.9
82.0
10.6
– Strength Index Reading (3 Year Range):
Bearish
Bullish-Extreme
Bearish-Extreme
NET POSITION MOVEMENT INDEX:
– 6-Week Change in Strength Index:
-8.0
8.4
-6.0
British Pound Sterling Futures:
The British Pound Sterling large speculator standing this week was a net position of -33,109 contracts in the data reported through Tuesday. This was a weekly gain of 1,359 contracts from the previous week which had a total of -34,468 net contracts.
This week’s current strength score (the trader positioning range over the past three years, measured from 0 to 100) shows the speculators are currently Bearish with a score of 46.1 percent. The commercials are Bullish with a score of 58.7 percent and the small traders (not shown in chart) are Bearish with a score of 26.4 percent.
BRITISH POUND Statistics
SPECULATORS
COMMERCIALS
SMALL TRADERS
– Percent of Open Interest Longs:
19.4
68.6
8.7
– Percent of Open Interest Shorts:
33.9
47.8
14.9
– Net Position:
-33,109
47,217
-14,108
– Gross Longs:
44,084
156,167
19,890
– Gross Shorts:
77,193
108,950
33,998
– Long to Short Ratio:
0.6 to 1
1.4 to 1
0.6 to 1
NET POSITION TREND:
– Strength Index Score (3 Year Range Pct):
46.1
58.7
26.4
– Strength Index Reading (3 Year Range):
Bearish
Bullish
Bearish
NET POSITION MOVEMENT INDEX:
– 6-Week Change in Strength Index:
18.0
-17.9
13.9
Japanese Yen Futures:
The Japanese Yen large speculator standing this week was a net position of -28,891 contracts in the data reported through Tuesday. This was a weekly lowering of -3,859 contracts from the previous week which had a total of -25,032 net contracts.
This week’s current strength score (the trader positioning range over the past three years, measured from 0 to 100) shows the speculators are currently Bullish with a score of 51.1 percent. The commercials are Bullish with a score of 56.1 percent and the small traders (not shown in chart) are Bearish with a score of 26.9 percent.
JAPANESE YEN Statistics
SPECULATORS
COMMERCIALS
SMALL TRADERS
– Percent of Open Interest Longs:
22.4
66.6
9.4
– Percent of Open Interest Shorts:
35.1
48.2
15.1
– Net Position:
-28,891
41,979
-13,088
– Gross Longs:
51,308
152,209
21,465
– Gross Shorts:
80,199
110,230
34,553
– Long to Short Ratio:
0.6 to 1
1.4 to 1
0.6 to 1
NET POSITION TREND:
– Strength Index Score (3 Year Range Pct):
51.1
56.1
26.9
– Strength Index Reading (3 Year Range):
Bullish
Bullish
Bearish
NET POSITION MOVEMENT INDEX:
– 6-Week Change in Strength Index:
15.7
-10.8
-7.0
Swiss Franc Futures:
The Swiss Franc large speculator standing this week was a net position of -5,096 contracts in the data reported through Tuesday. This was a weekly increase of 4,686 contracts from the previous week which had a total of -9,782 net contracts.
This week’s current strength score (the trader positioning range over the past three years, measured from 0 to 100) shows the speculators are currently Bearish with a score of 43.6 percent. The commercials are Bullish with a score of 65.2 percent and the small traders (not shown in chart) are Bearish with a score of 28.7 percent.
SWISS FRANC Statistics
SPECULATORS
COMMERCIALS
SMALL TRADERS
– Percent of Open Interest Longs:
19.7
55.2
24.9
– Percent of Open Interest Shorts:
32.7
20.7
46.5
– Net Position:
-5,096
13,616
-8,520
– Gross Longs:
7,773
21,767
9,809
– Gross Shorts:
12,869
8,151
18,329
– Long to Short Ratio:
0.6 to 1
2.7 to 1
0.5 to 1
NET POSITION TREND:
– Strength Index Score (3 Year Range Pct):
43.6
65.2
28.7
– Strength Index Reading (3 Year Range):
Bearish
Bullish
Bearish
NET POSITION MOVEMENT INDEX:
– 6-Week Change in Strength Index:
12.8
-10.3
4.8
Canadian Dollar Futures:
The Canadian Dollar large speculator standing this week was a net position of 26,867 contracts in the data reported through Tuesday. This was a weekly increase of 5,644 contracts from the previous week which had a total of 21,223 net contracts.
This week’s current strength score (the trader positioning range over the past three years, measured from 0 to 100) shows the speculators are currently Bullish with a score of 69.5 percent. The commercials are Bearish with a score of 42.0 percent and the small traders (not shown in chart) are Bearish with a score of 40.7 percent.
CANADIAN DOLLAR Statistics
SPECULATORS
COMMERCIALS
SMALL TRADERS
– Percent of Open Interest Longs:
35.1
39.6
22.4
– Percent of Open Interest Shorts:
16.9
61.4
18.9
– Net Position:
26,867
-32,129
5,262
– Gross Longs:
51,843
58,476
33,129
– Gross Shorts:
24,976
90,605
27,867
– Long to Short Ratio:
2.1 to 1
0.6 to 1
1.2 to 1
NET POSITION TREND:
– Strength Index Score (3 Year Range Pct):
69.5
42.0
40.7
– Strength Index Reading (3 Year Range):
Bullish
Bearish
Bearish
NET POSITION MOVEMENT INDEX:
– 6-Week Change in Strength Index:
25.3
-23.0
10.1
Australian Dollar Futures:
The Australian Dollar large speculator standing this week was a net position of -59,248 contracts in the data reported through Tuesday. This was a weekly fall of -1,660 contracts from the previous week which had a total of -57,588 net contracts.
This week’s current strength score (the trader positioning range over the past three years, measured from 0 to 100) shows the speculators are currently Bearish with a score of 29.9 percent. The commercials are Bullish with a score of 66.2 percent and the small traders (not shown in chart) are Bearish with a score of 42.1 percent.
AUSTRALIAN DOLLAR Statistics
SPECULATORS
COMMERCIALS
SMALL TRADERS
– Percent of Open Interest Longs:
18.0
69.3
10.4
– Percent of Open Interest Shorts:
55.0
29.6
13.0
– Net Position:
-59,248
63,470
-4,222
– Gross Longs:
28,835
110,918
16,660
– Gross Shorts:
88,083
47,448
20,882
– Long to Short Ratio:
0.3 to 1
2.3 to 1
0.8 to 1
NET POSITION TREND:
– Strength Index Score (3 Year Range Pct):
29.9
66.2
42.1
– Strength Index Reading (3 Year Range):
Bearish
Bullish
Bearish
NET POSITION MOVEMENT INDEX:
– 6-Week Change in Strength Index:
-10.8
5.8
9.4
New Zealand Dollar Futures:
The New Zealand Dollar large speculator standing this week was a net position of 1,769 contracts in the data reported through Tuesday. This was a weekly lift of 2,045 contracts from the previous week which had a total of -276 net contracts.
This week’s current strength score (the trader positioning range over the past three years, measured from 0 to 100) shows the speculators are currently Bullish with a score of 74.2 percent. The commercials are Bearish with a score of 30.7 percent and the small traders (not shown in chart) are Bearish with a score of 29.1 percent.
NEW ZEALAND DOLLAR Statistics
SPECULATORS
COMMERCIALS
SMALL TRADERS
– Percent of Open Interest Longs:
44.1
49.6
5.9
– Percent of Open Interest Shorts:
39.9
49.1
10.6
– Net Position:
1,769
195
-1,964
– Gross Longs:
18,412
20,688
2,458
– Gross Shorts:
16,643
20,493
4,422
– Long to Short Ratio:
1.1 to 1
1.0 to 1
0.6 to 1
NET POSITION TREND:
– Strength Index Score (3 Year Range Pct):
74.2
30.7
29.1
– Strength Index Reading (3 Year Range):
Bullish
Bearish
Bearish
NET POSITION MOVEMENT INDEX:
– 6-Week Change in Strength Index:
14.8
-15.9
17.3
Mexican Peso Futures:
The Mexican Peso large speculator standing this week was a net position of -21,371 contracts in the data reported through Tuesday. This was a weekly gain of 6,250 contracts from the previous week which had a total of -27,621 net contracts.
This week’s current strength score (the trader positioning range over the past three years, measured from 0 to 100) shows the speculators are currently Bearish-Extreme with a score of 18.2 percent. The commercials are Bullish-Extreme with a score of 80.2 percent and the small traders (not shown in chart) are Bullish with a score of 58.1 percent.
MEXICAN PESO Statistics
SPECULATORS
COMMERCIALS
SMALL TRADERS
– Percent of Open Interest Longs:
53.9
42.7
3.4
– Percent of Open Interest Shorts:
64.5
33.8
1.6
– Net Position:
-21,371
17,803
3,568
– Gross Longs:
108,642
85,997
6,782
– Gross Shorts:
130,013
68,194
3,214
– Long to Short Ratio:
0.8 to 1
1.3 to 1
2.1 to 1
NET POSITION TREND:
– Strength Index Score (3 Year Range Pct):
18.2
80.2
58.1
– Strength Index Reading (3 Year Range):
Bearish-Extreme
Bullish-Extreme
Bullish
NET POSITION MOVEMENT INDEX:
– 6-Week Change in Strength Index:
-3.0
3.2
-3.2
Brazilian Real Futures:
The Brazilian Real large speculator standing this week was a net position of 6,523 contracts in the data reported through Tuesday. This was a weekly rise of 4,790 contracts from the previous week which had a total of 1,733 net contracts.
This week’s current strength score (the trader positioning range over the past three years, measured from 0 to 100) shows the speculators are currently Bullish with a score of 56.8 percent. The commercials are Bearish with a score of 42.8 percent and the small traders (not shown in chart) are Bullish-Extreme with a score of 89.8 percent.
BRAZIL REAL Statistics
SPECULATORS
COMMERCIALS
SMALL TRADERS
– Percent of Open Interest Longs:
67.7
22.7
9.7
– Percent of Open Interest Shorts:
50.5
45.4
4.1
– Net Position:
6,523
-8,659
2,136
– Gross Longs:
25,762
8,637
3,679
– Gross Shorts:
19,239
17,296
1,543
– Long to Short Ratio:
1.3 to 1
0.5 to 1
2.4 to 1
NET POSITION TREND:
– Strength Index Score (3 Year Range Pct):
56.8
42.8
89.8
– Strength Index Reading (3 Year Range):
Bullish
Bearish
Bullish-Extreme
NET POSITION MOVEMENT INDEX:
– 6-Week Change in Strength Index:
-9.6
8.5
12.5
Bitcoin Futures:
The Bitcoin large speculator standing this week was a net position of -93 contracts in the data reported through Tuesday. This was a weekly lift of 137 contracts from the previous week which had a total of -230 net contracts.
This week’s current strength score (the trader positioning range over the past three years, measured from 0 to 100) shows the speculators are currently Bullish with a score of 78.6 percent. The commercials are Bearish with a score of 42.6 percent and the small traders (not shown in chart) are Bearish with a score of 21.0 percent.
*COT Report: The COT data, released weekly to the public each Friday, is updated through the most recent Tuesday (data is 3 days old) and shows a quick view of how large speculators or non-commercials (for-profit traders) were positioned in the futures markets.
The CFTC categorizes trader positions according to commercial hedgers (traders who use futures contracts for hedging as part of the business), non-commercials (large traders who speculate to realize trading profits) and nonreportable traders (usually small traders/speculators) as well as their open interest (contracts open in the market at time of reporting).See CFTC criteria here.
Here are the latest charts and statistics for the Commitment of Traders (COT) data published by the Commodities Futures Trading Commission (CFTC).
The latest COT data is updated through Tuesday August 16th and shows a quick view of how large traders (for-profit speculators and commercial entities) were positioned in the futures markets.
COTprecious metals speculator bets were overall higher this week as four out of the five metals markets we cover had higher positioning this week with just one market had lower contracts.
Leading the gains for the precious metals markets was Platinum (2,094 contracts) with Silver (629 contracts), Palladium (371 contracts) and Copper (257 contracts) also showing positive weeks.
The metals markets leading the declines in speculator bets this week were Gold (-1,687 contracts) on the week.
Highlighting the metals data this week is that Platinum speculator bets that have bounced back a bit over the past three weeks after a recent down-streak that put the position in negative territory. The Platinum large speculator positions rose this week for a third straight week and for the fourth time over the past five weeks. This recent uptick has pulled the overall position out of a bearish level that had held from June 28th to August 2nd. This week, the current position increased into a small bullish level of +2,940 contracts. The Platinum futures price, meanwhile, took a step back this week with a loss. The futures had previously seen four straight weekly gains before closing the week below the $900.00 level.
Data Snapshot of Commodity Market Traders | Columns Legend
Aug-16-2022
OI
OI-Index
Spec-Net
Spec-Index
Com-Net
COM-Index
Smalls-Net
Smalls-Index
WTI Crude
1,557,349
0
214,940
1
-239,291
100
24,351
48
Gold
453,960
0
141,164
19
-153,709
84
12,545
4
Silver
144,314
11
3,508
10
-12,451
90
8,943
12
Copper
183,500
17
-28,220
22
28,932
79
-712
21
Palladium
7,951
7
-1,599
14
1,536
83
63
48
Platinum
57,254
17
2,940
12
-6,361
90
3,421
10
Natural Gas
983,460
5
-120,911
42
82,862
57
38,049
70
Brent
176,902
21
-36,012
51
34,290
50
1,722
33
Heating Oil
296,987
34
24,926
79
-40,022
29
15,096
51
Soybeans
595,095
5
83,183
39
-51,650
68
-31,533
18
Corn
1,316,462
1
220,129
58
-166,318
48
-53,811
12
Coffee
190,302
0
33,471
68
-35,318
37
1,847
16
Sugar
737,535
7
49,970
47
-61,837
56
11,867
23
Wheat
313,237
11
-1,908
17
7,448
70
-5,540
82
Strength Scores
Strength scores (a measure of the 3-Year range of Speculator positions, from 0 to 100 where above 80 is extreme bullish and below 20 is extreme bearish) showed that Copper is the highest metals market currently at just 22.0 percent of its 3-year range. The rest of the metals markets are all in bearish extreme levels (below 20 percent) and have been for a while now. Gold (18.6 percent), Palladium (13.8 percent), Platinum (12.0 percent) and Silver (9.7 percent) round out the rest of the metals market in strength scores.
Strength Statistics: Gold (18.6 percent) vs Gold previous week (19.2 percent) Silver (9.7 percent) vs Silver previous week (9.0 percent) Copper (22.0 percent) vs Copper previous week (21.9 percent) Platinum (12.0 percent) vs Platinum previous week (9.2 percent) Palladium (13.8 percent) vs Palladium previous week (11.7 percent)
Strength Trends
Strength Score Trends (or move index, calculates the 6-week changes in strength scores) show that Palladium (10.2 percent) leads the past six weeks trends for metals this week. Platinum (7.7 percent) and Copper (2.6 percent) are the only other positive movers in the latest trends data. Silver (-2.0 percent) and Gold (-1.7 percent) lead the downside trend scores currently but have both improved since last week.
Move Statistics: Gold (-1.7 percent) vs Gold previous week (-5.7 percent) Silver (-2.0 percent) vs Silver previous week (-9.7 percent) Copper (2.6 percent) vs Copper previous week (1.6 percent) Platinum (7.7 percent) vs Platinum previous week (2.9 percent) Palladium (10.2 percent) vs Palladium previous week (10.4 percent)
Individual Markets:
Gold Comex Futures:
The Gold Comex Futures large speculator standing this week reached a net position of 141,164 contracts in the data reported through Tuesday. This was a weekly fall of -1,687 contracts from the previous week which had a total of 142,851 net contracts.
This week’s current strength score (the trader positioning range over the past three years, measured from 0 to 100) shows the speculators are currently Bearish-Extreme with a score of 18.6 percent. The commercials are Bullish-Extreme with a score of 83.7 percent and the small traders (not shown in chart) are Bearish-Extreme with a score of 3.6 percent.
Gold Futures Statistics
SPECULATORS
COMMERCIALS
SMALL TRADERS
– Percent of Open Interest Longs:
52.5
27.0
8.3
– Percent of Open Interest Shorts:
21.4
60.9
5.6
– Net Position:
141,164
-153,709
12,545
– Gross Longs:
238,196
122,566
37,826
– Gross Shorts:
97,032
276,275
25,281
– Long to Short Ratio:
2.5 to 1
0.4 to 1
1.5 to 1
NET POSITION TREND:
– Strength Index Score (3 Year Range Pct):
18.6
83.7
3.6
– Strength Index Reading (3 Year Range):
Bearish-Extreme
Bullish-Extreme
Bearish-Extreme
NET POSITION MOVEMENT INDEX:
– 6-Week Change in Strength Index:
-1.7
4.3
-20.2
Silver Comex Futures:
The Silver Comex Futures large speculator standing this week reached a net position of 3,508 contracts in the data reported through Tuesday. This was a weekly rise of 629 contracts from the previous week which had a total of 2,879 net contracts.
This week’s current strength score (the trader positioning range over the past three years, measured from 0 to 100) shows the speculators are currently Bearish-Extreme with a score of 9.7 percent. The commercials are Bullish-Extreme with a score of 90.0 percent and the small traders (not shown in chart) are Bearish-Extreme with a score of 12.3 percent.
Silver Futures Statistics
SPECULATORS
COMMERCIALS
SMALL TRADERS
– Percent of Open Interest Longs:
33.2
41.4
16.1
– Percent of Open Interest Shorts:
30.7
50.0
9.9
– Net Position:
3,508
-12,451
8,943
– Gross Longs:
47,851
59,753
23,230
– Gross Shorts:
44,343
72,204
14,287
– Long to Short Ratio:
1.1 to 1
0.8 to 1
1.6 to 1
NET POSITION TREND:
– Strength Index Score (3 Year Range Pct):
9.7
90.0
12.3
– Strength Index Reading (3 Year Range):
Bearish-Extreme
Bullish-Extreme
Bearish-Extreme
NET POSITION MOVEMENT INDEX:
– 6-Week Change in Strength Index:
-2.0
-0.8
12.0
Copper Grade #1 Futures:
The Copper Grade #1 Futures large speculator standing this week reached a net position of -28,220 contracts in the data reported through Tuesday. This was a weekly rise of 257 contracts from the previous week which had a total of -28,477 net contracts.
This week’s current strength score (the trader positioning range over the past three years, measured from 0 to 100) shows the speculators are currently Bearish with a score of 22.0 percent. The commercials are Bullish with a score of 79.3 percent and the small traders (not shown in chart) are Bearish with a score of 21.2 percent.
Copper Futures Statistics
SPECULATORS
COMMERCIALS
SMALL TRADERS
– Percent of Open Interest Longs:
25.5
46.4
7.7
– Percent of Open Interest Shorts:
40.9
30.7
8.1
– Net Position:
-28,220
28,932
-712
– Gross Longs:
46,797
85,187
14,097
– Gross Shorts:
75,017
56,255
14,809
– Long to Short Ratio:
0.6 to 1
1.5 to 1
1.0 to 1
NET POSITION TREND:
– Strength Index Score (3 Year Range Pct):
22.0
79.3
21.2
– Strength Index Reading (3 Year Range):
Bearish
Bullish
Bearish
NET POSITION MOVEMENT INDEX:
– 6-Week Change in Strength Index:
2.6
-1.7
-6.8
Platinum Futures:
The Platinum Futures large speculator standing this week reached a net position of 2,940 contracts in the data reported through Tuesday. This was a weekly lift of 2,094 contracts from the previous week which had a total of 846 net contracts.
This week’s current strength score (the trader positioning range over the past three years, measured from 0 to 100) shows the speculators are currently Bearish-Extreme with a score of 12.0 percent. The commercials are Bullish-Extreme with a score of 90.2 percent and the small traders (not shown in chart) are Bearish-Extreme with a score of 9.6 percent.
Platinum Futures Statistics
SPECULATORS
COMMERCIALS
SMALL TRADERS
– Percent of Open Interest Longs:
45.8
39.7
11.3
– Percent of Open Interest Shorts:
40.7
50.8
5.3
– Net Position:
2,940
-6,361
3,421
– Gross Longs:
26,218
22,749
6,467
– Gross Shorts:
23,278
29,110
3,046
– Long to Short Ratio:
1.1 to 1
0.8 to 1
2.1 to 1
NET POSITION TREND:
– Strength Index Score (3 Year Range Pct):
12.0
90.2
9.6
– Strength Index Reading (3 Year Range):
Bearish-Extreme
Bullish-Extreme
Bearish-Extreme
NET POSITION MOVEMENT INDEX:
– 6-Week Change in Strength Index:
7.7
-6.1
-13.7
Palladium Futures:
The Palladium Futures large speculator standing this week reached a net position of -1,599 contracts in the data reported through Tuesday. This was a weekly advance of 371 contracts from the previous week which had a total of -1,970 net contracts.
This week’s current strength score (the trader positioning range over the past three years, measured from 0 to 100) shows the speculators are currently Bearish-Extreme with a score of 13.8 percent. The commercials are Bullish-Extreme with a score of 83.4 percent and the small traders (not shown in chart) are Bearish with a score of 47.5 percent.
*COT Report: The COT data, released weekly to the public each Friday, is updated through the most recent Tuesday (data is 3 days old) and shows a quick view of how large speculators or non-commercials (for-profit traders) were positioned in the futures markets.
The CFTC categorizes trader positions according to commercial hedgers (traders who use futures contracts for hedging as part of the business), non-commercials (large traders who speculate to realize trading profits) and nonreportable traders (usually small traders/speculators) as well as their open interest (contracts open in the market at time of reporting).See CFTC criteria here.
It’s been another eventful week for financial markets with action across currency, commodity and stock markets.
Before we proceed, I know some of you are wondering what is going on here. Well, I have hijacked the Thursday 101 slot to share my thoughts and personal experiences with markets this week!
While this may not follow the normal style of our market reports, we still aim to provide key insight and information on market themes complemented with some trading setups to watch out for.
Game plan #1 – USD hunting gone wrong
I marched into the trading week heavily equipped with the fundamental knowledge and technical weapons to hunt dollar bulls. With signs of easing inflationary pressures in the United States fuelling speculation around the Fed adopting a less aggressive approach towards rates, the dollar looked like an easy tasty meal. However, the greenback drew ample strength from weak Chinese economic data on Monday – eventually trampling all obstacles and G10 currencies in its path.
The bearish dollar setup I had in mind was blown out of the water. Instead of the Dollar Index (DXY) respecting the daily bearish channel, prices pushed above 106.00, signalling an incline back towards 107.30.
The same could be said for the equally-weighted dollar index which blasted back above 1.1700. Prices seem to be finding resistance around the 50-day SMA. It will be interesting to see whether this level limits further upside gains.
Game plan # 2 – If you can’t beat them…join them
After witnessing the dollar’s rebound on Monday, I decided to hitch a ride with bulls on Tuesday.
The EURUSD snatched my attention as prices tumbled back below 1.0200. Even though the currency pair remains in a range, the path of least resistance points south with 1.0100 acting as the first level of interest. Looking at the current price action, we are not expecting any fireworks for the rest of the week. But bears seem to be creating a foundation for a steeper decline in the week ahead.
Game plan #3 – Inflation heartache boost BoE hike bets
On Wednesday morning I felt nauseous and uneasy after official data revealed that UK inflation rose 10.1% in July. As the inflation menace causes havoc across the UK economy, households are feeling the squeeze. Everything from the price of food, energy, and services is increasing dangerously. Yesterday evening I witnessed a man argue with a shop owner over the price of bread and this morning I found myself in a heated conversation with my energy provider.
Rising inflation will most likely force the BoE to aggressively raise interest rates but will also fuel uncertainty over the UK’s economic outlook. Looking at the GBPUSD, it remains in a range on the daily chart with support at 1.2000. Best to revisit this next week when more life returns to the FX space.
Game plan #4 – Riding the volatile Yen wave
Hats off to my intraday traders that were able to tame the Yen beast this week.
The EURJPY and GBPJPY were untamed and ready to dish out punishment to any trader unprepared. Both tumbled on Monday, only to experience a sharp rebound on Tuesday and Wednesday! We can see some resistance around 138.00 for the EURJPY and 164.00 for the GBPJPY. Should these levels hold, the currency pairs could resume their descent in the new trading week.
Game plan #5 – Classic breakdown on gold
The last time gold secured a daily close below $1770 was at the start of the month. After flirting within a range for almost three weeks, it looks like the precious metal is ready to move lower. Interestingly, the precious metal somewhat ignored the minutes from the Fed’s July meeting. Policymakers saw inflation as a significant risk to the economy and indicated they would not pull back on rates until inflation came down. With inflation in the United States cooling to 8.5% in July, traders have cut bets over how aggressive the Fed will be on rates. In fact, markets are currently pricing in a 47% probability of a 75bp rate hike in September.
Talking technicals sustained weakness below $1770 could open the doors towards $1752 and $1724, respectfully.
Fibonacci Retracements are a common technical analysis technique in financial trading based on a famous mathematical sequence. In this article, we touch on what Fibonacci Retracements are, what levels most traders or investors use and finally, we look at a few Fibonacci Retracements Trends Trading or Trend-following examples.
The Fibonacci Retracement indicator is a powerful tool that can help you make better trading decisions. It is one of the most common technical analysis techniques used for analyzing the financial markets. It is based on the Fibonacci sequence, which is a series of numbers that have a special relationship to each other. Many professional traders and analysts look to fibonacci retracements, also known as fibo levels or fib levels, to predict support and resistance price areas. Retracements can be used to detect potential turning points in price as well.
To analyze price using Fibonacci Retracements, traders will frequently look for retracement levels at 23.6%, 38.2%, 50%, and 61.8% of recent prices moves. These percentages represent possible areas of support or resistance where the price may retrace before continuing in the original direction. Traders may also use Fibonacci Retracements to identify potential price turning points by looking for reversals at these same levels.
Who was Fibonacci? What are Fibonacci Numbers?
Fibonacci was an Italian mathematician from Pisa, also known as Leonardo of Pisa, who is famous for his Fibonacci numbers, a mathematical sequence that happens to appear in many places including in nature and in statistics. Fibonacci did not invent this numeric sequence as it is believed to have originated in India. His 1202 book “Liber Abaci” introduced the sequence to Western European mathematics, and the Fibonacci sequence has been used ever since in mathematical and scientific contexts.
The Fibonacci sequence appears in nature, in the arrangement of leaves on a stem, the fruit sprouts of a pineapple, the flowering of an artichoke, an uncurling fern and the arrangement of a pine cone, as well as many other places. The Fibonacci sequence is also found in the spiral galaxies of the universe. In fact, the Fibonacci sequence can be found in everything from the smallest of organisms to the largest of structures in the cosmos.
The Fibonacci sequence is not just a mathematical curiosity. It has applications in engineering, computer science, biology and can be used to model or predict population growth. The Fibonacci sequence is used to generate efficient algorithms and, for our focus today, can be used to help with trading in the financial markets.
The Fibonacci sequence is actually a simple straight-forward pattern. Start with 0 and 1 and add them to get 1. Then use a pattern of adding each number to the preceding number to get the next number. Follow that pattern over and over and over again. 0 and 1 equals 1. Then add 1 and 1 to equal 2. Next, 2 and 1 equals 3 and so on. So the first fifteen Fibonacci numbers look like this: 0, 1, 1, 2, 3, 5, 8, 13, 21, 34, 55, 89, 144, 233, 377. As you can see, once you get past the first five or so numbers, they can start to really add up and they just keep on going.
There is also another notable aspect to the Fibonacci sequence that is famous as well – the golden ratio. Each of the numbers in Fibonacci sequence are approximately 1.618 larger than the preceding number. This number is considered the golden ratio and this fibonacci ratio can be found in many aspects of nature and in many mathematical, scientific and artistic constructions by humans. This golden ratio can also found in the proportions of the human body.
How to use Fibonacci in financial trading?
Ok, since we have a general understanding of the Fibonacci numbers, how can we use them to help in our trading? Well, to be honest, there are a lot of different ways that traders use Fibonacci numbers in financial trading, probably more than any one person could ever learn. Some use them to predict market movements, while others use them to set stop-losses or take-profits. There are those who use Fibonacci numbers for both, as well as traders who use different types of Fibonacci strategies.
The most common use for Fibonacci numbers that I see is to use them for support and resistance levels. This is where the Fibo Retracements indicator comes in. The Retracement indicator allows you to display specific levels on your chart that are derived from the Fibonacci sequence. This indicator, like most indicators, can be used in conjunction with other technical analysis tools, such as trend lines and moving averages, to help confirm trading signals.
The Fibo retracement indicator is a versatile tool that can be used by traders of all levels of experience as well. It can be very easy to use once you get the hang of it. Traders, investors and analysts of all stripes use the retracements because it allows them to specifically pinpoint areas that price may return to or bounce off of.
Retracements are extensively used in just about every major market including forex, stocks, bonds, commodities and cryptocurrencies. Fibo Retracement levels can also be used for short-term trading, day trading, swing trading or long-term trading strategies. By understanding how the indicator works and how to use it, traders can improve their chances of success in the financial markets.
How to Plot the Fibonacci Retracement Levels?
The Fibonacci Retracement tool, as the name implies, is used to identify retracement levels. A retracement is a temporary reversal in the direction of a price move. It is important to remember that Fibonacci Retracement levels are not exact. They are only potential support and resistance levels. It is also important to use other technical indicators to confirm whether a retracement is likely to occur.
The most frequent and most popular Fibonacci levels that are used on most technical indicators are at 0.00%, 23.6%, 38.2%, 50.0%, 61.8%, 76.4% and 100%.
To begin using Fibonacci Retracements, you will first have to add the indicator to your charting platform or trading software. Most modern trading platforms will have a built-in Fibonacci Retracement tool or indicator and trading education content that explains how to use it. The correct retracement tool also may be found under Fibonacci Strategies, depending on your platform or software.
In the chart above, we have started our retracement from the recent low and extended it to the recent high. This was an up-trending market, so the 1.00 or 100% level is on the bottom and the 0% level is at the top. In this time-frame, price has retraced to the 61.8% level and resumed an up-trend.
Find the Recent High and Recent Low
When you find the Fibonacci Retracement tool or indicator, you will have to find a swing high and a swing low to start your analysis. Choose the highest high and the lowest low over a certain time-frame you would like to trade. Potentially on a daily chart, you could choose prices from the past month, two months or more to analyze.
If you are analyzing a down-trending market, take your indicator and drag it from the most recent highest high to the most recent lowest low. After doing this, you should see the 1.000 (or 100%) retracement level at the top and the 0.00% retracement level at the bottom. In between, you will see the 23.6, 38.2, 50.0, 61.8 and the 76.4 fib levels as well.
If you are analyzing an up-trending market, you will see the exact opposite where 100% is at the bottom and 0.00% is at the top. This will make sense if you think about it. If price at bottom is 100% and the 0% is at top and then if price drops all the way back down from 0% to the 100% level, then price has “retraced” 100% of its previous uptrend move (and the opposite for downtrends).
Using Fibonacci Retracements for Trend Following or Trend Trading Strategies
Now that you have the Retracement Indicator on your chart, let’s start to understand how to use it. One of the best ways to utilize Fibonacci Retracements for trading, in my opinion, is to jump on an established trend. I think this is the easiest way to use Fibos and the Retracements are the perfect tool for this type of trend following execution. You can hopefully get in on a strong trend and profit without having to spot the trade before everyone else does. Let’s look at what trends are and why would we want to trade trends.
Beginners: What are Trends and Why Trade them?
When it comes to trading, there are different approaches that can be taken in order to make a profit. Some traders focus on technical analysis and try to identify patterns in order to predict future price movements. Others focus on fundamental analysis and look at factors such as economic indicators in order to make trading decisions. And then there are those who focus on trends. In my opinion, the best types of trades combine multiple types of analysis that put the odds in a trader’s favor.
Trend trading, also known as momentum trading or trend following, is a strategy that involves buying assets that are rising in price and selling them when they start to fall or when the trend is exhausted. The idea is to ride the wave of a trend and make profits along the way. Traders who follow this strategy are commonly referred to as “trend followers.” Once a trend has identified a trend, traders will need to decide when to buy and when to sell. This decision will be based on a number of factors, including the trader’s risk tolerance and their time horizon.
It’s important to note that trend trading is not without its risks and there are a few things that trend traders need to be aware of. The first is that trends don’t last forever. Trends can reverse and when this happens, traders can find themselves on the wrong side of the trade. There will be times when the price of an asset starts to fall after it has been rising for some time. It’s important to have a exit strategy in place so that you can sell before the trend reverses. Another thing to keep in mind is that not all trends are created equal. Some trends are stronger than others and last longer. These are the trends that you want to focus on.
A Fibonacci Forex Retracement Trading Example: The Trend Pullback
As a general rule, if the market is in an uptrend and you believe it will continue, then you will want to look for opportunities to buy on the price pullback at the 23.6% or the 38.2% retracement levels. Depending on what the trend looks like (early trend, late trend?) and if you have other fundamental information that makes you feel the trend will continue (how strong are the fundamental factors?), this could include the 50.0% and the 61.8% retracement levels as well.
An Example: See this classic setup in the USD/JPY currency pair on the daily chart.
When the US Dollar strength against the Japanese yen pushed a USDJPY breakout above 116.35 in March of 2022, the bull trend was on in a strong way. Fundamental forces for this market included rising inflation, stronger bond yields for the USA versus Japan and the fact that the US Federal Reserve was sharply raising its benchmark interest rate while the Bank of Japan was standing pat and still had accommodating economic policies while most other central banks were going the other way.
Depending on when you noticed this trend and the underlying fundamental picture, you could have tried to jump on this strong trading action a few different times. However, perhaps the best method would have been using the Fibonacci Retracement in mid-to-late May 2022 with a buy order around the 23.6% retracement level (already acting as support a few times by mid-May). A stop-loss order to be placed at the 38.2% retracement or just below that psychological support level of 125.00.
Daily Chart: USDJPY
This trend reversed a little below the 23.6% retracement level, bounced up and kept going higher as the interest rate differential and central bank policies continued to diverge in favor of the US. Ultimately, the trend rose to a 20-year high for the USDJPY currency pair. This was above and beyond our Fibonacci Retracement Indicator that we placed on the chart (above 0 and going). The currency pair remains in an uptrend as of August 2022.
A Stock Market Trading Example: Trend Reversal with RSI Divergence
This next trade setup is more near and dear to my heart because I love RSI Divergence! It is a setup that happens in all markets from time to time and is very easy to see if you are looking for it. I will say that it is a setup that is much rarer (for good reason) than others like say a moving average crossover or a MACD signal. I see the RSI Divergence as a trend exhaustion indicator that signals the “possibility” of an imminent trend change (look for confirming factors, either sentiment or fundamentals as well). I also like to use the RSI Divergence on the weekly charts as I find it the most reliable but it does happen on all time frames.
What is a divergence? A divergence is the difference in price between two similar acting assets or in this case, between an indicator and price that usually go in the same direction. It is important because it can be used to signal a change in market conditions.
One thing of note on the chart below is – I am using a RSI smoothed average (red line – 3 periods) of the regular RSI (which is the skinny light line). This is just my preference as I like it better than just the basic RSI.
For some context, this first half of the year in 2022 had been a tough one for stocks. The overall narrative is that stocks are going down and going to keep going down as far as the eye can see. Inflation! Bond yields to the moon! Crypto death! Technology stocks are dead! Worst Recession in History Coming! These are some of the headlines I feel were being screamed at market watchers since January. Some may eventually come true but many are probably over-hyped and sensationalized.
The SPY peaked in January 2022 around the 480.00 price level and started on a its downward path. US Treasury bonds were dropping as well with inflation rising and the Federal Reserve raising the benchmark interest rate to combat that inflation. The 10-Year bonds yields were popping (yields move in opposite of bond prices) and hit a multi-year high in June 2022 right near the 3.50% level. Then a funny thing happened, both the SPY and 10-Year yields trends stalled out over the next bunch of weeks (both markets exhibited RSI Divergences).
Here is recent setup that happened in the S&P 500 ETF (SPY)
Weekly Chart: SPY
Using the Retracement Indicator from the high point (January 2022 recent peak) to the June low point (where price hit and then bounced around above this for the next four weeks while the RSI turned higher). Here we are looking for the opposite of our prior Forex example and hope to use the 23.6% key level as a launching point. Instead of betting on a trend continuation, we are using the RSI Divergence to indicate a trend exhaustion with the hopes that the trend is reversing.
As you can see from the chart, so far so good. The exiting point for this trade is a personal choice, but with prices rising, there are multiple fibo lines that could be used as exits as well as the 50-week moving average residing up ahead. This current setup could possibly be just a blip on a larger downtrend to come but hopefully illustrates a tactic to trade a trend reversal with the help of the RSI.
Fibonacci Trading Conclusion:
I hope this article has helped to give some perspective and examples on using the Fibonacci Retracement Indicator in the markets. Hopefully it will further your education and give you another good trading tool in your arsenal. I have found in my own trading that the best way to use this Fibonacci tool is in conjunction with different trading strategies, technical indicators, fundamental indicators and sentiment indicators. I feel it is best to utilize all different types of analysis that will give me unique clues to what is or what could be happening in the market. Overall, the Retracement Indicator is a valuable tool for technical analysts and is so popular for a reason – once you get the hang of it, it can be an easy addition to your trading toolkit.
Just a few weeks ago, it was AMTD Digital Inc (HKD), which was IPO’d in July and has had a trading range of $13.52 per share up to $2,555.30 per share since the initial public offer. HKD is currently trading in the low $200 range.
But just because retail investors can do something, does that mean they should? Are the retail crowd good stock pickers? And should you follow their lead?
At this time, we don’t know the answer to these questions. That is because we don’t have enough data on whether or not retail investors operating as a whole are good stock pickers. They have only really been flexing their muscle for a little more than a year.
Plus, when they started with GME and AMC, we were still in a bull market. But now, we are in a bear market. So it would be unfair to say the retail investor’s recent performance shows their lack of sophistication and that they don’t belong picking stocks.
A few Exchange Traded Funds track what retail investors are talking about on social media or buying in their brokerage accounts, and as of late, retail investor stock picks are not outperforming the market.
The VanEck Social Sentiment ETF (BUZZ), which tracks the top 75 companies with the most popular sentiment online based on a proprietary AI model to select stocks, is down 32% year-to-date.
The SoFi Social 50 ETF (SFYF), which tracks the 50 most widely held stocks in self-directed brokerage accounts of Sofi Securities, is down 25.55% year-to-date.
And the FOMO ETF (FOMO), which invests in the areas of the market that are currently in favor with retail and individual investors or currently ‘trending,’ is down 17.94% year-to-date.
For comparison, a few ETFs that are either managed by professional stock pickers or track the performance of hedge funds are also having a tough year.
The Motley Fool 100 Index ETF (TMFC), which invests in the top 100 stocks selected by Motley Fool analysts, is down 17.64% year-to-date.
The performance of these professionally run ETFs shows that even the pros, who are getting paid millions to manage other people’s money, are, as a whole, performing just as poorly as the retail investors.
The S&P 500 is what many consider the ‘market,’ and the QQQ comprises the top 100 technology stocks on the NASDAQ.
However, the SPDR S&P 500 ETF (SPY) is down 12.09% year-to-date, while the Invesco QQQ ETF (QQQ) is down 18.59%. So these are great examples of alternative ETF investments investors could buy as opposed to BUZZ, SFYF, or FOMO.
Furthermore, based on the QQQ’s performance, there is an argument that it’s not that retail investors are poor at picking stocks but that technology stocks, which represent a large portion of the retail investor-focused ETFs, are having an overwhelmingly lousy year.
The performance of the S&P 500 in 2022 highlights the old argument that stock picking is not worth the time or energy professionals or retail investors dedicate to it.
But again, we are only eight months into the year, which is a tiny snapshot of time for long-term investors. And much of which has been during a bear market.
Historical data (Warren Buffett, Peter Lynch, Carl Icahn, Bill Miller) has shown that some investors can beat the market, and maybe the next great generational investor will come from the retail side, not Wall Street.
Regardless, investors interested in what other retail investors are buying and discussing on message boards may find BUZZ, SFYF, or FOMO attractive since they take the work out of tracking what other investors like and dislike.
My only suggestion would be to make one of these ETFs a small percentage of your total portfolio. The bulk of your portfolio should be in one of the S&P 500, NASDAQ, or other major index-focused ETFs.
Disclosure: This contributor did not hold a position in any investment mentioned above at the time this blog post was published. This article is the opinion of the contributor themselves. The above is a matter of opinion provided for general information purposes only and is not intended as investment advice. This contributor is not receiving compensation (other than from INO.com) for their opinion.
Sterling hijacked our attention on Wednesday after official data revealed that UK inflation hit double digits for the first time in 40 years!
Consumer prices rose 10.1% in July from a year ago after a 9.4% gain in June. This was the highest reading since February 1982 as prices rose for food, housing & utilities and alcoholic beverages among other products/services. Although this red-hot CPI report will reinforce expectations over the BoE aggressively raising interest rates, it will also create more uncertainty over the UK’s economic outlook.
We saw the Pound appreciate against most G10 currencies following the report as BoE rate hike bets jumped.
GBPUSD remains in wide range
The GBPUSD remains in a wide range despite the red-hot inflation figures. Support can be found at 1.2000 and resistance around 1.2155. A solid break under 1.2000 may open the doors towards 1.1900 and lower. Alternatively, a strong breakout above 1.2155 could spark a move towards 1.2250 and 1.2350.
GBPJPY set to push higher?
It has been a roller coaster ride on the GBPJPY. Prices have been volatile, choppy and all over the place. Prices are back above the 100-day Simple Moving Average and slowing approaching 164.00. A strong move above 164.00 signal an incline towards 166.00. If bears are able to pull the GBPJPY back below 162.00, the next level of interest cant be found at 160.00.
EURGBP in downtrend
The EURGBP remains in a bearish trend as there have been consistently lower lows and lower highs. Prices are trading below the 50,100 and 200-day Simple Moving Average while the MACD trades below zero. Sustained weakness below 0.8440 could encourage a selloff towards 0.8340. A breakout above 0.8440 is likely to encourage bulls to target 0.8500.
GBPAUD heading into resistance?
Pound bulls seem to be gaining momentum on the GBPAUD with prices pushing towards the 50-day Simple Moving Average. There could be some resistance here as the 100-day SMA resides just above. If these two obstacles can be cleared, prices may test the 1.7650 level and 1.7800, respectively. Should bulls tire and prices sink back below 1.7300, the next key point can be found at 1.7000.


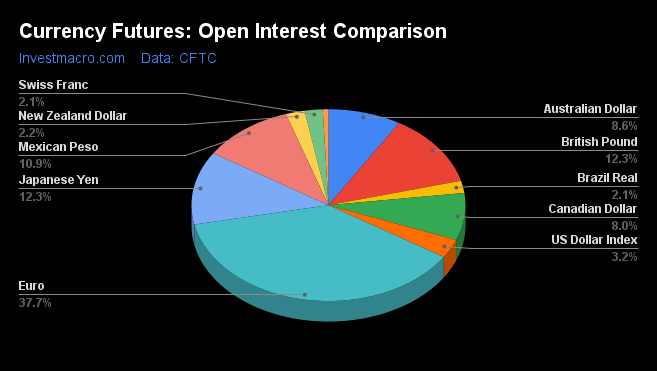
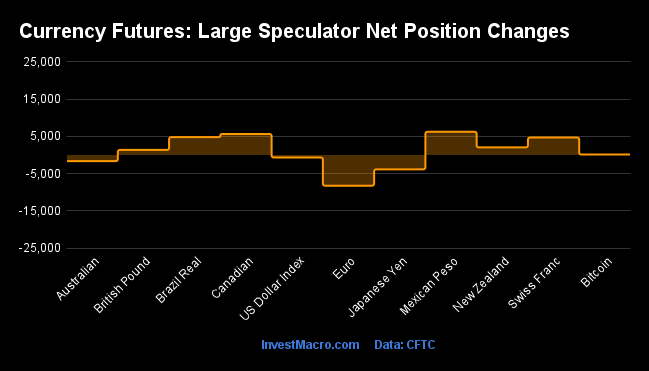
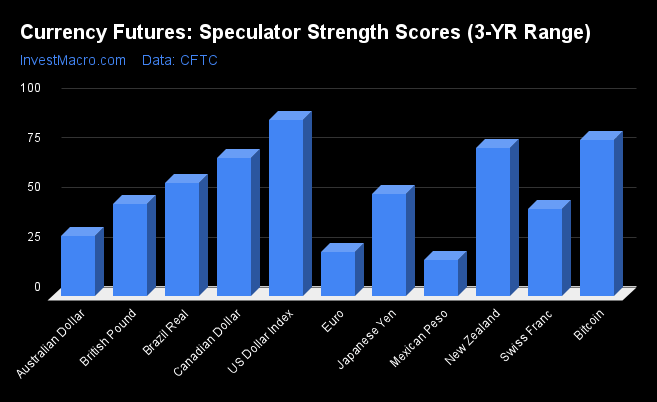
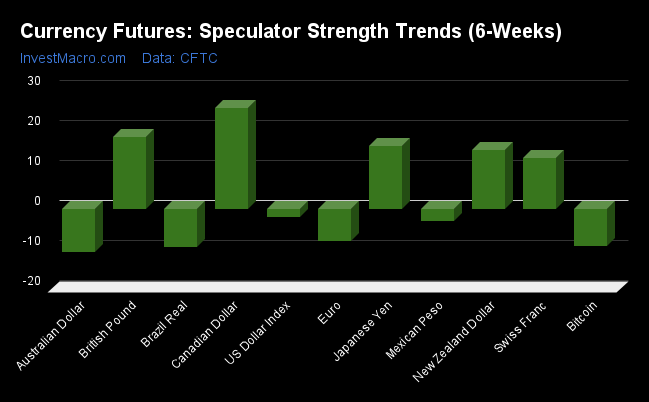
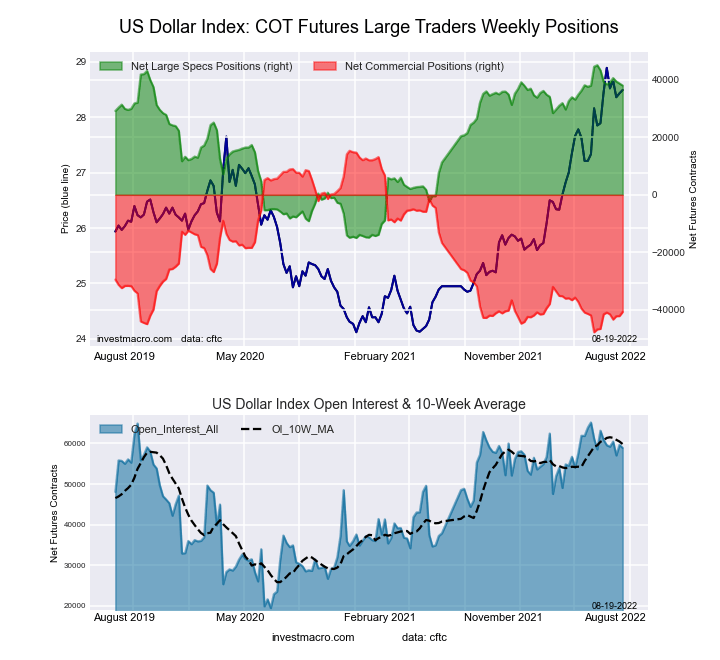
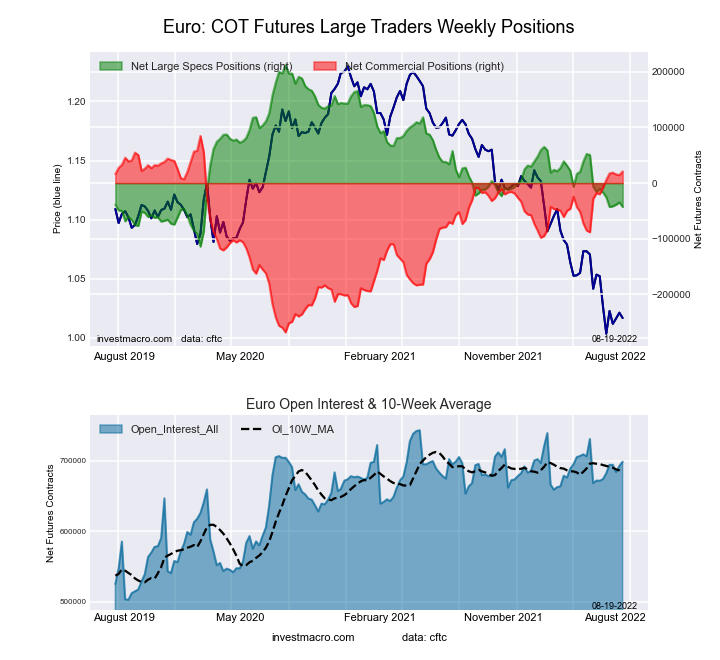
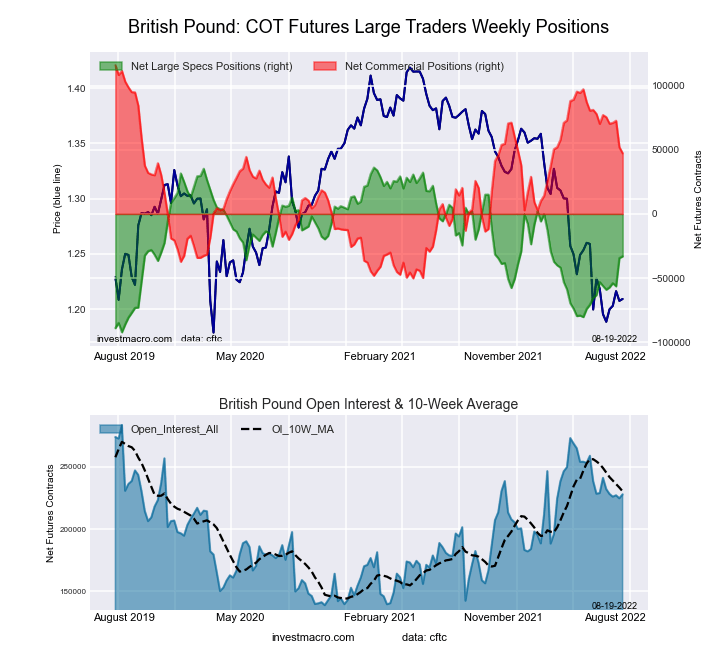
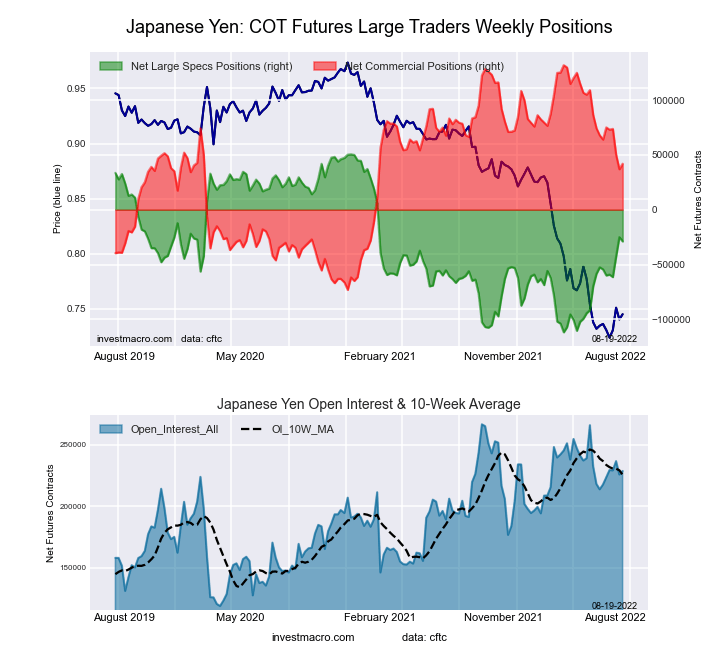
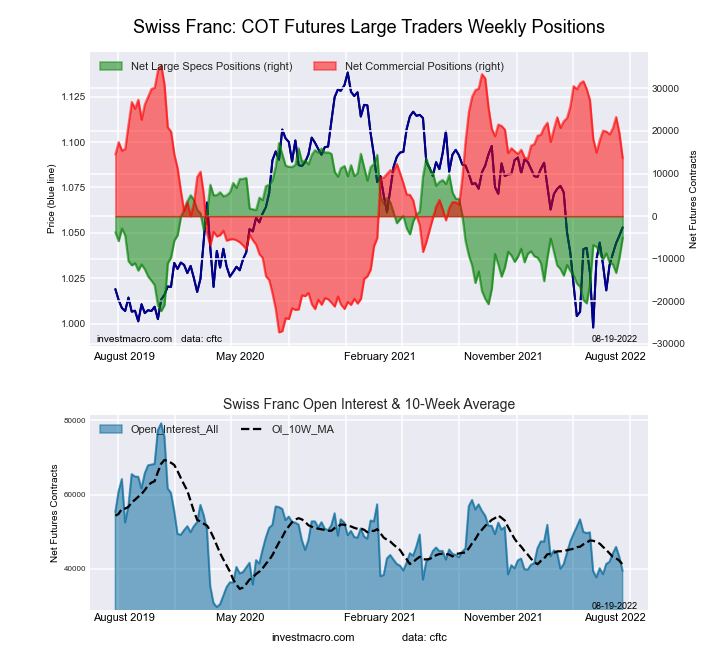
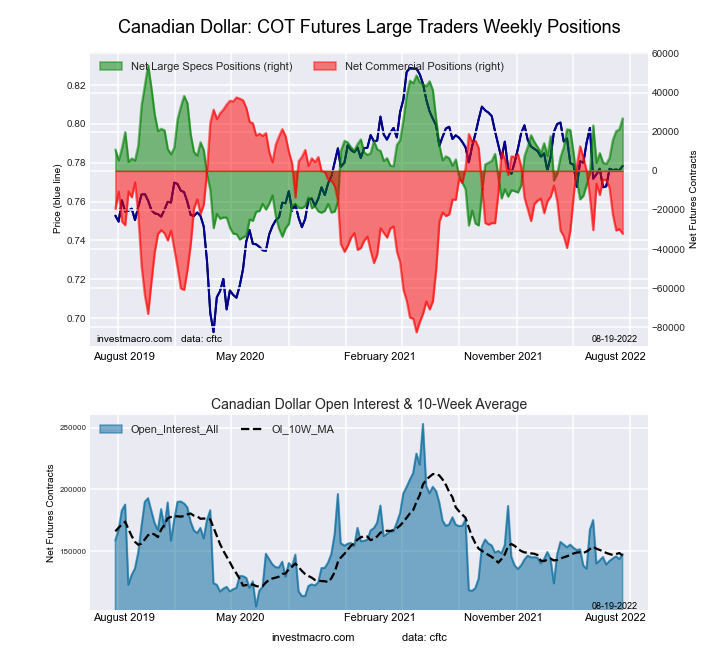
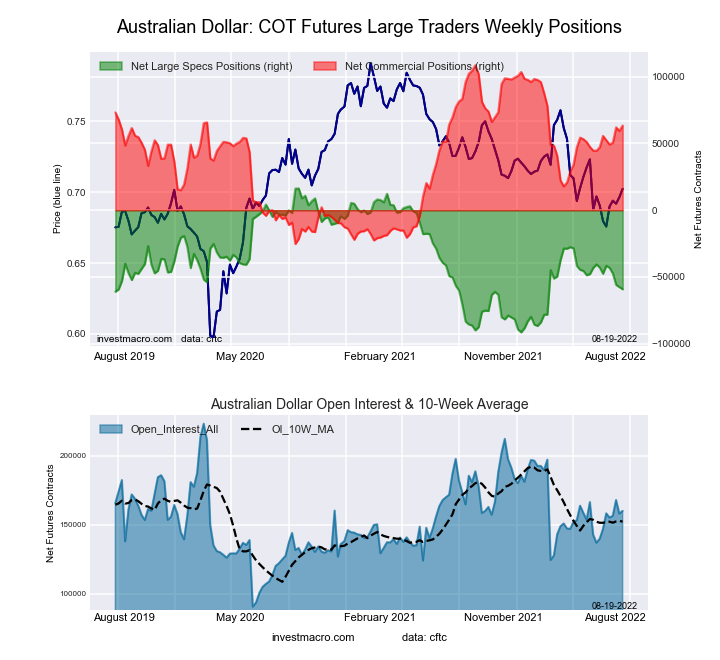
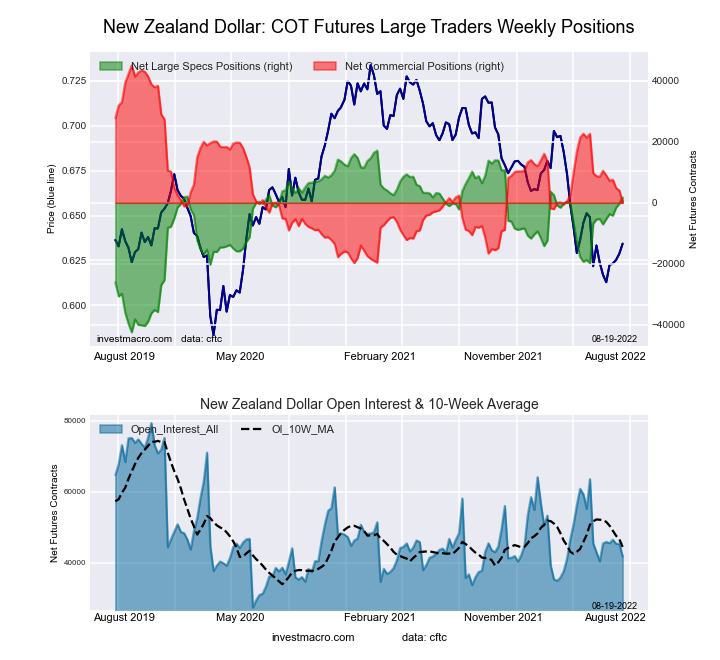
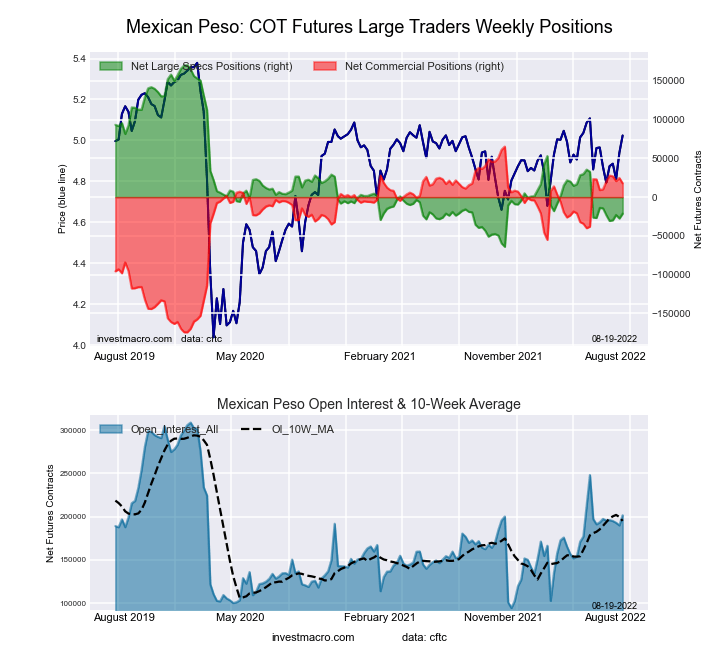
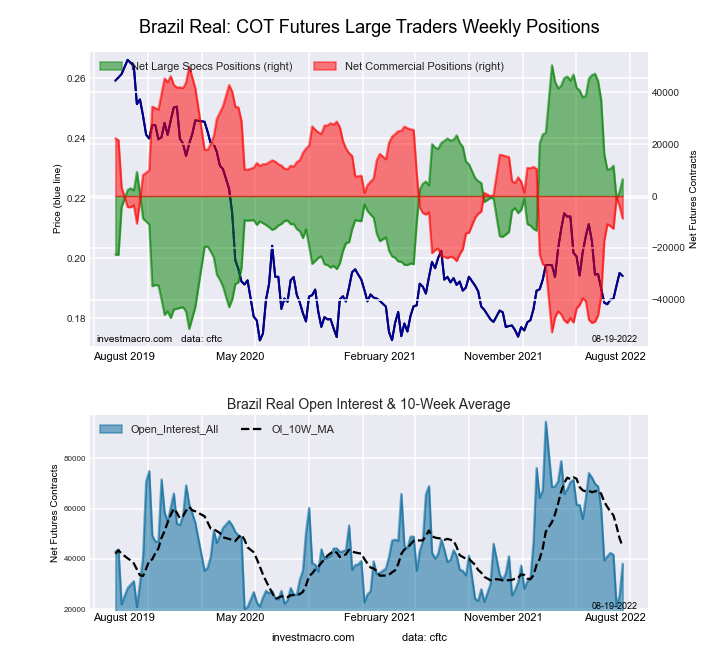
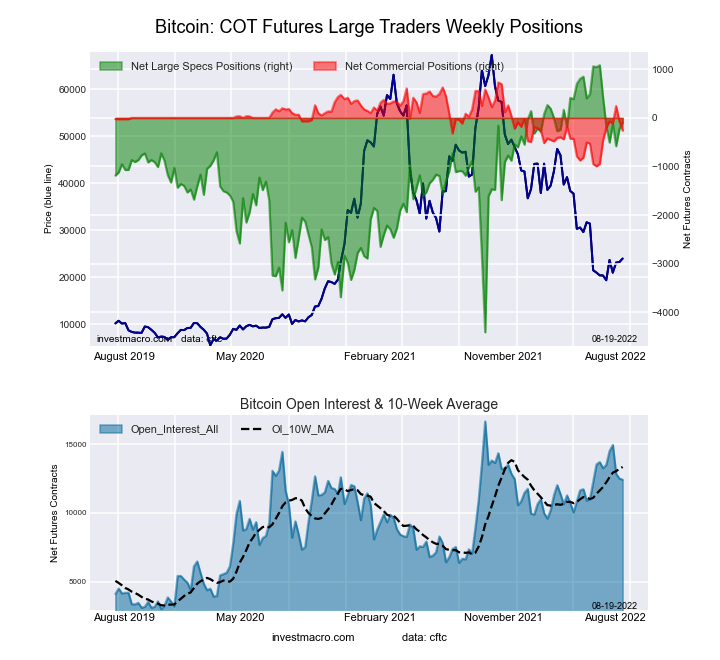

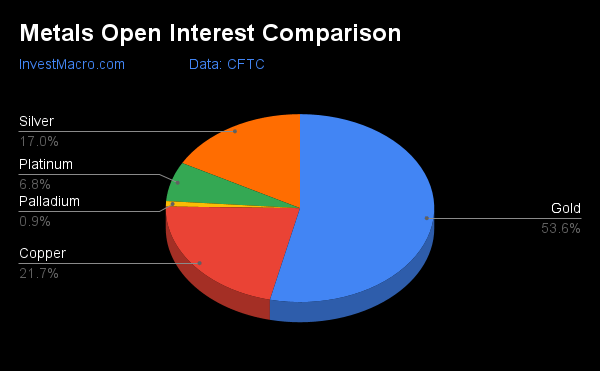
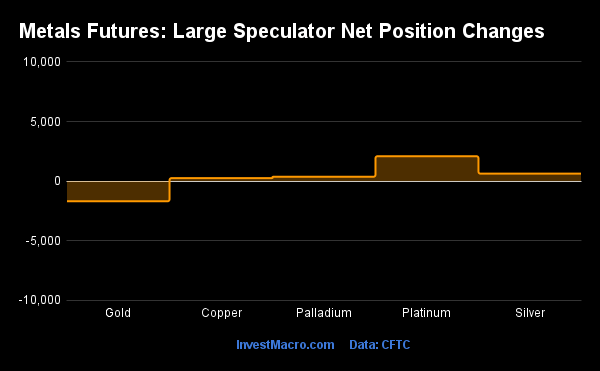
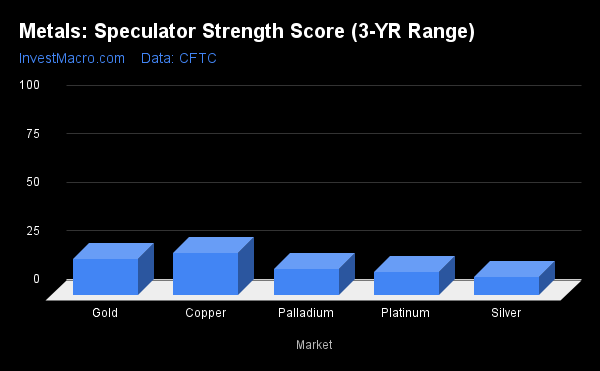
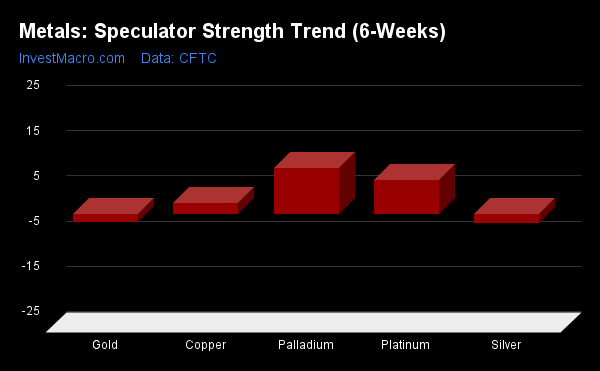
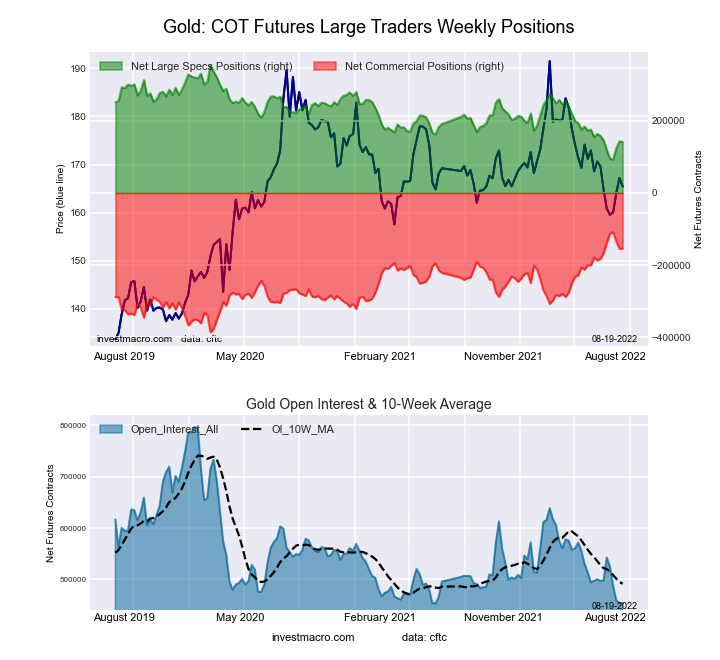
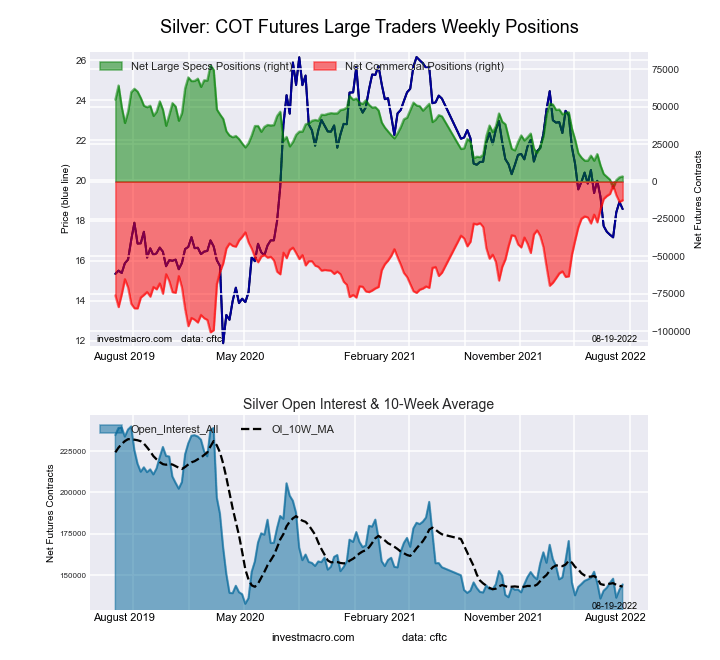
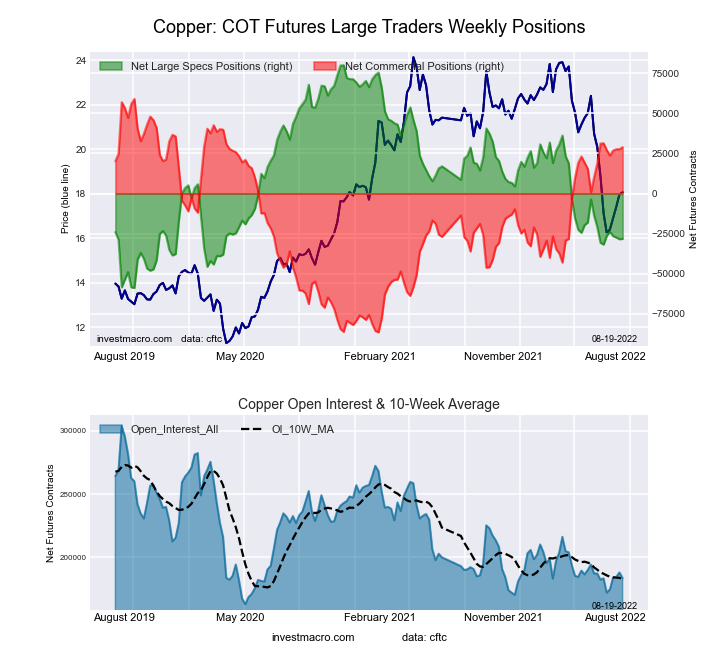
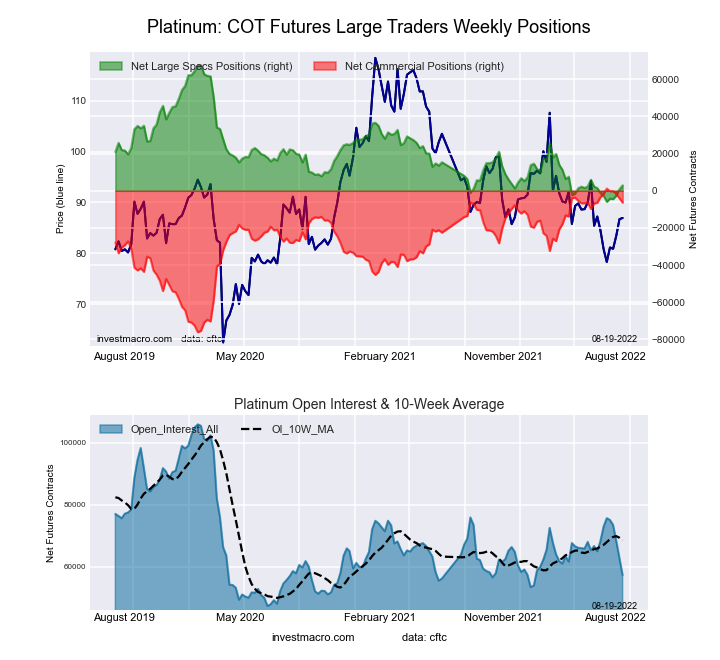
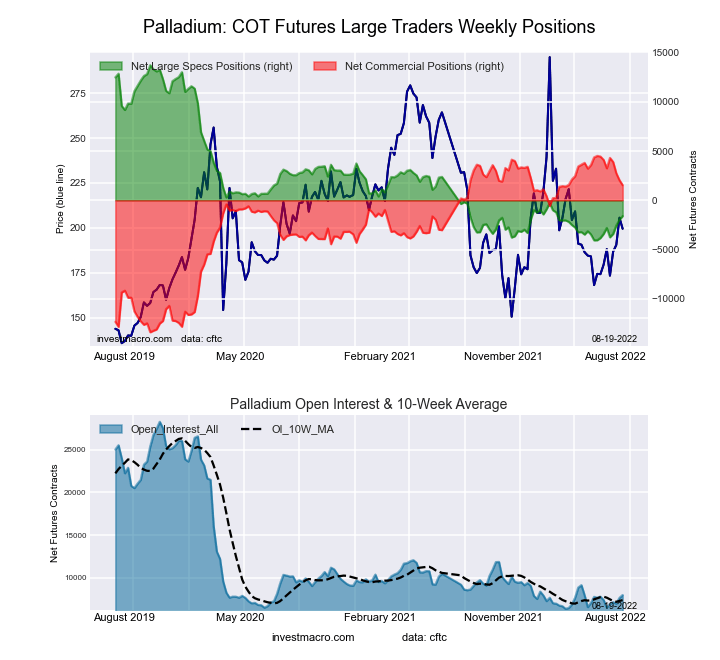


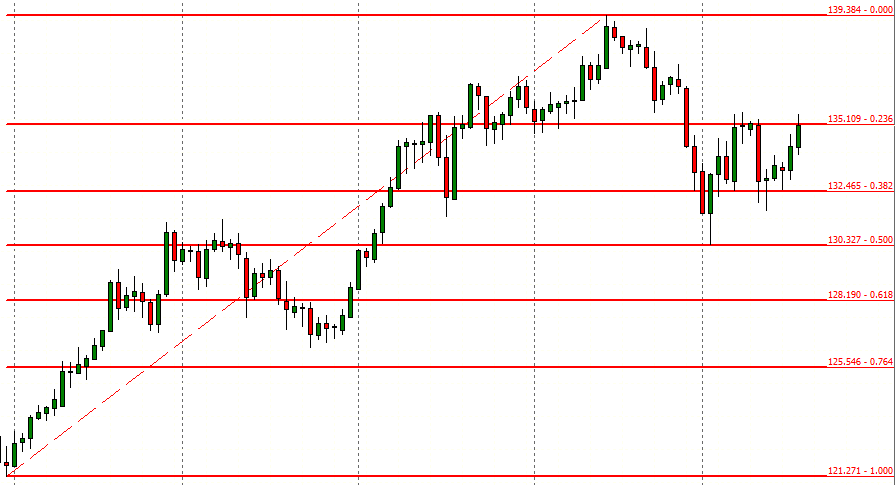
 The Fibonacci sequence is not just a mathematical curiosity. It has applications in engineering, computer science, biology and can be used to model or predict population growth. The Fibonacci sequence is used to generate efficient algorithms and, for our focus today, can be used to help with trading in the
  The most common use for Fibonacci numbers that I see is to use them for
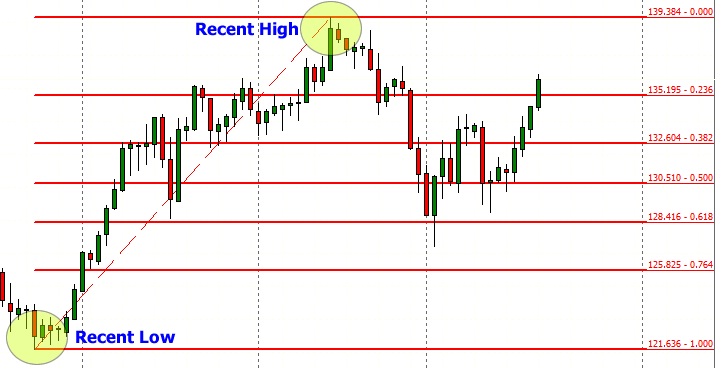
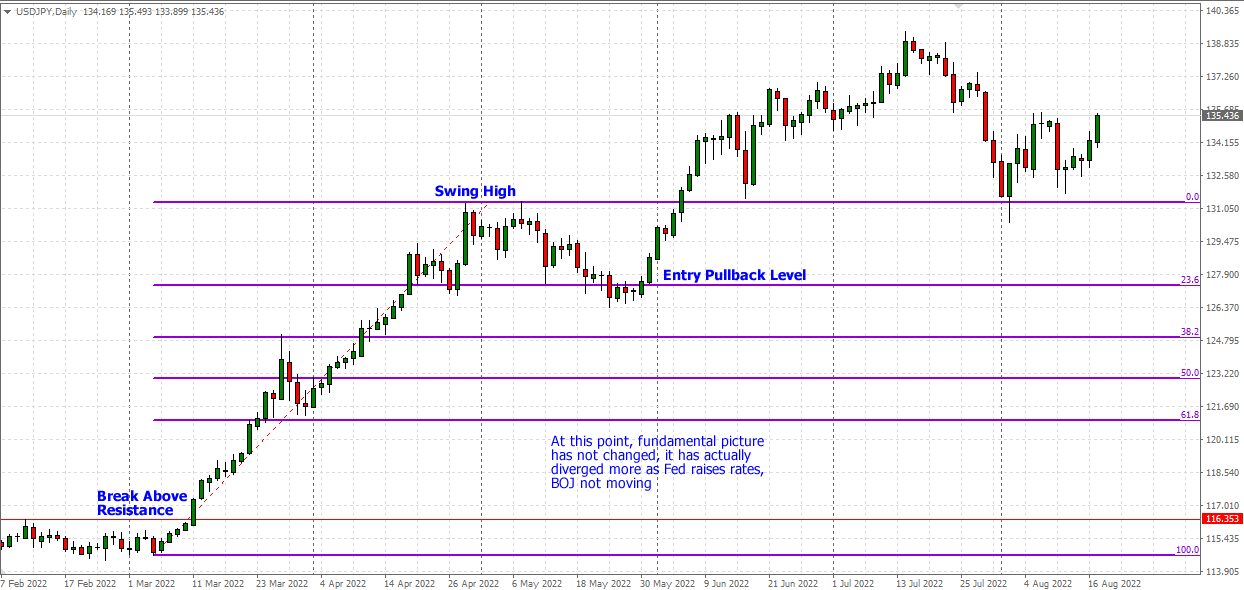
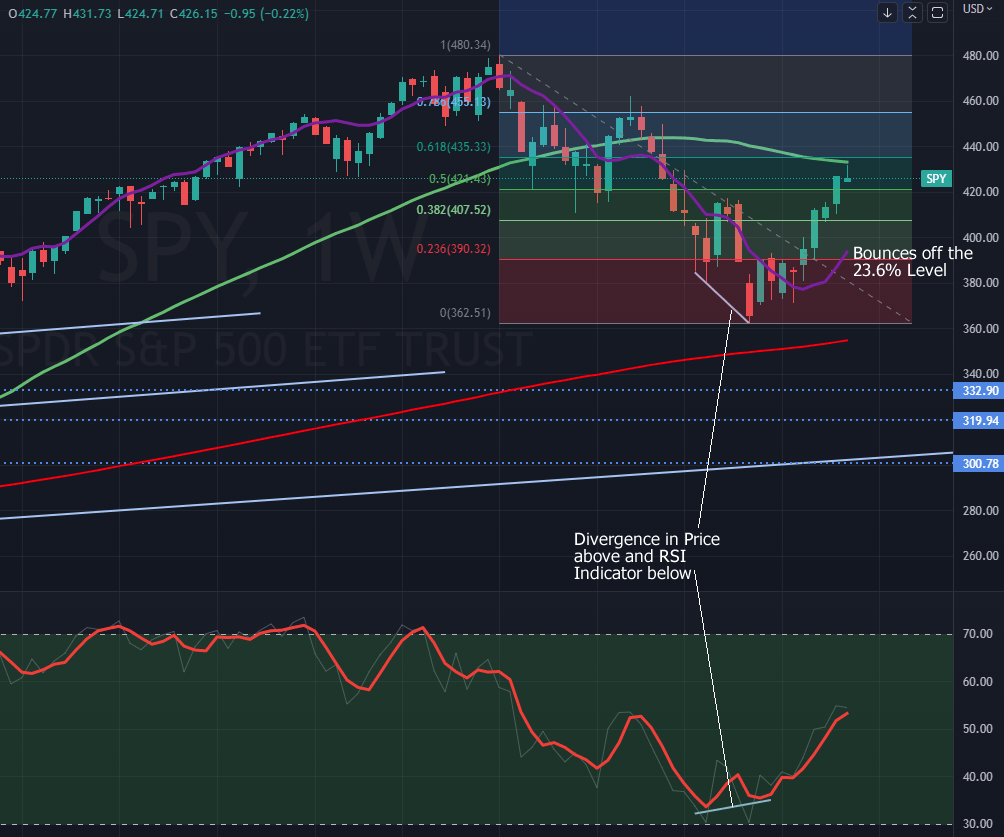


