Archive for Metals – Page 4

Gold Climbs to Two-Week High

By RoboForex Analytical Department

On Monday, gold advanced by more than 1% to 4,050 USD per ounce, reaching a fresh two-week high. The rally was fuelled by mounting concerns over the health of the US economy.

A softening US dollar provided further support for the precious metal, enhancing the affordability of dollar-denominated assets for international buyers.

Data released on Friday revealed that the University of Michigan’s consumer sentiment index had fallen to its lowest level in nearly three and a half years. This decline is largely attributed to the ongoing US government shutdown, which has now become the longest in the nation’s history. Investors are closely monitoring the situation as the US Senate moves closer to approving a Democratic-backed proposal to reopen the government.

Amid the economic uncertainty, market expectations for the Federal Reserve’s next move remain divided. The probability of a 25 basis point rate cut in December is currently priced at approximately 67%, unchanged from the end of last week.

Technical Analysis: XAU/USD

H4 Chart:

On the H4 chart, XAU/USD is forming a consolidation range around 3,988 USD. A breakout to the upside is expected to initiate a growth wave towards 4,075 USD, which may then be followed by a decline to 4,020 USD (testing the level from below). A subsequent breakdown from this range could extend the correction towards 3,660 USD, where the downward move is anticipated to conclude. This would potentially set the stage for a new upward wave targeting 4,400 USD. The MACD indicator supports this outlook, with its signal line above zero and pointing upward, suggesting continued near-term bullish momentum.

H1 Chart:

On the H1 chart, the market is also consolidating around 3,988 USD. An upward breakout is likely to propel prices towards 4,075 USD, after which a decline to at least 4,020 USD is expected. The Stochastic oscillator aligns with this view, as its signal line is positioned above 80 and appears poised to reverse downward towards 20, indicating potential for a near-term pullback.

Conclusion

Gold is trading at a two-week high, supported by economic concerns and a weaker US dollar. While the near-term technical structure suggests potential for further gains towards 4,075 USD, a subsequent correction towards 4,020 USD is anticipated. The broader outlook remains constructive, with a deeper corrective move towards 3,660 USD expected to present a buying opportunity ahead of a potential resumption of the broader uptrend.


Disclaimer:

Any forecasts contained herein are based on the author’s particular opinion. This analysis may not be treated as trading advice. RoboForex bears no responsibility for trading results based on trading recommendations and reviews contained herein.

Analysts Boost Price Forecasts on 4 Metals

Source: Red Cloud Securities (11/4/25)

Red Cloud Securities has a bullish outlook on gold, silver, copper and zinc now and through at least 2027, analysts noted in a thematic report.

Red Cloud Securities raised its gold, silver, copper, and zinc forecasts for Q4/25, 2026, and 2027, its mining analysts reported in their Q4/25 Commodity Price Update dated Oct. 10.

“A remarkable precious metals run shows no signs of abating,” the analysts wrote. “We are bullish on copper long term and have a solid outlook on zinc.”

The analysts explained the rationale for their higher estimates in each metal.

‘Gold Cold War’

The gold price has been breaking record after record in its current multiyear rally. This year alone, it is up 61%. Capital continues to flood into the yellow metal from central banks and investors.

“Central banks remain voracious buyers, led by China’s aggressive accumulation of reserves and its new effort to position the Shanghai Gold Exchange as a global custodian for sovereign bullion,” the analysts wrote.

As for investors, they have flocked to gold, given its safe-haven status, in the face of mounting global economic and geopolitical uncertainty.

Meanwhile, we are in a global dedollarization cycle without an end in sight, fueled by trade tensions, uncertainty about the long-term dominance of the U.S. dollar, and outflows of capital from the U.S.

“In our view, this is no longer just a bull market,” the analysts wrote. “It’s the opening phase of a global ‘Gold Cold War,’ where nations compete for monetary security, investors seek protection from policy volatility, and the metal’s long-term trajectory looks decisively higher.”

Also, the analysts expect future rate cuts by the U.S. Federal Reserve, rising inflation, and, ultimately, a weaker U.S. dollar. Anticipating these factors will “remain in place,” they raised their gold price for Q4/24, 2026, and 2027 and beyond by about $100/oz.

Silver Outperforms Gold

Silver is up 84% year to date, and since May, it has outperformed gold. This is evidenced by the gold:silver ratio dropping to about 80:1 from roughly 100:1 during that time period.

“We are increasingly bullish on silver,” wrote the analysts. “We expect the silver price to continue to keep pace with gold.”

Looming Copper Deficit

The London Metal Exchange (LME) copper price rose about 22% this year to around $4.80 per pound ($4.80/lb). Accidents and disruptions at major mines in Chile, Indonesia, and the Democratic Republic of the Congo caused the recent run in copper prices.

Looking ahead, the analysts forecast a 6% decrease in U.S. copper demand next year, driven by U.S. trade wars and plummeting consumer demand.

“We see near-term price support and a rapid shift back to a deficit in 2027 as the global grid build-out continues to cope with the rise of artificial intelligence,” the analysts wrote.

Zinc Supply to Increase

Red Cloud analysts’ long-term zinc price is $1.30/lb, about where the London Metal Exchange zinc price is now.

Near-term availability of the metal is tight. However, mine supply of zinc is expected to grow over the next two years and peak in 2027, thanks to new projects coming online.

Lithium in Oversupply

During the summer, lithium carbonate and spodumene prices dropped to multiyear lows of about US$8,000 per ton ($8,000/t) and US$600/t, respectively. In August, they began moving up after supply disruptions at some Chinese mining operations. Since lithium carbonate has traded between US$9,000 and US$10,000/t.

“On continued oversupply concerns and weak demand in the short term, we are reducing our forecast for 2026 but leaving 2027 and beyond prices unchanged,” wrote the analysts. “We are also increasing our spodumene concentrate prices slightly.”

They pointed out that the premium lithium hydroxide had over lithium carbonate has had historically no longer exists.

“Constantly evolving battery technologies have prompted Chinese lithium producers to build flexibility into their production lines, allowing shifts in production between hydroxide and carbonate based on battery demand,” the analysts explained.

Here is a chart of Red Cloud’s updated metals forecasts:

Favorite Names Now

In their report, the Red Cloud analysts pointed out their Top Picks. They are:

  • Blackrock Silver Corp. (BRC:TSX.V; BKRRF:OTCQX)
  • Kootenay Silver Inc. (KTN:TSX.V)
  • Koryx Copper Inc. (KRY:TSX.V; KRYXF:OTCMKTS)
  • Northisle Copper and Gold Inc. (NCX:TSX; NTCPF:OTCPK)
  • Outcrop Silver & Gold Corp. (OCG:TSX.V; OCGSF:OTCQX; MRG1:DE)
  • Strickland Metals Ltd. (STK:ASX)
  • Troilus Gold Corp. (TLG:TSX; CHXMF:OTC; CM5R:FRA)


Important Disclosures:

  1. As of the date of this article, officers, contractors, shareholders, and/or employees of Streetwise Reports LLC (including members of their household) own securities of Outcrop Silver & Gold Corp.
  2. Doresa Banning wrote this article for Streetwise Reports LLC and provides services to Streetwise Reports as an independent contractor.
  3.  This article does not constitute investment advice and is not a solicitation for any investment. Streetwise Reports does not render general or specific investment advice and the information on Streetwise Reports should not be considered a recommendation to buy or sell any security. Each reader is encouraged to consult with his or her personal financial adviser and perform their own comprehensive investment research. By opening this page, each reader accepts and agrees to Streetwise Reports’ terms of use and full legal disclaimer. Streetwise Reports does not endorse or recommend the business, products, services or securities of any company.

For additional disclosures, please click here.

Disclosures for Red Cloud Securities, October 20, 2025

Disclosure Statement Updated October 20, 2025 Disclosure Requirement Red Cloud Securities Inc. is registered as an Investment Dealer and is a member of the Canadian Investment Regulatory Organization (CIRO). Red Cloud Securities registration as an Investment Dealer is specific to the provinces of Alberta, British Columbia, Manitoba, Ontario, Quebec, and Saskatchewan. We are registered and authorized to conduct business solely within these jurisdictions. We do not operate in or hold registration in any other regions, territories, or countries outside of these provinces. Red Cloud Securities bears no liability for any consequences arising from the use or misuse of our services, products, or information outside the registered jurisdictions. Part of Red Cloud Securities Inc.’s business is to connect mining companies with suitable investors. Red Cloud Securities Inc., its affiliates and their respective officers, directors, representatives, researchers and members of their families may hold positions in the companies mentioned in this document and may buy and/or sell their securities. Additionally, Red Cloud Securities Inc. may have provided in the past, and may provide in the future, certain advisory or corporate finance services and receive financial and other incentives from issuers as consideration for the provision of such services. Red Cloud Securities Inc. has prepared this document for general information purposes only. This document should not be considered a solicitation to purchase or sell securities or a recommendation to buy or sell securities. The information provided has been derived from sources believed to be accurate but cannot be guaranteed. This document does not take into account the particular investment objectives, financial situations, or needs of individual recipients and other issues (e.g. prohibitions to investments due to law, jurisdiction issues, etc.) which may exist for certain persons. Recipients should rely on their own investigations and take their own professional advice before investment. Red Cloud Securities Inc. will not treat recipients of this document as clients by virtue of having viewed this document. Red Cloud Securities Inc. takes no responsibility for any errors or omissions contained herein, and accepts no legal responsibility for any errors or omissions contained herein, and accepts no legal responsibility from any losses resulting from investment decisions based on the content of this report. Company Specific Disclosure Details

Company Name Ticker Disclosures Company Name Ticker Disclosures Aftermath Silver Ltd. TSXV:AAG Kesselrun Resources Ltd. TSXV:KES Aldebaran Resources Inc. TSXV:ALDE 1,2 Kootenay Silver Inc. TSXV:KTN 1,2,3 Alkane Resources Ltd TSX:ALK Koryx Copper Inc. TSXV:KRY 3 Apollo Silver Corp. TSXV:APGO 3 Loncor Gold Inc. TSX:LN 3 Argentina Lithium & Energy Corp. TSXV:LIT 3 Lumina Gold Corp. TSXV:LUM Aris Mining Corporation TSX:ARIS 1,2 Major Drilling Group International Inc. TSX:MDI Aurion Resources Ltd. TSXV:AU 3 NeXGold Mining Corp. TSXV:NEXG 3 Aztec Minerals Corp. TSXV:AZT 3 NorthIsle Copper and Gold Inc. TSXV:NCX 1,2,3 Blackrock Silver Corp. TSXV:BRC 1,2,3 Orosur Mining Inc. TSXV:OMI 3 Borealis Mining Company Limited TSXV:BOGO 3 Outcrop Silver & Gold Corporation TSXV:OCG 3 Brunswick Exploration Inc. TSXV:BRW 3 Seabridge Gold Inc. TSX:SEA 1,2,3 Cassiar Gold Corp. TSXV:GLDC 3 Silver Storm Mining Ltd. TSXV:SVRS 3 Cerrado Gold Inc. TSXV:CERT 7 Silver Viper Minerals Corp. TSXV:VIPR 3,6 Critical Elements Lithium Corporation TSXV:CRE Silver X Mining Corp. TSXV:AGX 3 Defiance Silver Corp. TSXV:DEF 3,8 SolGold Plc LSE:SOLG Denarius Metals Corp. NEOE:DMET 3 Southern Cross Gold Consolidated Ltd. TSX:SXGC 3 Empress Royalty Corp. TSXV:EMPR Southern Silver Exploration Corp. TSXV:SSV 1,2,3 Excellon Resources Inc. TSXV:EXN 3 Spanish Mountain Gold Ltd. TSXV:SPA 3 Falco Resources Ltd. TSXV:FPC Strickland Metals Limited ASX:STK 1,2 Galleon Gold Corp. TSXV:GGO Torex Gold Resources Inc. TSX:TXG 1,2 GR Silver Mining Ltd. TSXV:GRSL 1,2,3 Troilus Gold Corp. TSX:TLG 3 Grid Metals Corp. TSXV:GRDM 1,2 West Red Lake Gold Mines Ltd. TSXV:WRLG 1,2 Jaguar Mining Inc. TSX:JAG 3 Westhaven Gold Corp. TSXV:WHN 1,2,3 Japan Gold Corp. TSXV:JG 3

1. The analyst has visited the head/principal office of the issuer or has viewed its material operations. 2. The issuer paid for or reimbursed the analyst for a portion, or all of the travel expense associated with a visit. 3. In the last 12 months preceding the date of issuance of the research report or recommendation, Red Cloud Securities Inc. has performed investment banking services for the issuer. 4. In the last 12 months, a partner, director or officer of Red Cloud Securities Inc., or an analyst involved in the preparation of the research report has provided services other than in the normal course investment advisory or trade execution services to the issuer for remuneration. 5. An analyst who prepared or participated in the preparation of this research report has an ownership position (long or short) in, or discretion or control over an account holding, the issuer’s securities, directly or indirectly. 6. Red Cloud Securities Inc. and its affiliates collectively beneficially own 1% or more of a class of the issuer’s equity securities. 7. Robert Sellars, who is a partner, director, officer, employee or agent of Red Cloud Securities Inc., serves as a partner, director, officer or employee of (or in an equivalent advisory capacity to) the issuer. 8. Red Cloud Securities Inc. is a market maker in the equity of the issuer. 9. There are material conflicts of interest with Red Cloud Securities Inc. or the analyst who prepared or participated in the preparation of the research report, and the issuer. Analysts are compensated through a combined base salary and bonus payout system. The bonus payout is determined by revenues generated from various departments including Investment Banking, based on a system that includes the following criteria: reports generated, timeliness, performance of recommendations, knowledge of industry, quality of research and client feedback. Analysts are not directly compensated for specific Investment Banking transactions.

Recommendation Terminology Red Cloud Securities Inc. recommendation terminology is as follows: • BUY – expected to outperform its peer group • HOLD – expected to perform with its peer group • SELL – expected to underperform its peer group • Tender – clients are advised to tender their shares to a takeover bid • Not Rated or NA – currently restricted from publishing, or we do not yet have a rating • Under Review – our rating and target are under review pending, prior estimates and rating should be disregarded. Companies with BUY, HOLD or SELL recommendations may not have target prices associated with a recommendation. Recommendations without a target price are more speculative in nature and may be followed by “(S)” or “(Speculative)” to reflect the higher degree of risk associated with the company. Additionally, our target prices are set based on a 12-month investment horizon. Dissemination Red Cloud Securities Inc. distributes its research products simultaneously, via email, to its authorized client base. All research is then available on www.redcloudsecurities.com via login and password. Analyst Certification Any Red Cloud Securities Inc. research analyst named on this report hereby certifies that the recommendations and/or opinions expressed herein accurately reflect such research analyst’s personal views about the companies and securities that are the subject of this report. In addition, no part of any research analyst’s compensation is, or will be, directly or indirectly, related to the specific recommendations or views expressed by such research analyst in this report.

Gold Holds at October Lows Amid Shifting Rate Expectations

By RoboForex Analytical Department

On Wednesday, gold traded around 3,940 USD per troy ounce, stabilising near its lowest levels since early October. The precious metal remains under pressure from a recalibration of interest rate expectations, as markets adopt a more cautious outlook on further easing by the Federal Reserve.

Several Fed officials have recently struck a neutral tone, aligning with Chair Jerome Powell’s hawkish rhetoric last week, which suggested the October rate cut could be the final one for the year. Market-implied probabilities for a December rate cut have subsequently fallen to 69%, down sharply from 90% before the latest FOMC meeting.

With the release of official US data hampered by the ongoing government shutdown, investor attention is turning to private-sector labour market reports for guidance. Further headwinds for gold stem from easing trade tensions and China’s decision to revoke tax incentives for certain jewellery retailers. This move could dampen physical demand in the world’s largest gold market.

Nevertheless, a broader shift towards risk-off sentiment across global markets may renew the metal’s appeal as a traditional safe-haven asset.

Technical Analysis: XAU/USD

H4 Chart:

On the H4 chart, XAU/USD is forming a consolidation range around 3,970 USD. A breakdown from this range is expected to trigger a decline toward 3,880 USD, potentially followed by a corrective rebound to 4,020 USD (testing the broken level from below). The subsequent resumption of selling pressure could drive the pair towards 3,660 USD, where the current correction may conclude, setting the stage for a new upward wave towards 4,400 USD. The MACD indicator supports this bearish near-term view, with its signal line below zero and pointing downward, confirming ongoing corrective momentum.

H1 Chart:

On the H1 chart, the market is consolidating around 3,971 USD. A break below this level could trigger a further decline towards 3,790 USD. The Stochastic oscillator aligns with this outlook, as its signal line hovers above 80 and appears poised to reverse downward toward 20, indicating building selling pressure.

Conclusion

Gold remains under pressure as expectations for a Fed cut are scaled back and concerns about physical demand emerge. While risk-off sentiment may provide intermittent support, the near-term technical structure favours further declines. A sustained break below 3,970 USD could accelerate the move towards 3,790–3,880 USD, although a deeper correction to 3,660 USD may ultimately offer a more compelling buying opportunity ahead of the next major rally.

Disclaimer:

Any forecasts contained herein are based on the author’s particular opinion. This analysis may not be treated as trading advice. RoboForex bears no responsibility for trading results based on trading recommendations and reviews contained herein.


Gold Rebounds to 4,000 USD Mark

By RoboForex Analytical Department

Gold prices returned to the 4,000 USD per troy ounce mark on Tuesday, partially recovering from the previous day’s 3.2% decline. The initial sell-off was triggered by encouraging developments in US-China trade negotiations.

According to officials, the two sides reached a framework agreement on tariffs and several key issues during talks in Malaysia. This paves the way for a final approval by the US and Chinese leaders at their upcoming meeting in South Korea later this week.

The metal found renewed support as investor attention shifted to the impending US Federal Reserve meeting. Markets are now pricing in a 25 basis point rate cut following the release of softer-than-anticipated inflation data, making this one of the most significant events in a week packed with risk.

Technical Analysis: XAU/USD

H4 Chart:

On the H4 chart, XAU/USD formed a consolidation range around 4,085 USD before breaking decisively to the downside. The market appears to be developing the second leg of this downward wave, with a subsequent target projected at 3,785 USD. This bearish near-term outlook is supported by the MACD indicator. Its signal line is pointing downward, and the histogram has moved into negative territory, suggesting the corrective phase is not yet complete.

H1 Chart:

On the H1 chart, the pair is developing a downward structure toward 3,785 USD. A consolidation range has formed around 3,971 USD; a break below this level would signal a continuation of the decline toward the stated target. The Stochastic oscillator confirms this momentum, with its signal line positioned below 50 and trending downward toward 20, reflecting strengthening selling pressure.

Conclusion

While gold has rebounded on shifting expectations for Fed policy, the technical structure points to further potential downside. The primary focus for traders will be the Fed’s decision, which will determine whether this current correction extends toward 3,785 USD or if the longer-term bullish trend can reassert itself.


Disclaimer:

Any forecasts contained herein are based on the author’s particular opinion. This analysis may not be treated as trading advice. RoboForex bears no responsibility for trading results based on trading recommendations and reviews contained herein.

Gold Undergoes Correction Amid Divergent Forces

By RoboForex Analytical Department

Gold prices face continued pressure from a resilient US dollar and expectations that the Federal Reserve will maintain its restrictive monetary policy stance. These headwinds have triggered a technical correction in the precious metal.

However, ongoing geopolitical tensions and instability in the Middle East continue to underpin demand for safe-haven assets, providing a buffer against more substantial price declines.

In the coming sessions, investor attention will focus on key inflation data and scheduled speeches from Fed officials, which are likely to provide fresh direction for the precious metal.

Technical Analysis: XAU/USD

H4 Chart:

On the H4 chart, XAU/USD broke below the 4,175 USD support level, reaching the initial corrective target at 4,004 USD. The market is currently forming a retracement towards 4,175 USD, testing this former support level from below. Following the completion of this pullback, another leg down is anticipated within the broader correction, with a subsequent target at 3,970 USD. The MACD indicator confirms this bearish near-term outlook: its signal line is pointing downward while the histogram remains entrenched in negative territory, indicating continued selling pressure.

H1 Chart:

On the H1 chart, the instrument completed a downward wave to 4,004 USD before establishing a growth structure. The price is currently consolidating around 4,107 USD. An upward breakout from this range would likely propel prices toward 4,175 USD, retesting the previously breached support level. The Stochastic oscillator supports this short-term bullish scenario, with its signal line positioned above 50 and advancing toward 80, reflecting building upward momentum.

Conclusion

Gold remains caught between monetary headwinds and geopolitical support. While the broader correction appears intact, the current bounce from 4,004 USD suggests potential for further near-term recovery toward 4,175 USD. However, this upward move is likely to present selling opportunities for a resumption of the downtrend towards 3,970 USD. Traders should monitor incoming US data and Fed commentary for catalysts that could determine whether this correction deepens or concludes.


Disclaimer:

Any forecasts contained herein are based on the author’s particular opinion. This analysis may not be treated as trading advice. RoboForex bears no responsibility for trading results based on trading recommendations and reviews contained herein.

Gold Extends Its Rally as Safe-Haven Demand Builds

By RoboForex Analytical Department

The gold market continues to attract strong inflows, underscoring its appeal as a premier defensive asset. Growing anxieties over a potential US government shutdown are fuelling investor nervousness, with Congress once again at a budget impasse. This political deadlock is prompting a flight to safety, benefiting traditional havens like gold and the Swiss franc.

Further pressure on the US dollar stems from the escalation of the trade war, as Donald Trump’s rhetoric grows increasingly assertive. Proposals for higher tariffs, a overhaul of import flows, and fresh threats against China are being factored into market expectations for future inflation and Federal Reserve policy.

Amid this backdrop, the yield on 10-year US Treasuries has dipped below 4.2%, while the DXY dollar index struggles for direction. Markets are progressively pricing in a more dovish Fed stance by year-end, creating a solid fundamental base for gold.

Investors are increasingly turning to XAU/USD as a hedge against mounting political and economic uncertainty, viewing the metal as a reliable insurance policy.

Technical Analysis: XAU/USD

H4 Chart:

On the H4 chart, gold found strong support at 4,190 USD and is advancing towards an initial target of 4,266 USD. Upon reaching this level, a corrective pullback towards 4,100 USD is anticipated. Provided the broader bullish structure holds, this could establish a foundation for a subsequent upward wave, with potential targets at 4,300 – 4,400 USD. The MACD indicator corroborates this constructive outlook. Its signal line is firmly above zero and trending higher, confirming the current dominance of buyers.

H1 Chart:

On the H1 chart, the instrument decisively broke above the 4,190 USD resistance, consolidating around this level before extending its gains towards 4,266 USD. A period of profit-taking is expected here, likely triggering a retracement to retest 4,190 USD as support. A successful hold above this level could signal a resumption of the uptrend, targeting 4,300 – 4,400 USD. The Stochastic oscillator aligns with this view, with its signal line positioned above 50 and advancing towards 80, reflecting sustained bullish momentum.

Conclusion

Gold’s rally is being driven by a powerful confluence of political uncertainty, trade war escalation, and shifting monetary policy expectations. While a short-term technical correction is likely as profits are taken, the fundamental and technical backdrop remains decidedly bullish.


Disclaimer:

Any forecasts contained herein are based on the author’s particular opinion. This analysis may not be treated as trading advice. RoboForex bears no responsibility for trading results based on trading recommendations and reviews contained herein.

Silver nears $50 per ounce mark. Oil prices rise amid inventory drawdowns

By JustMarkets 

The Dow Jones (US30) Index fell by 0.01% at the close of Wednesday. The S&P 500 (US500) rose by 0.58%. The technological Nasdaq (US100) Index closed higher by 1.12%. The latest FOMC minutes showed that the majority of Federal Reserve officials noted the advisability of transitioning the federal funds rate to a more neutral level, as, in their view, the risks to employment had increased. However, according to the latest FOMC meeting minutes, the majority still emphasized that the risks to inflation remain tilted to the upside. Furthermore, a majority of participants deemed further policy easing likely for the remainder of the year, with about half of the officials expecting two more interest rate cuts by the end of 2025. Officials continued to state that they would weigh risks to both inflation and employment when considering their future actions.

AMD surged by 11.3% during the session and is up more than 40% since the start of the week as markets continued to price in the chipmaker’s deal with OpenAI, which marked over $1 trillion for the ChatGPT maker in a series of circular deals. Micron shares jumped 5.9%, while Nvidia, Oracle, and Amazon each rose by more than 2%. Cisco stock climbed 2% on the back of the release of a new artificial intelligence chip for data centers. Conversely, shares of defensive consumer companies and banks declined.

Stock markets in Europe rose yesterday. The German DAX (DE40) increased by 0.87%, the French CAC 40 (FR40) closed up by 1.07%, the Spanish IBEX35 (ES35) gained 0.97%, and the UK FTSE 100 (UK100) closed 0.69% higher. The Frankfurt DAX Index reached an all-time high on Wednesday. Market sentiment was lifted by new EU trade measures and plans to limit steel imports, although weak data from Germany and political uncertainty in France capped gains. Industrial production in Germany fell by 4.3% in August, the sharpest decline since March 2022, far exceeding the expected drop of 1%.

WTI oil prices rose by 1.5% to $62.65 per barrel after EIA data showed a sharp inventory drawdown at the key Cushing, Oklahoma hub. Inventories there shrank by 763,000 barrels last week, the largest drop since June, while nationwide crude inventories grew more than expected but remained close to seasonal lows. The report also showed a decline in refined product inventories, suggesting strengthening demand. Nevertheless, price gains were limited by expectations of abundant global supply. OPEC+ continues to ramp up production, and US oil output is expected to hit a record high this year.

Silver gained over 3% on Wednesday, nearing the $50 per ounce mark, an all-time high, as the protracted US government shutdown amid heightened geopolitical and economic uncertainty spurred demand for safe-haven assets. Markets are also anticipating the US Federal Reserve to cut its rate by a quarter point this month and likely one more in December. Concurrently, strong physical demand from the solar energy and electronics sectors continued to support prices, with the Silver Institute projecting a global supply deficit in 2025 for the fifth consecutive year.

Asian markets mostly fell yesterday. Japan’s Nikkei 225 (JP225) dropped by 0.45%, China’s FTSE China A50 (CHA50) did not trade yesterday, the Hang Seng (HK50) declined by 0.48%, and Australia’s ASX 200 (AU200) posted a negative result of 0.10%.

On Thursday, Chinese indices rose as mainland Chinese markets resumed trading after the long “Golden Week” holidays, during which a record 2.43 billion inter-regional passenger trips were recorded. Mining stocks led the gains after Beijing imposed export controls on rare-earth processing technology in a bid to solidify its dominance in the sector amid growing competition with the US.

The Australian dollar (AUD) climbed to around $0.660 on Thursday, extending gains from the previous session, as higher inflation expectations strengthened the Reserve Bank of Australia’s (RBA) hawkish stance. Consumer inflation expectations rose to 4.8% in October 2025 from 4.7% in September, the highest since June, on fears that third-quarter inflation could top prognoses. This reinforces the Central Bank’s cautious position, which is expected to keep its policy rate unchanged after setting it at 3.6% in September.

On Thursday, the New Zealand dollar (NZD) rose to $0.58, recovering from losses during the previous session when the Reserve Bank surprised markets with a larger-than-expected rate cut. On Wednesday, the Central Bank slashed the official cash rate (OCR) by 50 basis points to 2.50%, the lowest level since July 2022, citing concerns over the unsustainable state of the economy and leaving the door open for further easing. Markets are pricing in an 80% chance of a 25 bps rate cut at the RBNZ’s next meeting in November, and see roughly even odds that rates could fall to 2.0% by next year.

S&P 500 (US500) 6,753.72 +39.13 (+0.58%)

Dow Jones (US30) 46,601.78 −1.20 (−0.01%)

DAX (DE40) 24,597.13 +211.35 (+0.87%)

FTSE 100 (UK100) 9,548.87 +65.29 (+0.69%)

USD Index 98.85 +0.28 (+0.28%)

News feed for: 2025.10.09

  • German Trade Balance (m/m) at 09:00 (GMT+3);
  • Eurozone ECB Monetary Meeting Accounts at 14:30 (GMT+3);
  • Mexico Inflation Rate (m/m) at 15:00 (GMT+3);
  • US Initial Jobless Claims (w/w) at 15:30 (GMT+3) (Tentative);
  • US Fed Chair Powell Speaks at 15:30 (GMT+3);
  • US Natural Gas Storage (w/w) at 17:30 (GMT+3).

By JustMarkets


This article reflects a personal opinion and should not be interpreted as an investment advice, and/or offer, and/or a persistent request for carrying out financial transactions, and/or a guarantee, and/or a forecast of future events.

Gold Surges 50% Year-to-Date with Further Gains Expected

By RoboForex Analytical Department

Gold soared to a fresh record high on Monday, breaching 3,923 USD per ounce as demand for safe-haven assets intensified. The protracted US government shutdown continues to be a primary catalyst for the rally.

The budget crisis has extended into the new week following a failed Senate vote on Friday, leading to prolonged delays in key macroeconomic data publications—including the critical September non-farm payrolls report. In the absence of official statistics, investors are relying on indirect indicators that suggest a gradual softening of the US labour market.

With a vacuum in fresh economic data, market attention has turned to commentary from Federal Reserve officials for any clarity on the future path of monetary policy.

Since the start of the year, gold has appreciated by nearly 50%. This remarkable rally has been driven by a confluence of factors: persistent economic and geopolitical uncertainty, expectations of a protracted Fed easing cycle, and consistent investment inflows into gold-backed ETFs.

Technical Analysis: XAU/USD

H4 Chart:

On the H4 chart, XAU/USD found strong support at the 3,820 USD level and is now advancing within a growth wave targeting 4,000 USD. This is considered a local target. Upon reaching it, a corrective pullback towards 3,820 USD is anticipated. Following this correction, the formation of another upward wave targeting 4,170 USD is expected. This bullish outlook is technically confirmed by the MACD indicator, whose signal line is positioned above zero and pointing sharply upward.

H1 Chart:

The H1 chart shows the pair breaking above the 3,896 USD resistance, subsequently forming a consolidation range around this level. Today’s upside breakout has confirmed the continuation of the bullish impulse towards 3,972 USD. A correction back to 3,896 USD is likely upon reaching this target, after which a resumption of the uptrend towards 4,000 USD is expected. The Stochastic oscillator corroborates this view, with its signal line currently above 80 and poised to decline towards 50, indicating potential for a short-term pullback before further gains.

Conclusion

Gold’s record-breaking rally shows no signs of abating, underpinned by a supportive macroeconomic backdrop and strong technical momentum. While a short-term correction is increasingly likely as the market becomes overbought, the broader bullish trend remains firmly intact, with clear technical targets projecting further gains ahead.


Disclaimer:

Any forecasts contained herein are based on the author’s particular opinion. This analysis may not be treated as trading advice. RoboForex bears no responsibility for trading results based on trading recommendations and reviews contained herein.

Gold Holds Near Record Highs as Demand Sustains Rally

By RoboForex Analytical Department

Gold traded around 3,760 USD per ounce on Wednesday, hovering near the record high established the previous day. The market continued to digest commentary from Federal Reserve officials, including Chair Jerome Powell.

Powell acknowledged the Fed’s challenging position, citing a combination of accelerating inflation and sluggish employment growth, which together heighten risks for the labour market. While he expressed satisfaction with the current policy trajectory, he left the door open for further interest rate cuts if warranted by economic conditions.

Market pricing in futures contracts indicates expectations for two additional 25-basis-point cuts this year, potentially in October and December. Investor focus now shifts to the upcoming release of the August PCE index – the Fed’s preferred inflation gauge – as well as scheduled speeches from other Fed officials.

Geopolitical tensions are providing additional support for the precious metal. NATO’s recent warning that it is prepared to deploy all necessary measures, both military and non-military, in its defence has bolstered gold’s appeal as a safe-haven asset.

Technical Analysis: XAU/USD

H4 Chart:

On the H4 chart, XAU/USD formed a tight consolidation range around 3,734 USD before breaking upwards to complete an upward move towards 3,790 USD. Following a correction to 3,750 USD, a new upward impulse has begun. The immediate focus is now on a break above the 3,790 USD level, which could open the path for a continuation towards 3,840 USD, with a longer-term prospect of reaching 3,878 USD. This bullish scenario is technically confirmed by the MACD indicator, whose signal line is well above the zero line and trending higher.

H1 Chart:

The H1 chart shows the pair consolidating around 3,717 USD before initiating an upward move targeting 3,808 USD. Upon reaching this level, a corrective pullback towards 3,730 USD is possible. Following this, a resumption of the uptrend towards at least 3,820 USD is anticipated. This outlook is supported by the Stochastic oscillator, with its signal line currently above 50 and rising sharply towards 80.

Conclusion

Gold remains well-supported fundamentally by a dovish-leaning Fed and geopolitical risks, while the technical picture suggests the bullish momentum is intact. A sustained break above the immediate resistance could trigger the next leg higher towards fresh record levels.


Disclaimer:

Any forecasts contained herein are based on the author’s particular opinion. This analysis may not be treated as trading advice. RoboForex bears no responsibility for trading results based on trading recommendations and reviews contained herein.

COT Metals Charts: Weekly Speculator Changes led by Gold & Copper

By InvestMacro

Metals Open Interest COT Chart

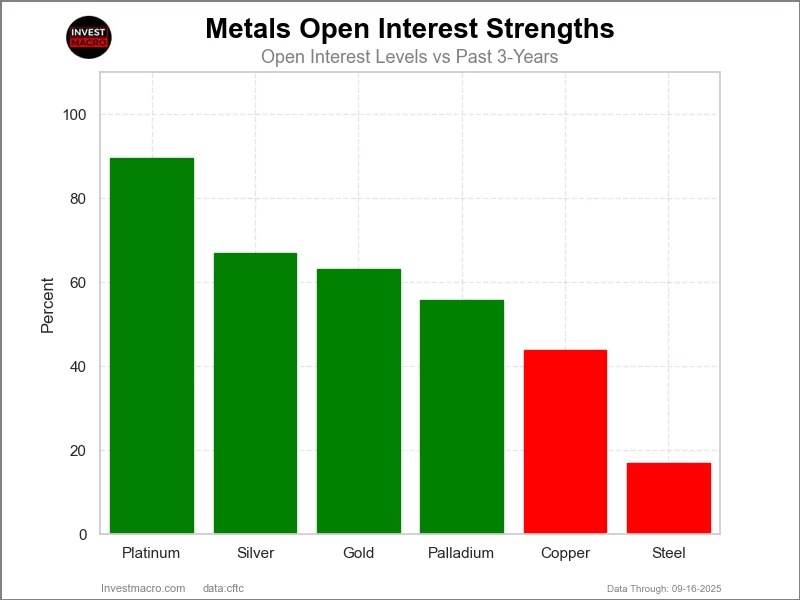
Open Interest Strength Levels vs Past 3-Years (Where are Traders putting positions in?)

Here are the latest charts and statistics for the Commitment of Traders (COT) data published by the Commodities Futures Trading Commission (CFTC).

The latest COT data is updated through Tuesday September 16th and shows a quick view of how large traders (for-profit speculators and commercial entities) were positioned in the futures markets.

Weekly Speculator Changes led by Gold & Copper

Metals Net Positions COT Chart
The COT metals markets speculator bets were mixed this week as three out of the six metals markets we cover had higher positioning while the other three markets had lower speculator contracts.

Leading the gains for the metals was Gold (4,670 contracts) with Copper (3,107 contracts) and Platinum (847 contracts) also showing positive weeks.

The markets with declines in speculator bets for the week were Silver (-2,399 contracts), Palladium (-270 contracts) and with Steel (-28 contracts) also registering lower bets on the week.

Silver leads Metals Price Changes this week

Silver was the leader in this week’s metals market’s price performance changes. Silver was up by 1.8% over the last 5 days and has been higher by 12.28% over the past 30 days, while also surging by 31.72% over the past 90 days.

Gold comes in next with a gain of 1.09% on the week. Gold has risen by 8.31% in the past 30 days and is up by 13.74% over the past 90 days. Platinum also rose modestly this week with a 0.45% gain. Platinum has seen its price shoot up by 5.44% in the past 30 days and by a whopping 42.27% in the past 90 days.

Copper dipped by -0.28% this week. Copper has been up by approximately 4% in the past 30 days, but over the past 90 days copper has fallen by -1.24%. Steel dropped this week by -3.59%. However, Steel has been higher by over 3% in the past 30 days and is up by approximately 19% in the past 90 days.

Palladium came in as the biggest loser this week with a -5.39% decline. Palladium, however, has been higher by over 2% in the past 30 days and has increased by approximately 20% over the past 90 days.


Metals Data:

Metals Table COT Chart
Legend: Weekly Speculators Change | Speculators Current Net Position | Speculators Strength Score compared to last 3-Years (0-100 range)


Strength Scores led by Gold & Silver

Metals Strength Scores COT Chart
COT Strength Scores (a normalized measure of Speculator positions over a 3-Year range, from 0 to 100 where above 80 is Extreme-Bullish and below 20 is Extreme-Bearish) showed that Gold (81 percent) and Silver (79 percent) lead the metals markets this week. Palladium (74 percent) comes in as the next highest in the weekly strength scores.

On the downside, Platinum (49 percent) comes in at the lowest strength level currently.

Strength Statistics:
Gold (81.4 percent) vs Gold previous week (79.6 percent)
Silver (79.1 percent) vs Silver previous week (82.3 percent)
Copper (61.5 percent) vs Copper previous week (58.6 percent)
Platinum (49.0 percent) vs Platinum previous week (46.9 percent)
Palladium (74.4 percent) vs Palladium previous week (76.4 percent)
Steel (59.8 percent) vs Steel previous week (60.0 percent)


Gold & Copper top the 6-Week Strength Trends

Metals Trends COT Chart
COT Strength Score Trends (or move index, calculates the 6-week changes in strength scores) showed that Gold (11 percent) and Copper (9 percent) lead the past six weeks trends for metals.

Palladium (-13 percent) and Platinum (-4 percent) lead the downside trend scores currently.

Move Statistics:
Gold (11.2 percent) vs Gold previous week (14.5 percent)
Silver (1.2 percent) vs Silver previous week (-7.3 percent)
Copper (9.0 percent) vs Copper previous week (-9.4 percent)
Platinum (-3.7 percent) vs Platinum previous week (-15.6 percent)
Palladium (-12.6 percent) vs Palladium previous week (-14.2 percent)
Steel (0.1 percent) vs Steel previous week (-9.5 percent)


Individual Markets:

Gold Comex Futures:

Gold Futures COT ChartThe Gold Comex Futures large speculator standing this week reached a net position of 266,410 contracts in the data reported through Tuesday. This was a weekly rise of 4,670 contracts from the previous week which had a total of 261,740 net contracts.

This week’s current strength score (the trader positioning range over the past three years, measured from 0 to 100) shows the speculators are currently Bullish-Extreme with a score of 81.4 percent. The commercials are Bearish-Extreme with a score of 13.5 percent and the small traders (not shown in chart) are Bullish-Extreme with a score of 94.5 percent.

Price Trend-Following Model: Strong Uptrend

Our weekly trend-following model classifies the current market price position as: Strong Uptrend.

Gold Futures StatisticsSPECULATORSCOMMERCIALSSMALL TRADERS
– Percent of Open Interest Longs:63.315.111.8
– Percent of Open Interest Shorts:11.773.74.8
– Net Position:266,410-302,37135,961
– Gross Longs:326,77877,86760,872
– Gross Shorts:60,368380,23824,911
– Long to Short Ratio:5.4 to 10.2 to 12.4 to 1
NET POSITION TREND:
– Strength Index Score (3 Year Range Pct):81.413.594.5
– Strength Index Reading (3 Year Range):Bullish-ExtremeBearish-ExtremeBullish-Extreme
NET POSITION MOVEMENT INDEX:
– 6-Week Change in Strength Index:11.2-11.69.7


Silver Comex Futures:

Silver Futures COT ChartThe Silver Comex Futures large speculator standing this week reached a net position of 51,538 contracts in the data reported through Tuesday. This was a weekly lowering of -2,399 contracts from the previous week which had a total of 53,937 net contracts.

This week’s current strength score (the trader positioning range over the past three years, measured from 0 to 100) shows the speculators are currently Bullish with a score of 79.1 percent. The commercials are Bearish-Extreme with a score of 18.1 percent and the small traders (not shown in chart) are Bullish with a score of 66.7 percent.

Price Trend-Following Model: Strong Uptrend

Our weekly trend-following model classifies the current market price position as: Strong Uptrend.

Silver Futures StatisticsSPECULATORSCOMMERCIALSSMALL TRADERS
– Percent of Open Interest Longs:44.026.519.9
– Percent of Open Interest Shorts:12.370.37.7
– Net Position:51,538-71,38919,851
– Gross Longs:71,62343,11832,407
– Gross Shorts:20,085114,50712,556
– Long to Short Ratio:3.6 to 10.4 to 12.6 to 1
NET POSITION TREND:
– Strength Index Score (3 Year Range Pct):79.118.166.7
– Strength Index Reading (3 Year Range):BullishBearish-ExtremeBullish
NET POSITION MOVEMENT INDEX:
– 6-Week Change in Strength Index:1.21.0-8.3


Copper Grade #1 Futures:

Copper Futures COT ChartThe Copper Grade #1 Futures large speculator standing this week reached a net position of 30,348 contracts in the data reported through Tuesday. This was a weekly boost of 3,107 contracts from the previous week which had a total of 27,241 net contracts.

This week’s current strength score (the trader positioning range over the past three years, measured from 0 to 100) shows the speculators are currently Bullish with a score of 61.5 percent. The commercials are Bearish with a score of 37.3 percent and the small traders (not shown in chart) are Bullish with a score of 66.4 percent.

Price Trend-Following Model: Strong Downtrend

Our weekly trend-following model classifies the current market price position as: Strong Downtrend.

Copper Futures StatisticsSPECULATORSCOMMERCIALSSMALL TRADERS
– Percent of Open Interest Longs:31.431.78.0
– Percent of Open Interest Shorts:17.749.14.3
– Net Position:30,348-38,4248,076
– Gross Longs:69,37069,99017,621
– Gross Shorts:39,022108,4149,545
– Long to Short Ratio:1.8 to 10.6 to 11.8 to 1
NET POSITION TREND:
– Strength Index Score (3 Year Range Pct):61.537.366.4
– Strength Index Reading (3 Year Range):BullishBearishBullish
NET POSITION MOVEMENT INDEX:
– 6-Week Change in Strength Index:9.0-4.9-24.4


Platinum Futures:

Platinum Futures COT ChartThe Platinum Futures large speculator standing this week reached a net position of 15,203 contracts in the data reported through Tuesday. This was a weekly boost of 847 contracts from the previous week which had a total of 14,356 net contracts.

This week’s current strength score (the trader positioning range over the past three years, measured from 0 to 100) shows the speculators are currently Bearish with a score of 49.0 percent. The commercials are Bullish with a score of 52.1 percent and the small traders (not shown in chart) are Bullish with a score of 66.4 percent.

Price Trend-Following Model: Uptrend

Our weekly trend-following model classifies the current market price position as: Uptrend.

Platinum Futures StatisticsSPECULATORSCOMMERCIALSSMALL TRADERS
– Percent of Open Interest Longs:53.921.310.7
– Percent of Open Interest Shorts:38.742.34.9
– Net Position:15,203-21,0875,884
– Gross Longs:54,06121,32610,757
– Gross Shorts:38,85842,4134,873
– Long to Short Ratio:1.4 to 10.5 to 12.2 to 1
NET POSITION TREND:
– Strength Index Score (3 Year Range Pct):49.052.166.4
– Strength Index Reading (3 Year Range):BearishBullishBullish
NET POSITION MOVEMENT INDEX:
– 6-Week Change in Strength Index:-3.74.9-5.2


Palladium Futures:

Palladium Futures COT ChartThe Palladium Futures large speculator standing this week reached a net position of -4,012 contracts in the data reported through Tuesday. This was a weekly fall of -270 contracts from the previous week which had a total of -3,742 net contracts.

This week’s current strength score (the trader positioning range over the past three years, measured from 0 to 100) shows the speculators are currently Bullish with a score of 74.4 percent. The commercials are Bearish-Extreme with a score of 13.6 percent and the small traders (not shown in chart) are Bullish-Extreme with a score of 84.7 percent.

Price Trend-Following Model: Uptrend

Our weekly trend-following model classifies the current market price position as: Uptrend.

Palladium Futures StatisticsSPECULATORSCOMMERCIALSSMALL TRADERS
– Percent of Open Interest Longs:40.438.615.7
– Percent of Open Interest Shorts:60.627.86.2
– Net Position:-4,0122,1401,872
– Gross Longs:8,0247,6603,113
– Gross Shorts:12,0365,5201,241
– Long to Short Ratio:0.7 to 11.4 to 12.5 to 1
NET POSITION TREND:
– Strength Index Score (3 Year Range Pct):74.413.684.7
– Strength Index Reading (3 Year Range):BullishBearish-ExtremeBullish-Extreme
NET POSITION MOVEMENT INDEX:
– 6-Week Change in Strength Index:-12.611.08.2


Steel Futures Futures:

Steel Futures COT ChartThe Steel Futures large speculator standing this week reached a net position of -84 contracts in the data reported through Tuesday. This was a weekly decline of -28 contracts from the previous week which had a total of -56 net contracts.

This week’s current strength score (the trader positioning range over the past three years, measured from 0 to 100) shows the speculators are currently Bullish with a score of 59.8 percent. The commercials are Bearish with a score of 40.4 percent and the small traders (not shown in chart) are Bullish with a score of 56.3 percent.

Price Trend-Following Model: Strong Downtrend

Our weekly trend-following model classifies the current market price position as: Strong Downtrend.

Steel Futures StatisticsSPECULATORSCOMMERCIALSSMALL TRADERS
– Percent of Open Interest Longs:21.073.12.1
– Percent of Open Interest Shorts:21.473.41.3
– Net Position:-84-74158
– Gross Longs:4,49115,641442
– Gross Shorts:4,57515,715284
– Long to Short Ratio:1.0 to 11.0 to 11.6 to 1
NET POSITION TREND:
– Strength Index Score (3 Year Range Pct):59.840.456.3
– Strength Index Reading (3 Year Range):BullishBearishBullish
NET POSITION MOVEMENT INDEX:
– 6-Week Change in Strength Index:0.10.2-4.3


Article By InvestMacroReceive our weekly COT Newsletter

*COT Report: The COT data, released weekly to the public each Friday, is updated through the most recent Tuesday (data is 3 days old) and shows a quick view of how large speculators or non-commercials (for-profit traders) were positioned in the futures markets.

The CFTC categorizes trader positions according to commercial hedgers (traders who use futures contracts for hedging as part of the business), non-commercials (large traders who speculate to realize trading profits) and nonreportable traders (usually small traders/speculators) as well as their open interest (contracts open in the market at time of reporting). See CFTC criteria here.