
Source: Michael Ballanger (2/6/23)
Michael Ballanger of GGM Advisory Inc. reviews updates within the metals and energy sectors, focusing on some key companies he believes you should take a look at.
In a couple of weeks, I will be defying the accuracy of the actuarial studies by making that fateful transition from sexagenarian to septuagenarian while continuing to shovel winter snow and taking eight-kilometer walks most mornings (when it isn’t –20 C). Being a resident of this “little blue dot,” as Carl Sagan refers to our planet, for seven decades means that I have more than a few memories to recount and more than a few stories to tell.
With that comes an ample helping of regrets of both personal and career origins, but those are offset by the sweet memories of family, friends, and fortuitous events that have been integral to a magnificent journey through time.
One of the most underrated aspects of aging is that trials and tribulations that would have escalated blood pressure when I was in my thirties no longer make a dent in the stress meter, while conversely, considerate gestures and flatteries deemed unremarkable in youth are greatly appreciated in later years.
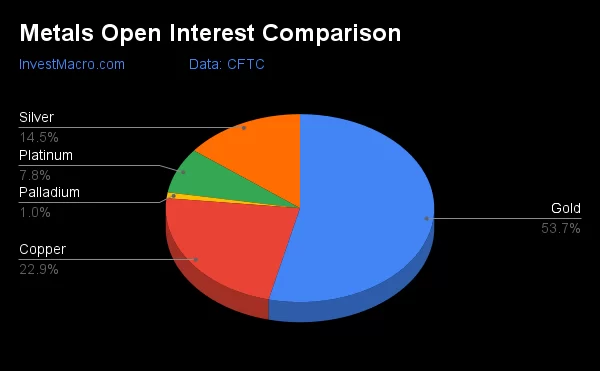
“Humanity has mined about 700 million tonnes of copper to date. The problem is the need to mine that same amount in the next 22 years to keep up with the deepening green energy transition.”
— Robert Friedland, Billionaire mining entrepreneur
Most members of the Boomer Generation can tell you where they were and what they were doing when JFK was gunned down in 1963, where they were in 2001 when the Twin Towers came down, and for residents of former Czechoslovakia, Hungary, Afghanistan, and Ukraine, they will never be able to forget the day the Russian tanks crossed their borders.
Over the past seventy years, there have been far too many instances where political ambition causing pain and suffering was allowed to exert itself within societies and populations, but from my perspective, be it world wars or regional skirmishes, it is always the misguided intentions of politicians that lie as the root of these evils. Left to their own devices, humans, by and large, have learned how to survive together. For centuries upon centuries, homo sapiens have learned to join arms and raise crops, buildings, and families largely absent the horrors of war, especially when they are insulated from the insidious narcotic that accompanies political ambition.
When I sit down at night and listen to speakers like Robert Friedland speak about the future of the global mining industry with specific reference to electrification, I am emboldened that a powerful and highly-influential billionaire entrepreneur like this can offer such a concise vision of the world. Friedland was recently the keynote speaker at the Future Minerals Forum in Riyadh, Saudi Arabia, where he presented the case for “responsible mining” in the quest to provide sufficient quantities of minerals required to implement the global initiative for electrification.
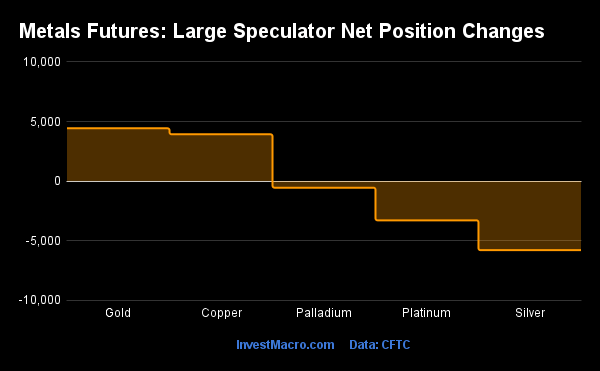
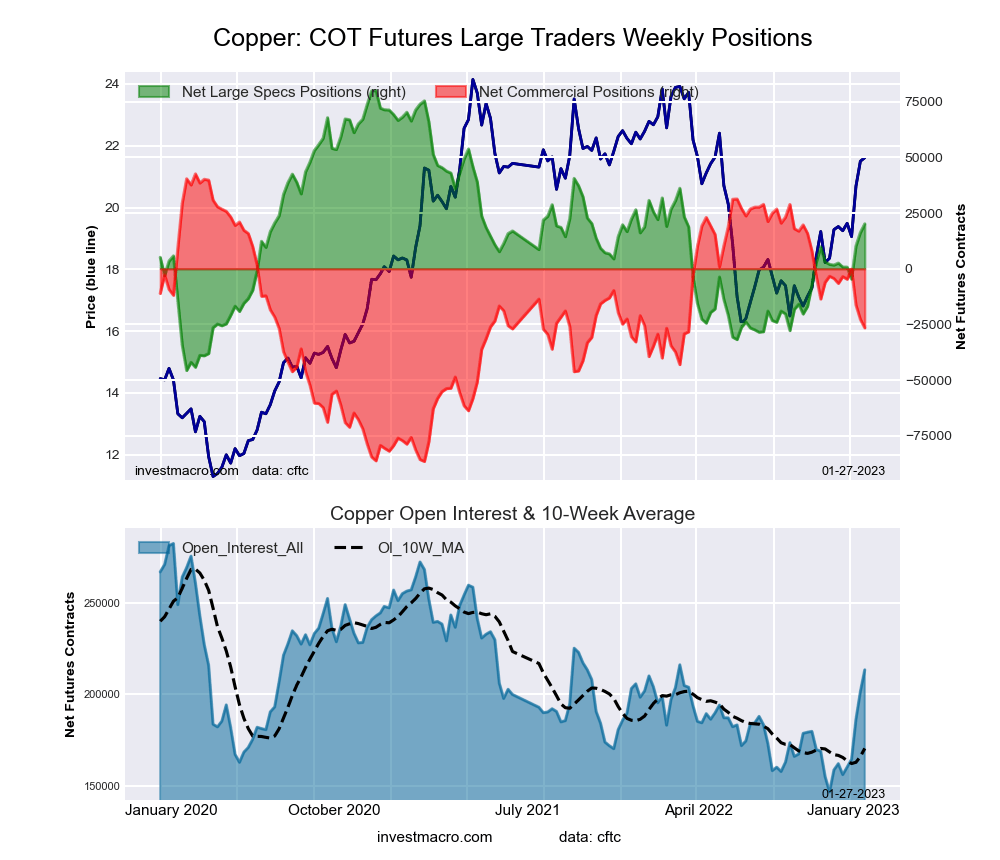
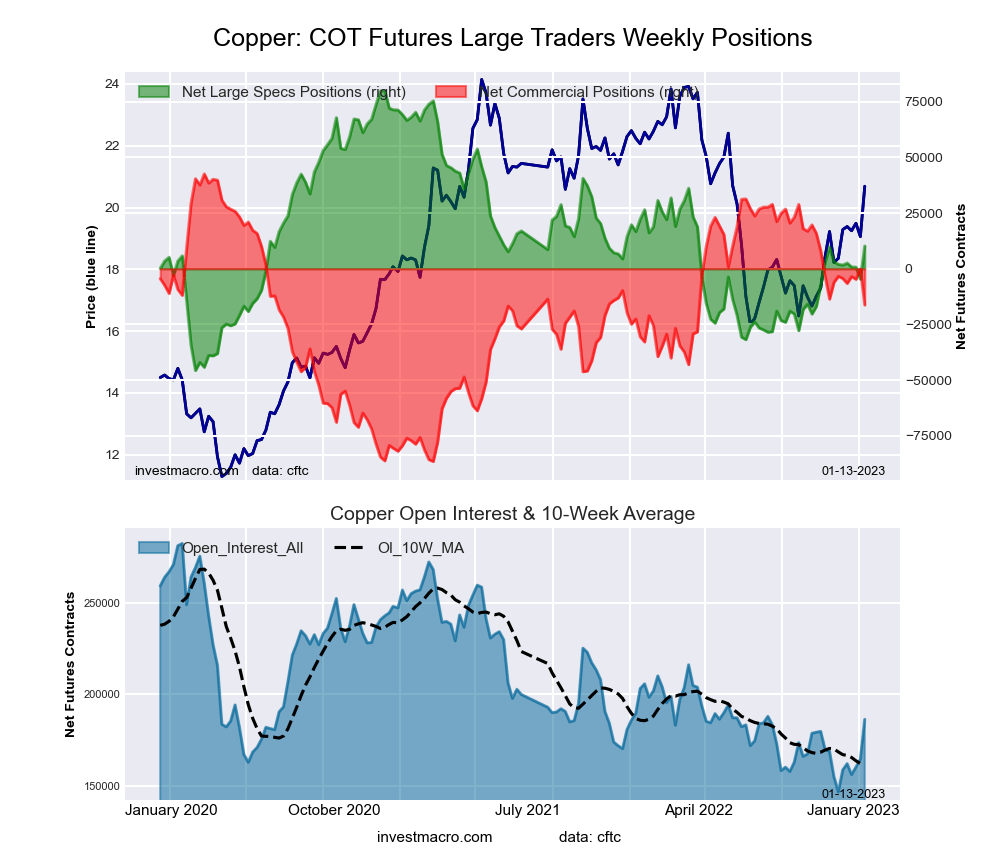
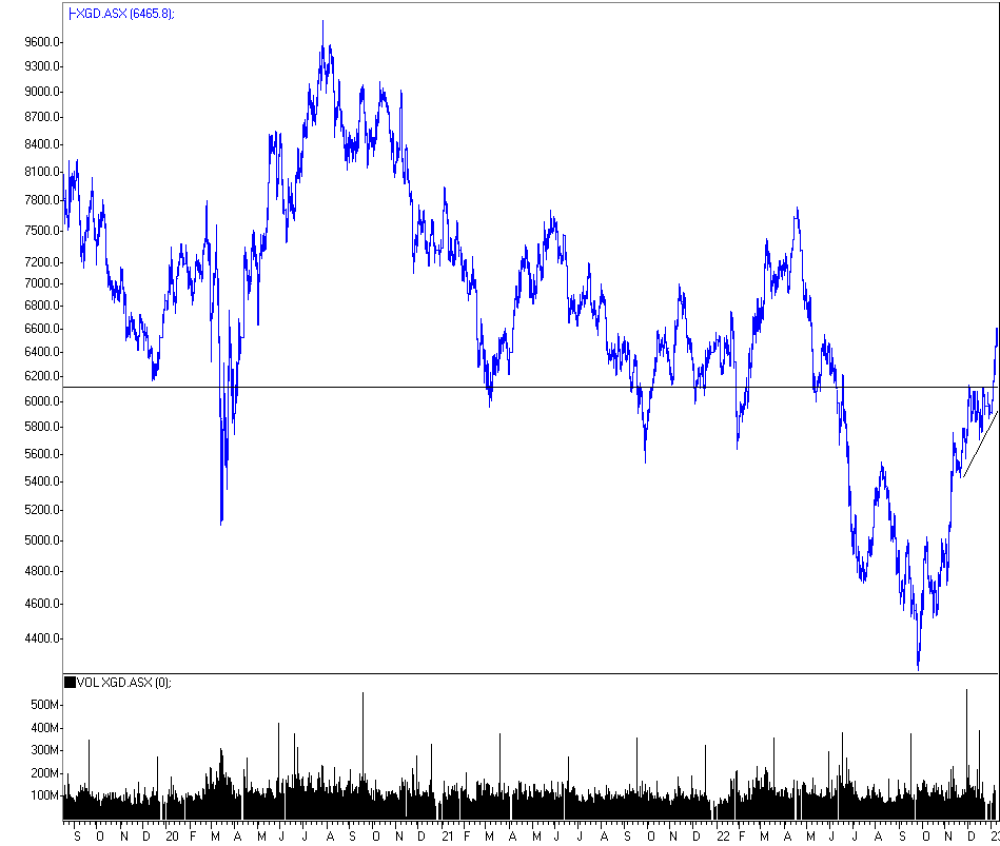
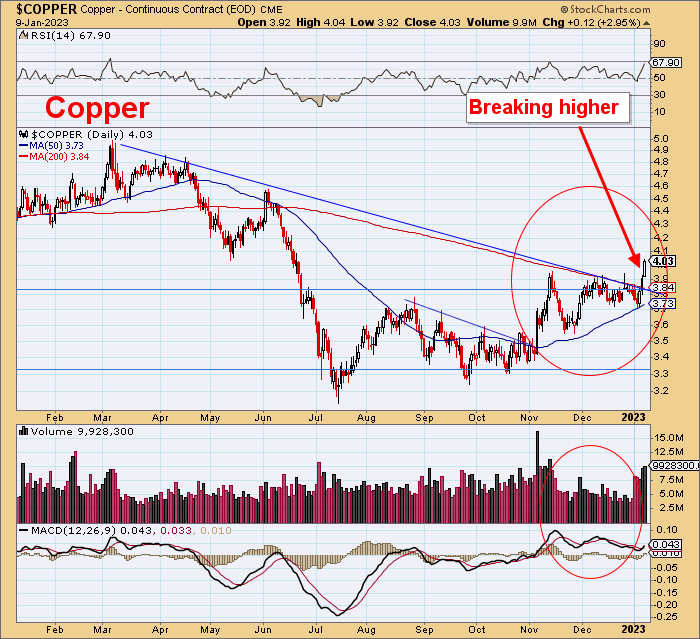
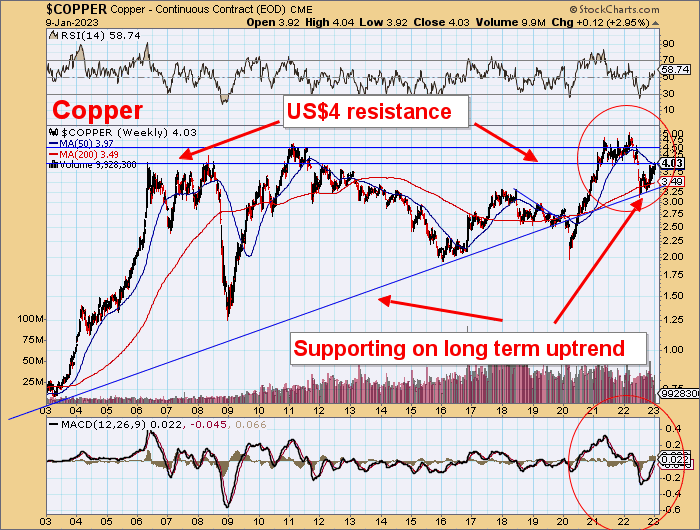
Copper
Included in his remarks were specific mentions of copper, a maidenhead mineral for this publication as well as the suite of minerals used in batteries.
To have a crusty old billionaire boomer take such an active role in the promotion of “responsible mining” crucial to ending mankind’s reliance on fossil fuels is encouraging. Furthermore, to have the greatest promoter that I have ever watched take up the cause in speaking to Heads of State around the globe is exciting. It is also important to understand that the Friedland flagship company, Ivanhoe Mines, is a part owner (39.8%) of Kamoa-Kakula Copper Mine, the world’s fourth-largest but highest-grade copper mine, the Kamoa-Kakula located in the Congo.
With that in mind, please do not get the mistaken impression that I imply that Friedland has been suddenly motivated by altruistic empowerment in place of greed. Taking up the cause of electrification plays beautifully into the future fate of Ivanhoe, and that he now has subsidiary companies Ivanhoe Electric and Cabot Energy exploring opportunities in battery metals and lithium deposits infers a vertical integration for all things that will require an ample Friedland mineral supply, a talent of which he is most certainly capable, gifted, and blessed.
I am certain that if his Electrification Swan Song turns out to be a roaring success, we will have US$8.00/lb. copper and US$500,000/mt lithium, one will find not only a shining halo in the Friedland war chest but also a brand new currency calculator as well. And that’s just fine because there is no motivation better in “building things better” than capitalist aspirations, which include fame and respect along with copious profits. Hence the term “Master Friedland.”
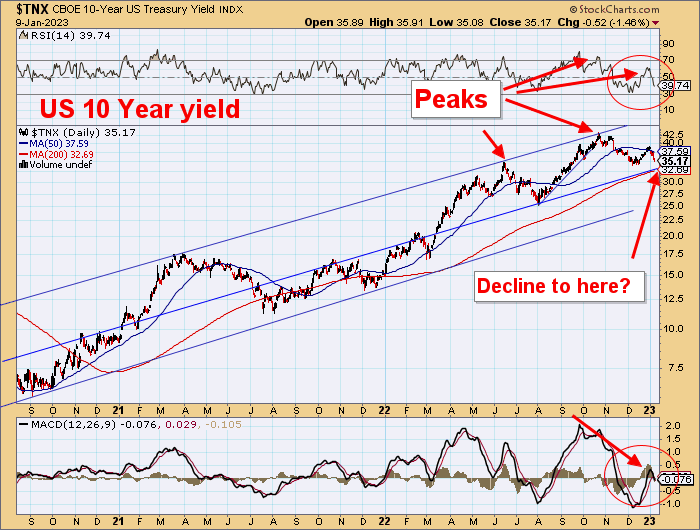
The BLS came out on Friday with the most absurdly-manufactured statistic in economic history with the staggering news that the U.S. economy created more jobs in the December reporting period than median estimates were forecasting. Estimated to be in the 187,000 “new jobs” range, the number came in at 517,000, a 2.76 times your money “beat” that sent everything into the ash can except, of course, the yield on the 10-year treasury, which spiked up 4% to the 3.519% level.
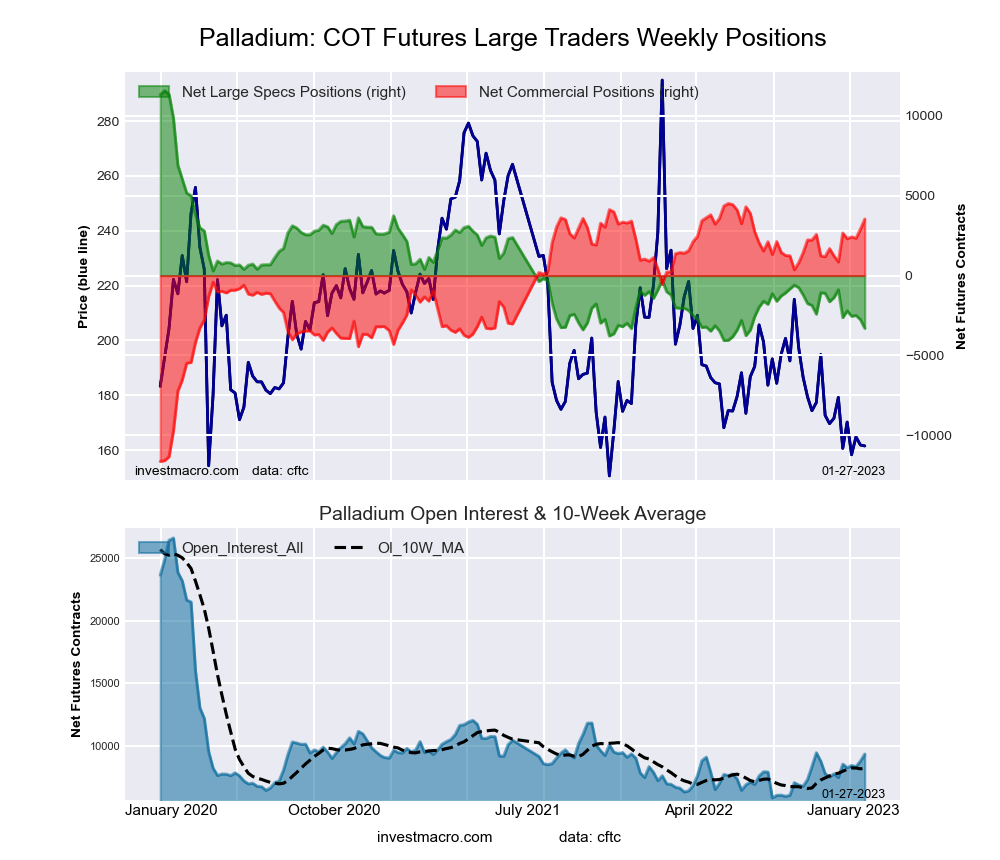
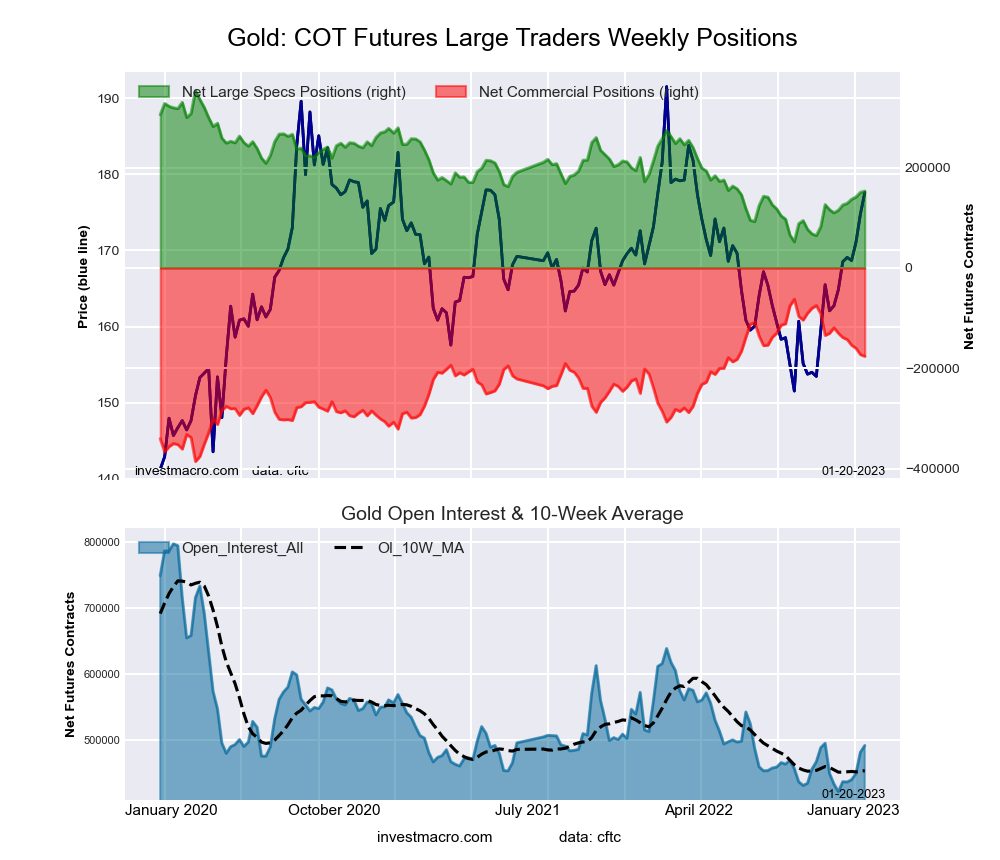
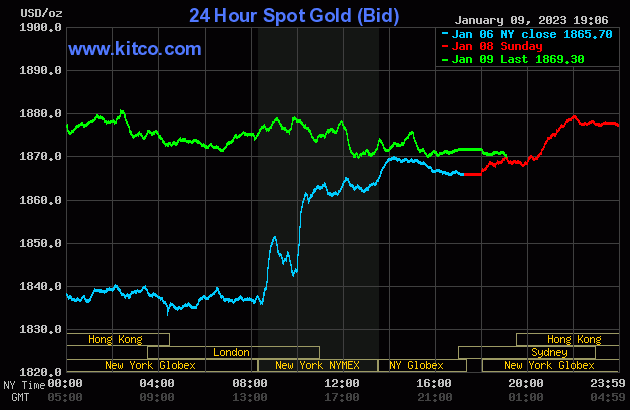
Gold
Notwithstanding that, I absolutely guarantee major revisions with the next report to have such a reaction in the precious metals markets reeked of one thing — shenanigans. No good, rotten, lousy, nefarious, and totally nauseating shenanigans. The gold market has advanced for the past year during a period where yields essentially tripled, so even when Jay Powell threw a number of half-point rate increases at the capital markets, gold absorbed the event because job growth was not the driving force behind gold prices.
The pundits claimed that the shock in the jobs report would see the Fed having conniptions over the inflationary ramifications of the tight employment scene, but what they all forget is that the cost of servicing the U.S. debt bomb is approaching US$1 trillion per year and there comes a point in time where the U.S. currency begins to take the brunt of the credibility gap where foreign investors begin to focus not on the return ON investment but rather the return OF investment before they write a cheque.
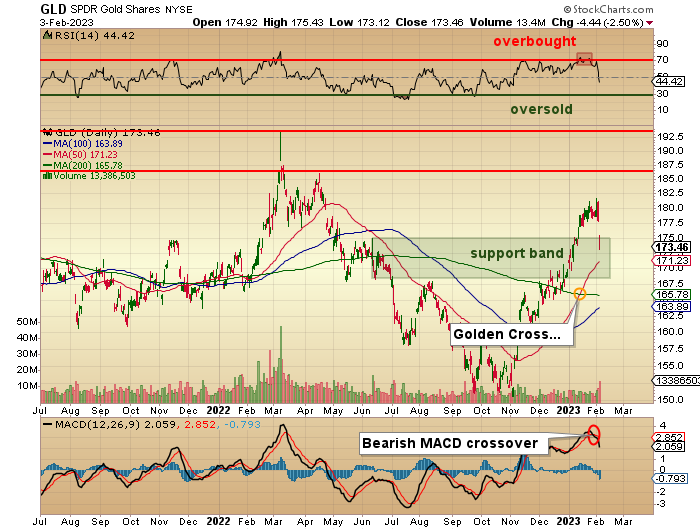
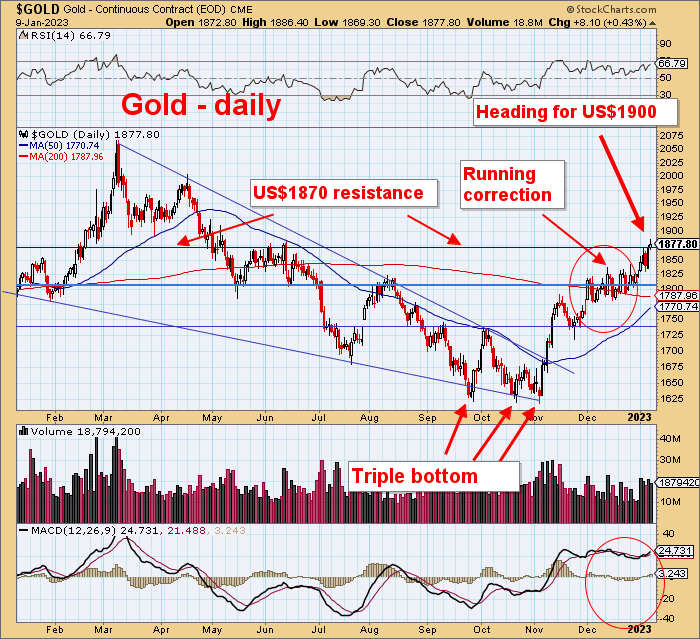
In my view, all that has happened is an overreaction to the overbought condition that I spoke of earlier in the week to my subscribers. Using the gold bullion ETF SPDR Gold Trust (GLD:NYSEARCA) as a trading and charting tool, the big resistance band from late December in the US$170-175 range is now supported after prices escaped the range in January.
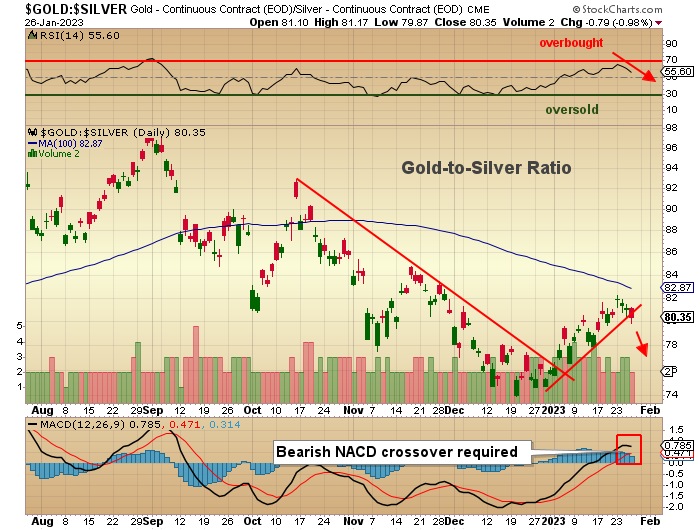
We also got a golden cross with the 50-DMA moving above the 200-DMA last month, putting all the technical conditions on buy signals until Wednesday, when we got a bearish MACD crossover constituting a short-term sell signal. As a result, we now have a large gap in the chart between US$175 and US$178 that will get filled in probably sometime next week into a rally.
RSI has moved a massive 25 points in two trading sessions, moving from over 70 (overbought) to under 45, placing it firmly in neutral now, and if we get further weakness early next week, GLD could actually be approaching oversold status in what is surely one of the quickest overbought-oversold transitions in history which – AGAIN — reeks of shenanigans.
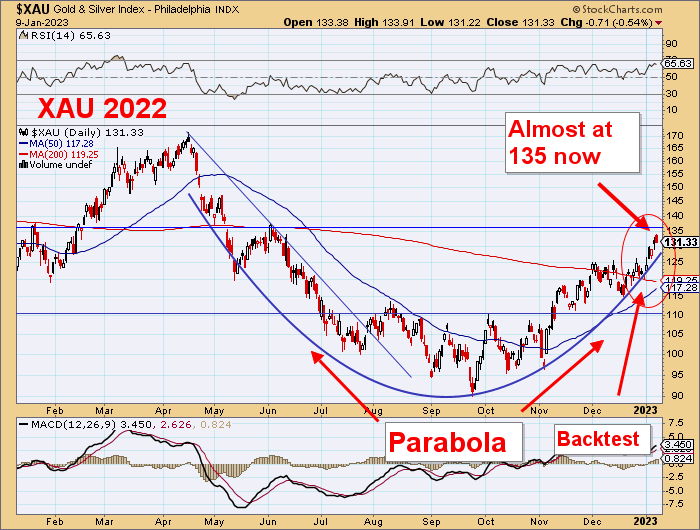
Flipping over to spot gold, I maintain my price objective at US$2,250-2,350 in 2023, with the HUI dancing through 350 by year-end. The reasons I own gold and silver do not include a phony interpretation of employment data conjured up and delivered by ambitious bureaucrats with highly-politicized agendas. US$1,850 spot gold or US$170-171 on the GLD:US and I back up the Ram.
Lithium
Up until a few years ago, I had never come across any resource opportunity that involved the exploration for or development and/or production of lithium. However, given the heat behind the lithium juniors back in 2018, I felt obliged to attempt to bring myself up-to-speed on that market but since its pricing structure was thoroughly dominated by China, I elected to give it a pass.
Then a few weeks back, I was discussing the state of the junior resource market with an Australian colleague who proceeded to show me the chart patterns of several West Australia junior lithium plays, at which point I nearly fell over.
One of them, Patriot Battery Metals Inc. (PMET:CA) traded at CA$0.21 in late-2021, which I thought deserved mention in last week’s weekly missive as it closed over CA$10 per share.
Then with the weekend news that General Motors was investing US$650 million into Lithium Americas Corp. (LAC:TSX; LAC:NYSE) to assist in the development of the Nevada-based Thacker Pass lithium deposit, every lithium stock on the board went into full liftoff mode with PMET closing up another 60% for the week.
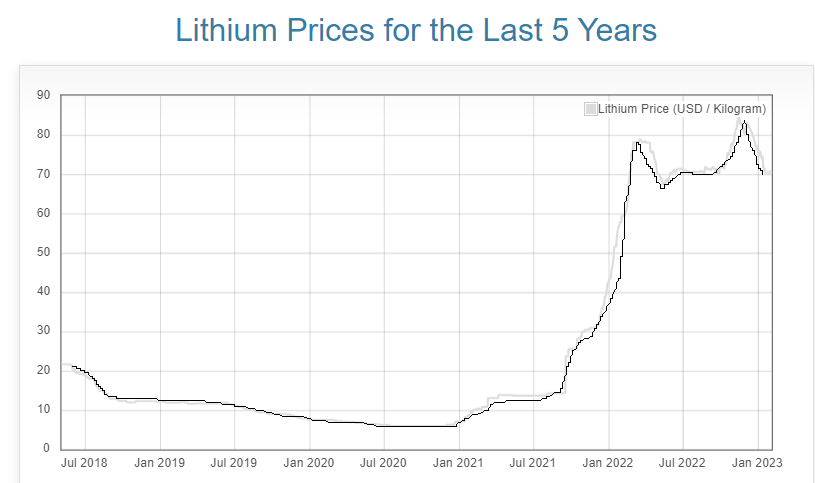
Accordingly, without delay, I launched into a crash course on lithium, ever fearful that I was tempting fate by charging into a market already well-exploited by stock jockeys from Perth, Australia, to Spokane, Washington. What I discovered was a commodity that was on the verge of a massive shortage situation, and despite the 20% correction in lithium prices since last November, demand for the lithium-ion batteries used in every electric vehicle currently in production is going parabolic but with new supply still a few years out.
Lithium carbonate prices in China fell to CNY 472,500 per tonne in February, the lowest since June 2022 and over 20% down since their all-time high of CNY 600,000 in November, as stronger supply and expectations of lower demand drove industry players to bet on a market surplus this year. Added capacity pushed Chinese domestic production to soar by 89% year-on-year in December and by 32.5% in the whole of 2022 despite output cuts in lake-based smelters.
Additionally, top producer Australia projected global output of lithium carbonate equivalent to reach 915,000 tonnes in 2023, a 32% rise from 2022’s estimate. Meanwhile, electric vehicle sales in China are set to decline sharply after the world’s leading consumer stopped subsidies in the sector.
Lithium and its compounds have several industrial applications, including heat-resistant glass and ceramics, lithium grease lubricants, flux additives for iron, steel, and aluminum production, lithium metal batteries, and lithium-ion batteries. These uses consume more than three-quarters of lithium production.
From the Wikipedia textbook: “Because of its relative nuclear instability, lithium is less common in the solar system than 25 of the first 32 chemical elements even though its nuclei are very light: it is an exception to the trend that heavier nuclei are less common.” What that implies is that there is not a great deal of naturally-occurring lithium in nature, so it would stand to reason that dependable resources of lithium concentrate will be in high demand, thus giving junior developers a first-mover advantage if they have had the vision to lock down said resources.
To be sure that I was going to avoid the agony of “Bag Holder Blues,” an affliction suffered by “Last Minute Louie’s” that enter a hot market at or near the top, I did some digging and discovered that not only has Bank of America placed Sigma Lithium Corp. (SGML:TSXV;SGML:US) on its list of “50 Stocks for 10 Scarcity Themes”, a group of automobile manufacturers including BMW, Daimler-Benz, and Volkswagen have entered into an agreement with Chilean-based “Responsible Lithium Partnership” group with a view to developing the Salar de Atacama salt flat. There are two distinct takeaways from this information.
- Large, multi-billion dollar companies with global presences are investing in lithium projects on both the industrial-usage level and the investment banking level, and
- To have a TSX Venture exchange resource developer trading at CA$40 (SGML:TSXV) is uncanny, but it clearly illustrates the appetite for and opportunity surrounding junior lithium developers.
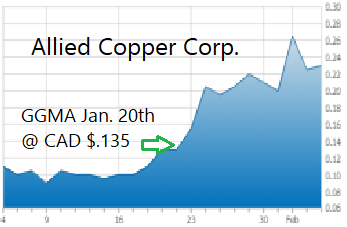
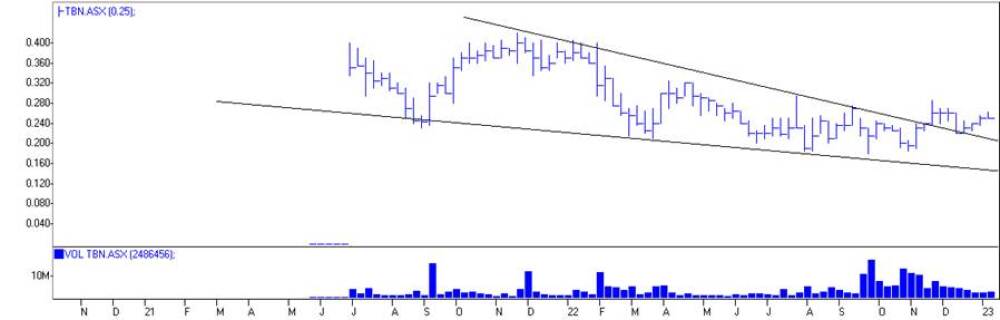
Two weeks ago, I mentioned Allied Copper Corp. (CPR:TSX.V; CPRRF:OTCQB), trading at CA$0.135 after their recent acquisition of Volt Lithium Corp. As the name change will go into effect next week, it was fitting that they announced the termination of the Klondike copper deal in Colorado as evidence that their working capital position is going to be dedicated to the Rainbow Lake Lithium project in Alberta.
The company is completing financing that has been upsized from CA$2m to CA$3m in order to complete the construction of the pilot plant designed to test the economic viability of the process. Early testing confirmed a better-than-anticipated 93% recovery rate for the lithium carbonate, and it is expected to be duplicated after pilot plant completion.
CPR traded up to CA$0.30 to a new 52-week high on Wednesday before closing at CA0$.23 on a weekly volume of 1.88 million shares. Considering that the unit funding is being done at CA$0.20, the tape action has been nothing short of superb.
Once the deal closes, I see another big leg up as the post-financing market cap of US$22 million appears compelling relative to its peer group.
Michael Ballanger Disclaimer:
This letter makes no guarantee or warranty on the accuracy or completeness of the data provided. Nothing contained herein is intended or shall be deemed to be investment advice, implied or otherwise. This letter represents my views and replicates trades that I am making but nothing more than that. Always consult your registered advisor to assist you with your investments. I accept no liability for any loss arising from the use of the data contained on this letter. Options and junior mining stocks contain a high level of risk that may result in the loss of part or all invested capital and therefore are suitable for experienced and professional investors and traders only. One should be familiar with the risks involved in junior mining and options trading and we recommend consulting a financial adviser if you feel you do not understand the risks involved.
Disclosures:
1) Michael J. Ballanger: I, or members of my immediate household or family, own securities of the following companies mentioned in this article: All. I personally am, or members of my immediate household or family are, paid by the following companies mentioned in this article: My company, Bonaventure Explorations Ltd., has a consulting relationship with: None.
2) The following companies mentioned in this article are billboard sponsors of Streetwise Reports: None. Click here for important disclosures about sponsor fees. As of the date of this article, an affiliate of Streetwise Reports has a consulting relationship with: None. Please click here for more information.
3) Statements and opinions expressed are the opinions of the author and not of Streetwise Reports or its officers. The author is wholly responsible for the validity of the statements. The author was not paid by Streetwise Reports for this article. Streetwise Reports was not paid by the author to publish or syndicate this article. Streetwise Reports requires contributing authors to disclose any shareholdings in, or economic relationships with, companies that they write about. Streetwise Reports relies upon the authors to accurately provide this information and Streetwise Reports has no means of verifying its accuracy.
4) This article does not constitute investment advice. Each reader is encouraged to consult with his or her individual financial professional and any action a reader takes as a result of information presented here is his or her own responsibility. By opening this page, each reader accepts and agrees to Streetwise Reports’ terms of use and full legal disclaimer. This article is not a solicitation for investment. Streetwise Reports does not render general or specific investment advice and the information on Streetwise Reports should not be considered a recommendation to buy or sell any security. Streetwise Reports does not endorse or recommend the business, products, services or securities of any company mentioned on Streetwise Reports.
5) From time to time, Streetwise Reports LLC and its directors, officers, employees or members of their families, as well as persons interviewed for articles and interviews on the site, may have a long or short position in securities mentioned. Directors, officers, employees or members of their immediate families are prohibited from making purchases and/or sales of those securities in the open market or otherwise from the time of the decision to publish an article until three business days after the publication of the article. The foregoing prohibition does not apply to articles that in substance only restate previously published company releases.
As of the date of this article, officers and/or employees of Streetwise Reports LLC (including members of their household) own securities of Allied Copper Corp. and Lithium Americas Corp., companies mentioned in this article.


 4
4