
Source: Streetwise Reports (3/20/23)
James Turk of Goldmoney, the impetus behind The Gold Report here at Streetwise, explains why he believes gold and silver are imperative assets to own in this current economy and how you can get involved with them.
Starting his career in the 1960s working for Chase Manhattan Bank in Thailand, The Philippines, and Hong Kong, James Turk has a long history in the world of finance. In 2001, Turk started goldmoney.com with his eldest son, Geoffrey.
GoldMoney (XAU:TSX) focuses on precious metals buying and selling, storage, coin retailing, and gold jewelry manufacturing and sales through a subsidiary, Menē.com, aka Menē Inc. (MENE:TSX.V; MENEF:OTCMKTS).
The company has clients in over 100 countries around the world and currently safeguards over US$2 billion of assets owned by its clients. Overall, Goldmoney has a reputation for success that comes with the reputation held by James Turk.
However, people don’t know that while James Turk is the force behind Goldmoney, he was also the reason The Gold Report was started.
A Discussion in the Mountains
The conversation started in the mountains. Gordon Holmes, the CEO and founder of Streetwise Reports, and James had been friends for years. Then one day, Gordon invited James to share a bottle of wine at Lookout Ridge (Gordon’s winery in California).
As they spoke about the market over a glass of pinot, James asked Gordon why he hadn’t stepped into the gold market yet. Gordon was honest and relayed to him that he didn’t believe he knew enough about the market to be all that involved.
That is when James looked Gordon in the eye and told him, “You’ll figure it out.”
And The Gold Report was born.
Without that fortuitous meeting, Streetwise Reports as we know it may have never come to be.
Why Gold?
Goldmoney may have been started in 2001, but Turk’s interest in gold was fostered from a young age. Growing up, Turk’s father and grandparents shared stories of fleeing from Austria’s hyperinflation after World War I.
Because of this, Turk said, “I’ve always been of the view that gold and silver had an important role to play in economic activity and that accumulating gold and silver was a means of saving — a way to save purchasing power.”
He went on to say, “It’s never too late to save money, but it doesn’t make sense to save fiat currency anymore because of negative interest rates. In other words, if you deposit money into a bank at the end of the year, you have less purchasing power. Even though you’re earning interest income, the inflation rate is higher than the interest income that you’re earning. So you’ll never get ahead that way. With physical gold and silver, you won’t be earning interest income, but you’re going to preserve your purchasing power over time.”
This is one of the reasons Turk is such an ardent advocate for owning some precious metals in a diversified investment portfolio.
Gold After Nixon
In our wide-ranging discussion, Turk also touched on the value of the U.S. dollar compared to gold beginning with President Nixon.
“Living and working in a bank through the 1970s was, for me, a life-changing experience. And obviously, something I’m never going to forget. Worryingly, there are a lot of similarities today to what occurred back then. But there are also some differences too.”
Turk explained that in the 70s, easy money printing caused inflation to soar out of control. When Paul Volcker was appointed chairman of the Federal Reserve in 1979, he kept raising interest rates until inflation began to decline. He did this to save the U.S. dollar when faith in the currency was rapidly eroding.
Turk said, “I’ve always been of the view that gold and silver had an important role to play in economic activity and that accumulating gold and silver was a means of saving — a way to save purchasing power.”
Turk went on to say: “At the peak, the interest income you could earn over and above the inflation rate was 6%, which is phenomenally high because the natural interest rate is normally about 1%.
It was enough to rebuild confidence in the dollar. Volcker eventually brought inflation under control by decreasing — and this is important — decreasing the growth rate of the quantity of dollar currency. He never actually decreased the quantity of dollar currency. There was never any deflation. It was just disinflation, but what’s happening this time around is different.”
“The Federal Reserve cannot simply raise interest rates to levels that Volcker needed to bring down the inflation rate. There’s too much debt in the economy. So now, what the Fed is doing is decreasing the quantity of dollars. This could lead to a deflationary economic collapse.”
Turk noted, “Ultimately, in a deflationary economy, the debtors end up in trouble. The debt burden increases because the value of the currency increases. Also, liquidity disappears in a deflationary environment. Anyone who’s heavily leveraged — like a lot of the banks — tends to suffer in that type of environment, as occurred in the 1930s. So it’s a very important time to be focusing on gold and silver because regardless of whether it’s inflation or deflation, gold, and silver will get you through the turmoil to the other side of the valley.”
In 1971, Nixon closed the gold window breaking its formal link to the dollar. Since then, the dollar’s purchasing power has been eroding, but this process began much earlier. The dollar has lost 98.5% of its purchasing power since the creation of the Federal Reserve in 1913. In recent decades this debasement of the dollar has accelerated.
Measuring in Ounces
Turk went on to say that while we calculate the price of things using the dollar, we must also be using ounces of gold or silver to measure prices.
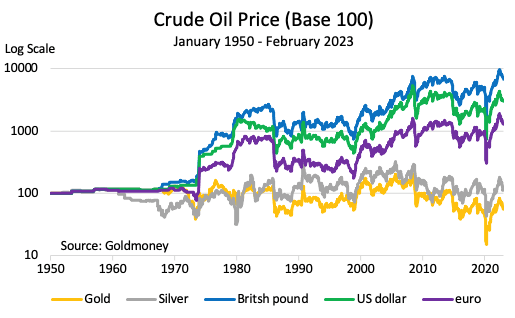
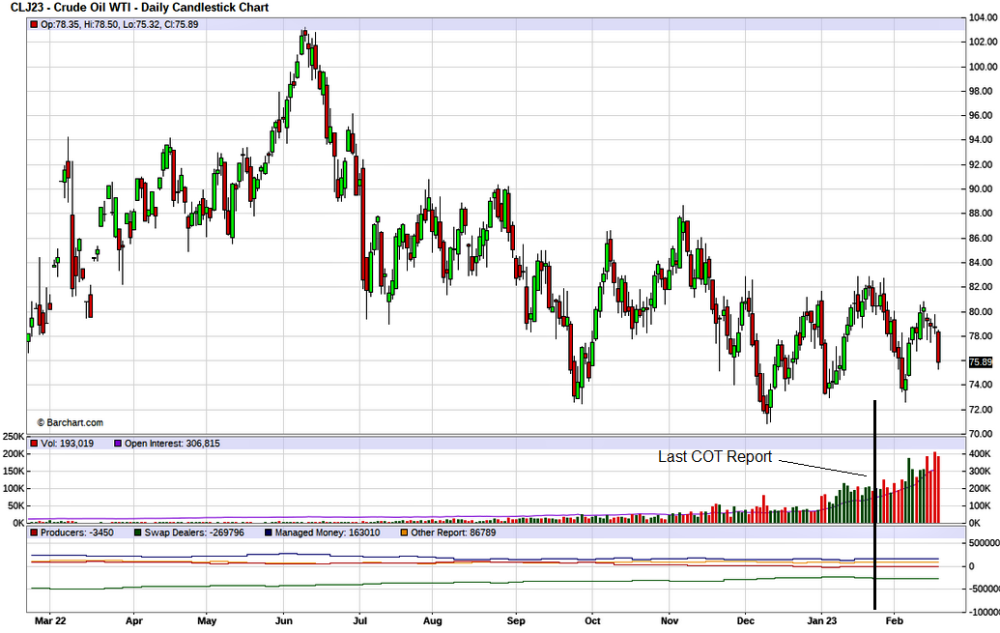
“When looking at the price of crude oil going back to 1950, you get different results depending on the measuring stick used. If you measure oil in terms of ounces of gold, the price of crude oil hasn’t changed much. An ounce of gold buys about the same amount of crude oil today as in 1950.This example shows how gold preserves purchasing power over the long term. It does this because gold is natural money. The quantity of the aboveground stock of gold increases at approximately the same rate as the world’s population and new wealth creation. Because these growth rates are consistent, gold retains its purchasing power.”
“Gold and silver are not investments; they’re money. Gold and silver didn’t increase your wealth — your purchasing power — over these seven decades. They preserved it, which is one of money’s most important functions.”
“I like to tell a story that I remember from growing up in the 1950s. I think is very meaningful.”
“My parents would drive the family car to the local gas station and fill it up for US$2. Back then, the paper currency was silver certificates. You could also pay with silver coins, for example, two silver dollars or four half dollars.”
“Today, US$2 doesn’t even buy a gallon of gas. But the market value of the silver content of those old coins will still fill up the family car.”
The following chart of crude oil prices shows how gold and silver preserve purchasing, but national currencies do not. Measured in dollars, crude oil is 30 times more expensive than it was in 1950. The British pound has fared even worse, with oil 69 times more expensive today in that currency.
“There is one key point that people need to understand,” he continued. “Gold and silver are not investments; they’re money. Gold and silver didn’t increase your wealth — your purchasing power — over these seven decades. They preserved it, which is one of money’s most important functions.”
“Sterile assets like precious metals don’t generate cash flow. When their price rises, purchasing power moves from people owning national currency to people owning precious metals. The precious metals have value because they are useful as money.”
“What’s more,” Turk continued, “they are money that is not based on anyone’s promise, so they don’t have counterparty risk. For that reason, they provide unconditional liquidity. Your purchasing power placed in gold and silver is not reliant upon some bank or a government promise. And by measuring goods, services, and your investment portfolio in terms of ounces, you’ll come up with an entirely different perspective.”
“It is meaningful to use gold to measure accumulated wealth. You are measuring purchasing power with money that has proven its ability to retain its purchasing power over long periods of time — as we can see in the chart of crude oil prices.”
The Decline of the US Dollar
As faith in gold’s purchasing power rises, we see that trust in the U.S. dollar erodes, especially in an inflationary environment.
Turk pointed out that “if you look at measures completed by private economists, the inflation rate is much, much higher than what the government reports. So regardless of who you rely on to measure inflation, the dollar is losing purchasing power every day.”
Will the dollar collapse and become obsolete?
Turk replied: “That involves predicting the future, and unfortunately, no one can predict the future. All you can do is be prepared as best you can for any eventuality. And given their track record going back thousands of years, owning some physical gold and silver is one way to do that. If worse comes to worst, you’ll be prepared and ready by owning some gold and silver so that your wealth is diversified.”
He also favors the shares of precious metal mining companies but advised: “Owning gold and silver is different from owning the shares of mining companies. The shares are investments, not money. Buying shares in mining companies requires the same amount of diligent attention that you apply to any investment. For example, you need to look at the quality of management, the company’s mining property, their financial accounts, country risk where they operate, and many other factors.”
“The mining shares, in my view, are undervalued. They are not tangible assets like gold and silver. I consider them to be ‘near tangible’ because the mining companies own tangible assets in the form of mines and equipment that produce tangible assets.”
How to Store Gold
If you wish to be prepared and get involved in tangible assets, knowing how to store them is imperative. With gold and silver, you have two options. You can either store it yourself or pay for a professional firm to safeguard them for you — this is where Goldmoney comes in.
Turk explained, “Through Goldmoney, customers can store their precious metals in vaults operated by specialized vaulting companies in different places around the world. You can choose among different countries, different political risks, and different geographic risks so that you can diversify. Again, there is no one right answer. But if there is an answer that comes close to being the right choice, it’s diversifying your assets as much as practical.”
When searching for professional storage, Turk pinpointed the importance of working with a company that does independent third-party audits. In this way, you have assurances of integrity that your assets are properly cared for. Goldmoney currently safeguards over US$2 billion in customer assets worldwide.
Money and Liberty: In the Pursuit of Happiness & The Theory of Natural Money
If you’d like to learn more about the importance of gold and silver and how to incorporate them into your portfolio, these and many more topics are covered in James Turk’s latest book, Money and Liberty: In the Pursuit of Happiness & The Theory of Natural Money.
Money and Liberty was published by Wood Lane Books in November 2021 and is available on Amazon. It has been praised as “an excellent and insightful book” that provides “a clear but detailed history of the relationship of sound money to human freedom.”
Disclosures:
1) Katherine DeGilio wrote this article for Streetwise Reports LLC. She or members of her household own securities of the following companies mentioned in the article: None. She or members of her household are paid by the following companies mentioned in this article: None.
2) The following companies mentioned in this article are billboard sponsors of Streetwise Reports: None. Click here for important disclosures about sponsor fees. As of the date of this article, an affiliate of Streetwise Reports has a consulting relationship with: None. Please click here for more information.
3) Statements and opinions expressed are the opinions of the author and not of Streetwise Reports or its officers. The author is wholly responsible for the validity of the statements. The author was not paid by Streetwise Reports for this article. Streetwise Reports was not paid by the author to publish or syndicate this article. Streetwise Reports requires contributing authors to disclose any shareholdings in, or economic relationships with, companies that they write about. Streetwise Reports relies upon the authors to accurately provide this information and Streetwise Reports has no means of verifying its accuracy.
4) This article does not constitute investment advice. Each reader is encouraged to consult with his or her individual financial professional and any action a reader takes as a result of information presented here is his or her own responsibility. By opening this page, each reader accepts and agrees to Streetwise Reports’ terms of use and full legal disclaimer. This article is not a solicitation for investment. Streetwise Reports does not render general or specific investment advice and the information on Streetwise Reports should not be considered a recommendation to buy or sell any security. Streetwise Reports does not endorse or recommend the business, products, services or securities of any company mentioned on Streetwise Reports.
5) From time to time, Streetwise Reports LLC and its directors, officers, employees or members of their families, as well as persons interviewed for articles and interviews on the site, may have a long or short position in securities mentioned. Directors, officers, employees or members of their immediate families are prohibited from making purchases and/or sales of those securities in the open market or otherwise from the time of the decision to publish an article until three business days after the publication of the article. The foregoing prohibition does not apply to articles that in substance only restate previously published company releases.


