
By InvestMacro
Here are the latest charts and statistics for the Commitment of Traders (COT) data published by the Commodities Futures Trading Commission (CFTC).
The latest COT data is updated through Tuesday December 6th and shows a quick view of how large traders (for-profit speculators and commercial entities) were positioned in the futures markets.
Gold & Platinum lead the Weekly Speculator Changes
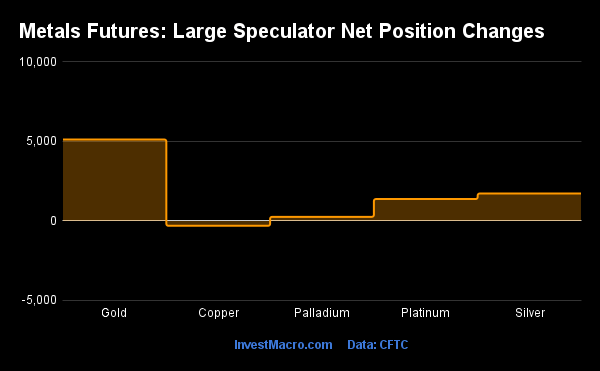
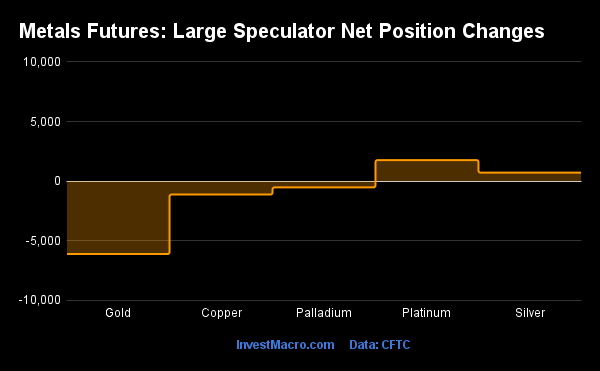
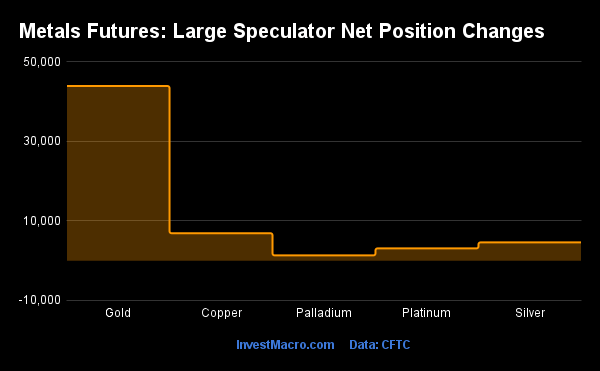
The COT precious metals speculator bets were higher this week as four out of the five metals markets we cover had higher positioning this week while just one market had lower contracts.
Leading the gains for the precious metals markets was Gold (5,122 contracts) with Platinum (1,377 contracts), Silver (1,725 contracts) and Palladium (259 contracts) also showing a positive week.
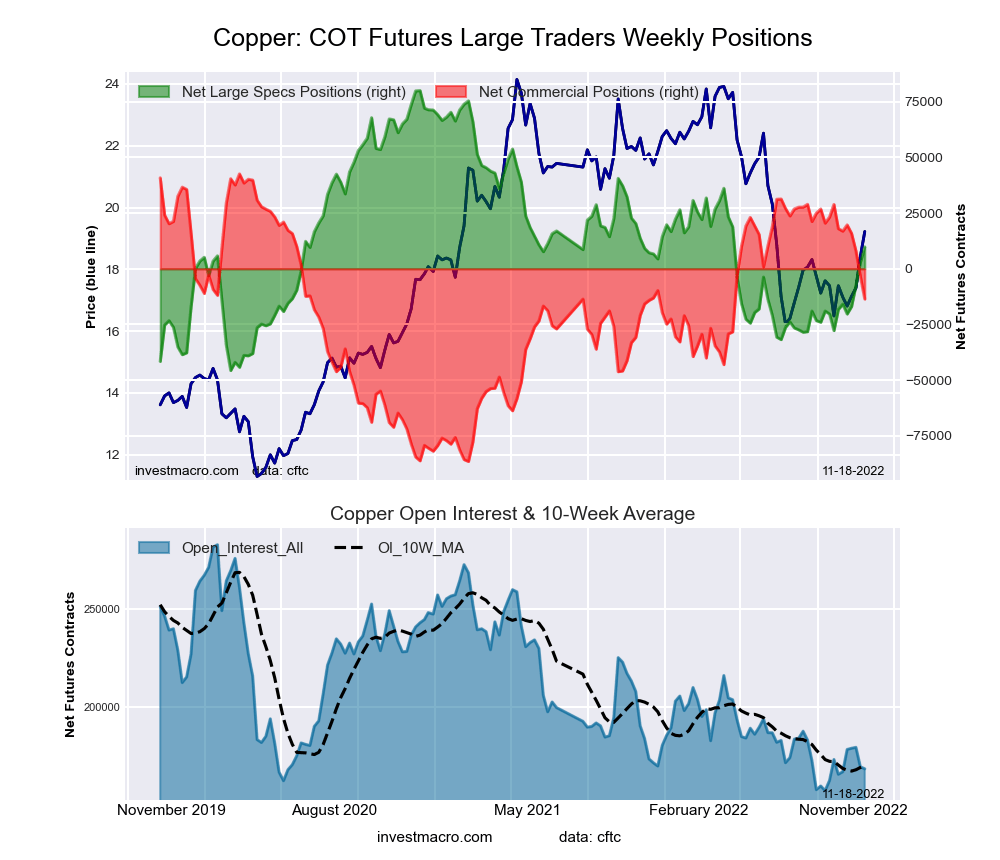
The only metals markets with declines in speculator bets this week was Copper at a total of -305 contracts.
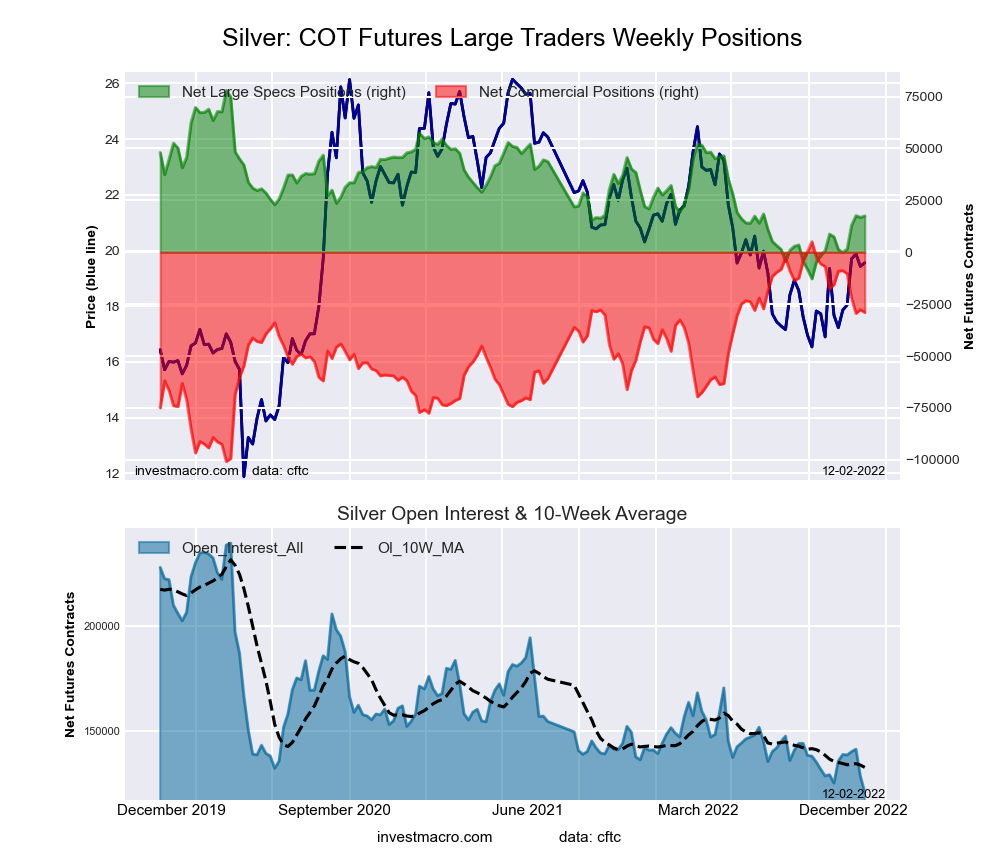
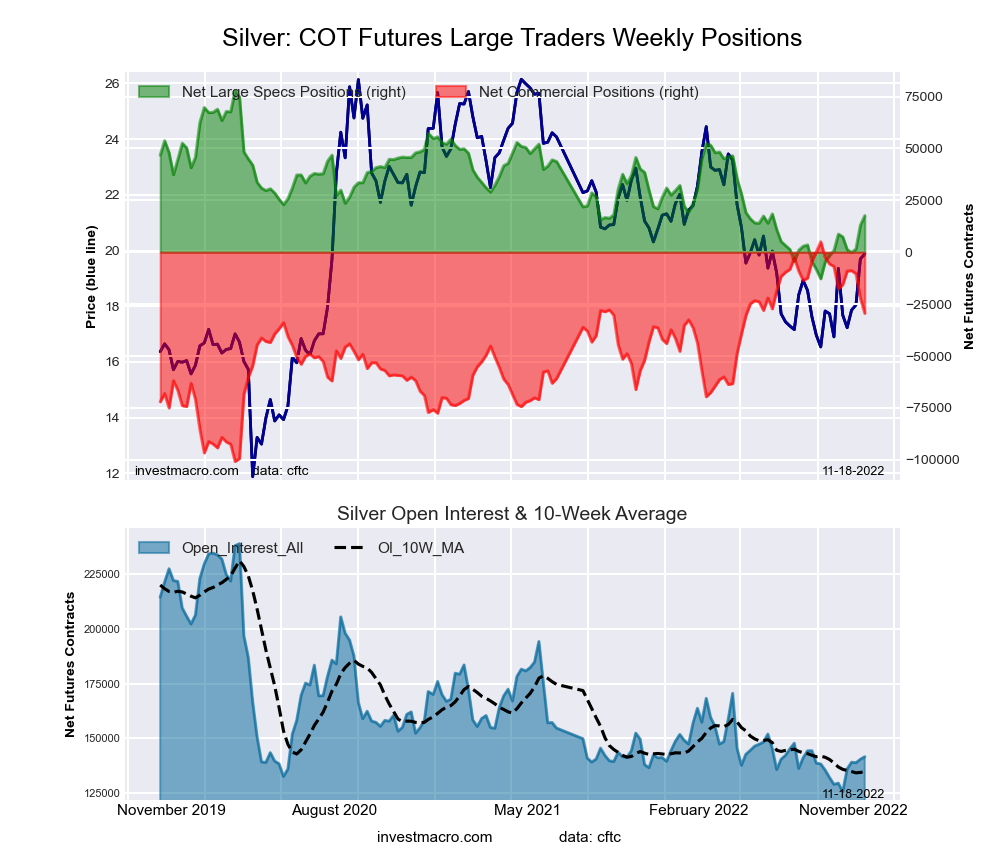
Highlighting the COT metals data this week is the increasing bullishness of Silver positions. The large speculator position in Silver futures rose this week for a second straight week and for the fifth time out of the past six weeks. Speculator bets have now risen by a total of +19,309 contracts over these past six weeks, going from a total of -101 contracts on October 25th to a total of +19,208 contracts this week. The recent gains have now positioned the speculator standing at its highest level since May 10th, a span of 30 weeks.
The Silver futures price has been on the move as well with prices closing out the week at $23.71. This is the highest weekly close for Silver since April and Silver is now up by over +30 percent since bottoming at the beginning of September.
| Dec-06-2022 | OI | OI-Index | Spec-Net | Spec-Index | Com-Net | COM-Index | Smalls-Net | Smalls-Index |
|---|---|---|---|---|---|---|---|---|
| WTI Crude | 1,436,728 | 3 | 231,720 | 6 | -259,553 | 94 | 27,833 | 45 |
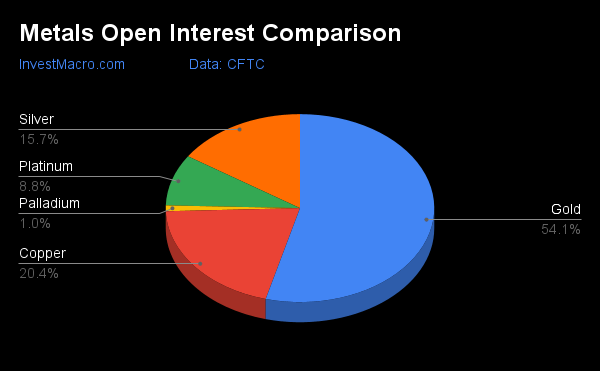
| Gold | 422,100 | 0 | 115,125 | 21 | -130,079 | 79 | 14,954 | 17 |
| Silver | 122,558 | 1 | 19,208 | 35 | -32,262 | 65 | 13,054 | 33 |
| Copper | 158,762 | 9 | 1,679 | 38 | -4,354 | 64 | 2,675 | 41 |
| Palladium | 7,785 | 9 | -1,372 | 16 | 1,226 | 81 | 146 | 50 |
| Platinum | 68,821 | 37 | 25,636 | 44 | -30,148 | 58 | 4,512 | 29 |
| Natural Gas | 1,010,479 | 11 | -164,037 | 29 | 135,606 | 74 | 28,431 | 48 |
| Brent | 144,147 | 7 | -28,118 | 64 | 23,746 | 33 | 4,372 | 68 |
| Heating Oil | 257,158 | 19 | 22,828 | 76 | -39,506 | 29 | 16,678 | 56 |
| Soybeans | 622,200 | 11 | 89,661 | 38 | -59,882 | 71 | -29,779 | 21 |
| Corn | 1,232,307 | 1 | 198,375 | 55 | -157,536 | 49 | -40,839 | 20 |
| Coffee | 203,296 | 14 | -14,642 | 2 | 12,907 | 98 | 1,735 | 24 |
| Sugar | 881,388 | 34 | 183,124 | 57 | -226,066 | 38 | 42,942 | 61 |
| Wheat | 334,760 | 21 | -39,897 | 0 | 42,820 | 100 | -2,923 | 95 |
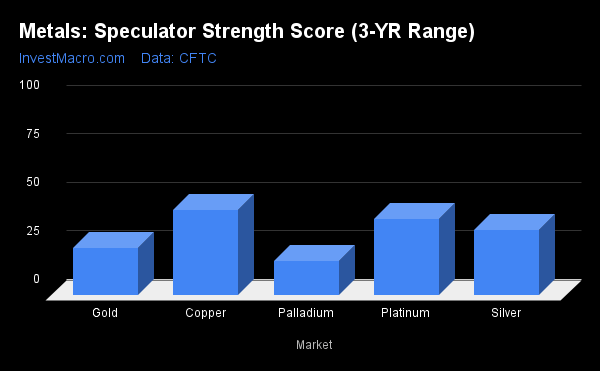
Strength Scores led by Platinum & Copper
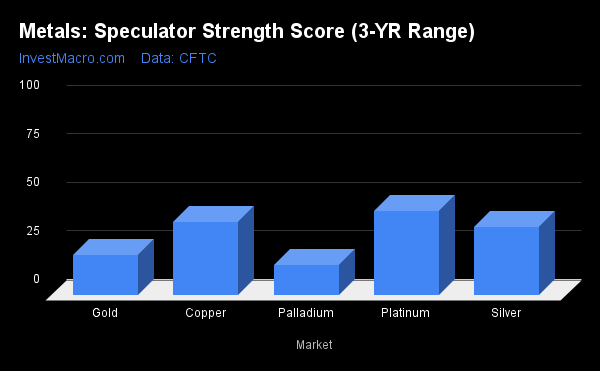
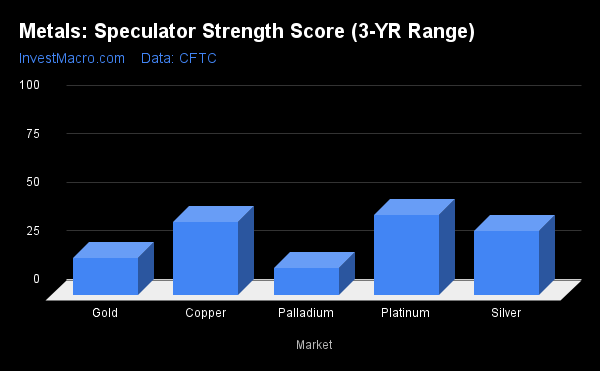
Strength scores (a measure of the 3-Year range of Speculator positions, from 0 to 100 where above 80 is extreme bullish and below 20 is extreme bearish) showed that Platinum (43.6 percent) and Copper (37.7 percent) lead the metals category this week. Silver (35.3 percent) and then Gold (20.9 percent) comes in as the next highest metals market in strength scores.
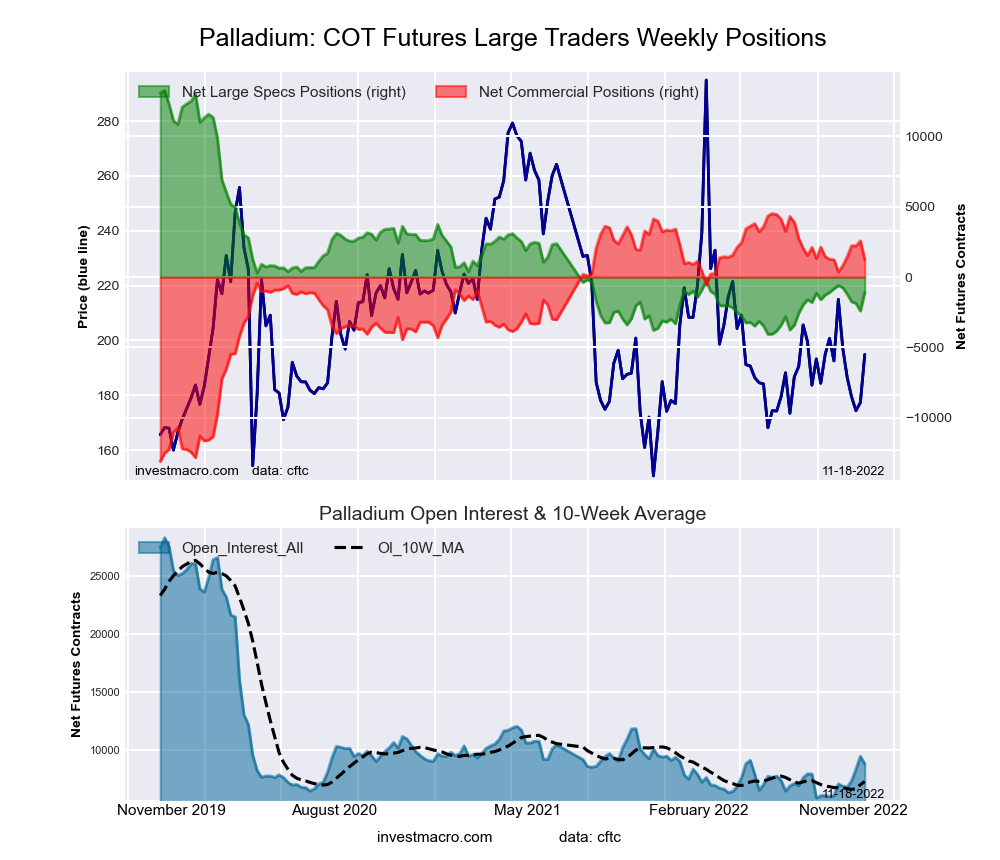
On the downside, Palladium (15.7 percent) is at the lowest strength level currently and is in an Extreme-Bearish level below 20 percent.
Strength Statistics:
Gold (20.9 percent) vs Gold previous week (19.2 percent)
Silver (35.3 percent) vs Silver previous week (33.4 percent)
Copper (37.7 percent) vs Copper previous week (37.9 percent)
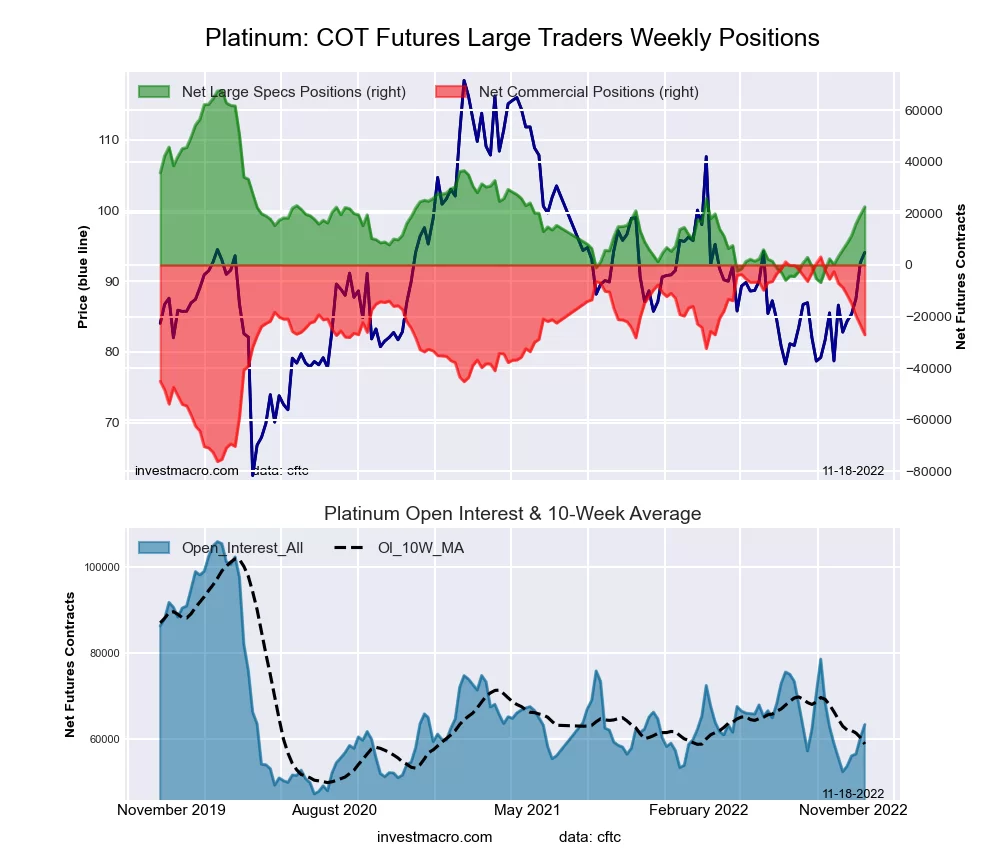
Platinum (43.6 percent) vs Platinum previous week (41.7 percent)
Palladium (15.7 percent) vs Palladium previous week (14.2 percent)
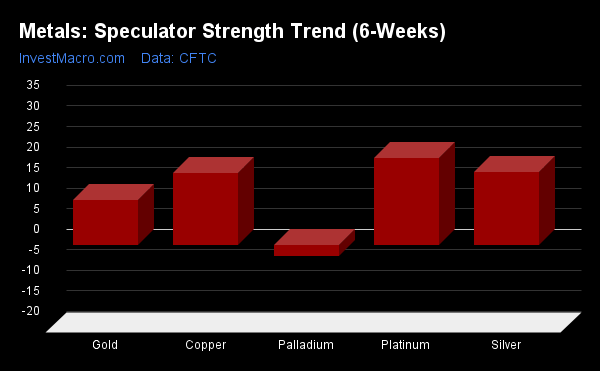
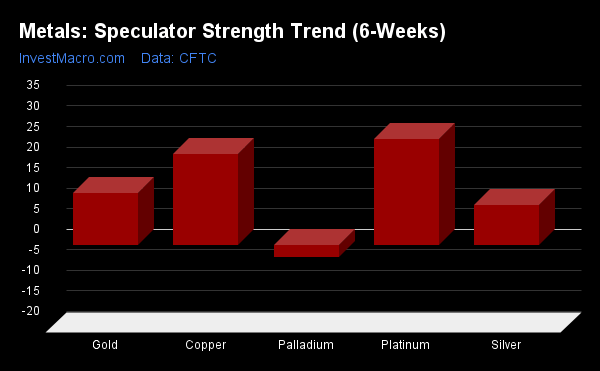
Silver & Platinum tops Strength Trends
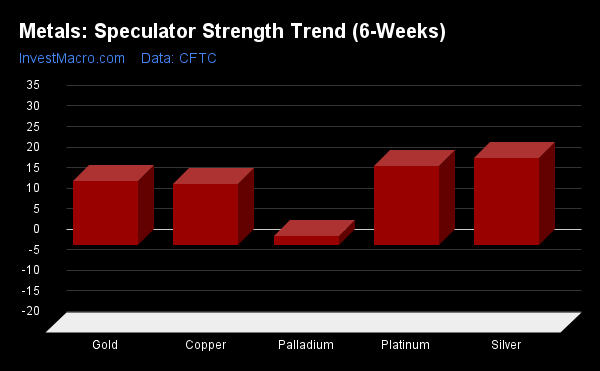
Strength Score Trends (or move index, calculates the 6-week changes in strength scores) showed that all metals markets were positive movers this week. Silver (21.3 percent) leads the past six weeks trends for metals. Platinum (19.2 percent), Gold (15.6 percent), Copper (14.8 percent) and Palladium (2.2 percent) fill out the positive movers in the latest trends data.
Move Statistics:
Gold (15.6 percent) vs Gold previous week (11.0 percent)
Silver (21.3 percent) vs Silver previous week (17.9 percent)
Copper (14.8 percent) vs Copper previous week (17.7 percent)
Platinum (19.2 percent) vs Platinum previous week (21.2 percent)
Palladium (2.2 percent) vs Palladium previous week (-2.5 percent)
Individual Markets:
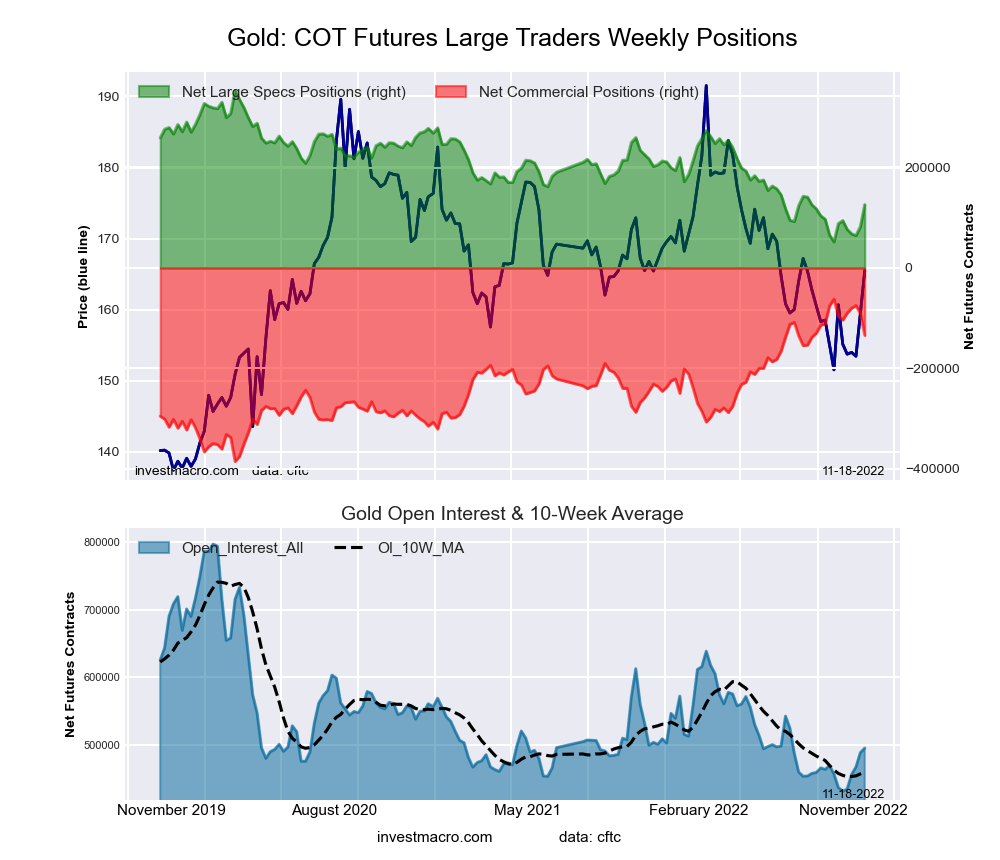
Gold Comex Futures:
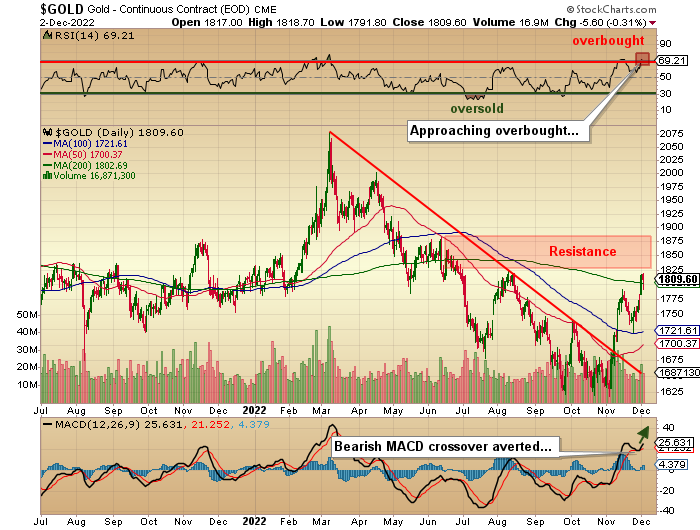
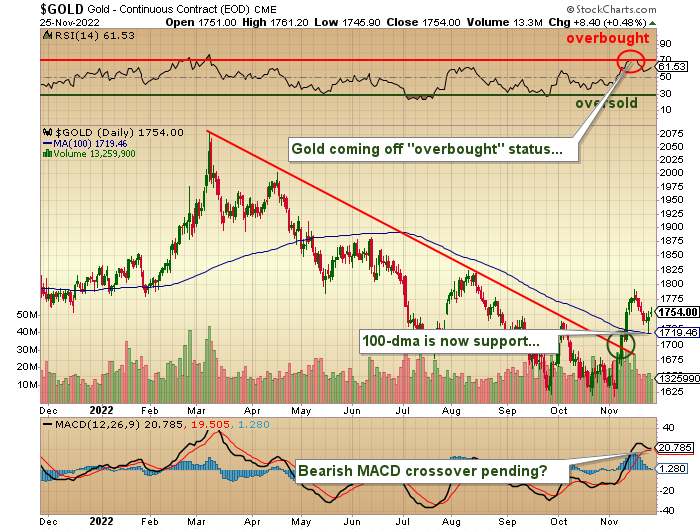
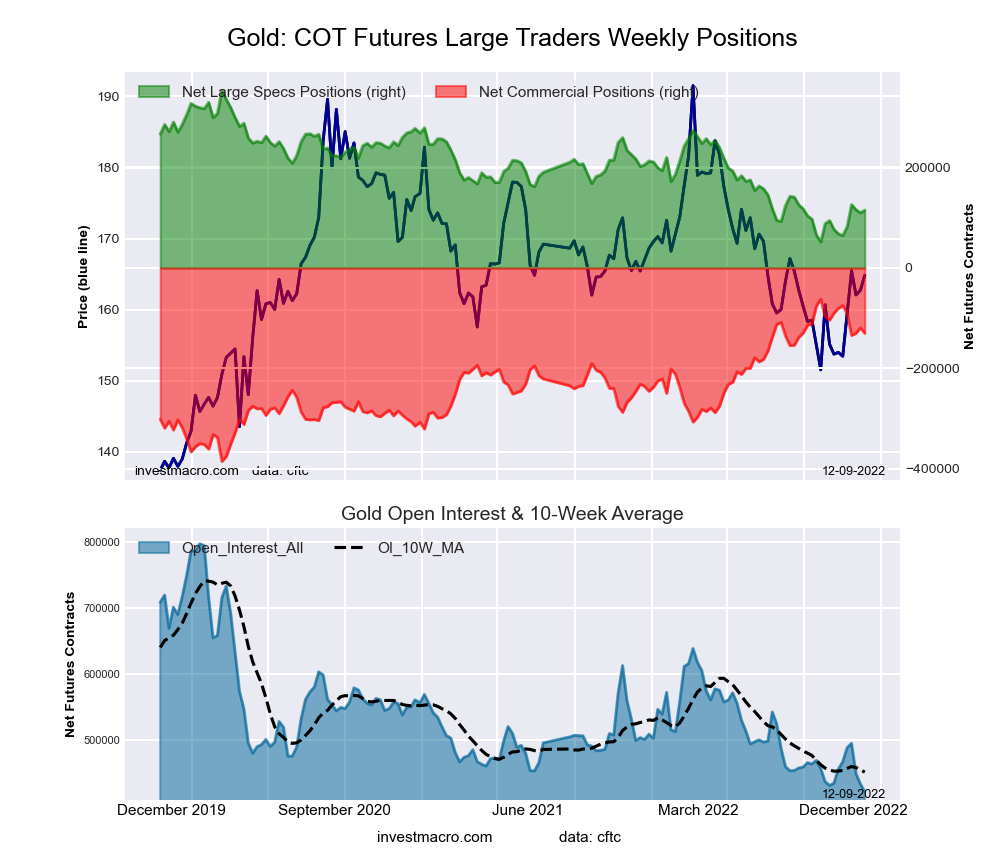 The Gold Comex Futures large speculator standing this week reached a net position of 115,125 contracts in the data reported through Tuesday. This was a weekly boost of 5,122 contracts from the previous week which had a total of 110,003 net contracts.
This week’s current strength score (the trader positioning range over the past three years, measured from 0 to 100) shows the speculators are currently Bearish with a score of 20.9 percent. The commercials are Bullish with a score of 79.0 percent and the small traders (not shown in chart) are Bearish-Extreme with a score of 17.4 percent.
| Gold Futures Statistics | SPECULATORS | COMMERCIALS | SMALL TRADERS |
| – Percent of Open Interest Longs: | 50.1 | 27.9 | 9.0 |
| – Percent of Open Interest Shorts: | 22.8 | 58.7 | 5.4 |
| – Net Position: | 115,125 | -130,079 | 14,954 |
| – Gross Longs: | 211,472 | 117,578 | 37,785 |
| – Gross Shorts: | 96,347 | 247,657 | 22,831 |
| – Long to Short Ratio: | 2.2 to 1 | 0.5 to 1 | 1.7 to 1 |
| NET POSITION TREND: | |||
| – Strength Index Score (3 Year Range Pct): | 20.9 | 79.0 | 17.4 |
| – Strength Index Reading (3 Year Range): | Bearish | Bullish | Bearish-Extreme |
| NET POSITION MOVEMENT INDEX: | |||
| – 6-Week Change in Strength Index: | 15.6 | -15.4 | 7.0 |
Silver Comex Futures:
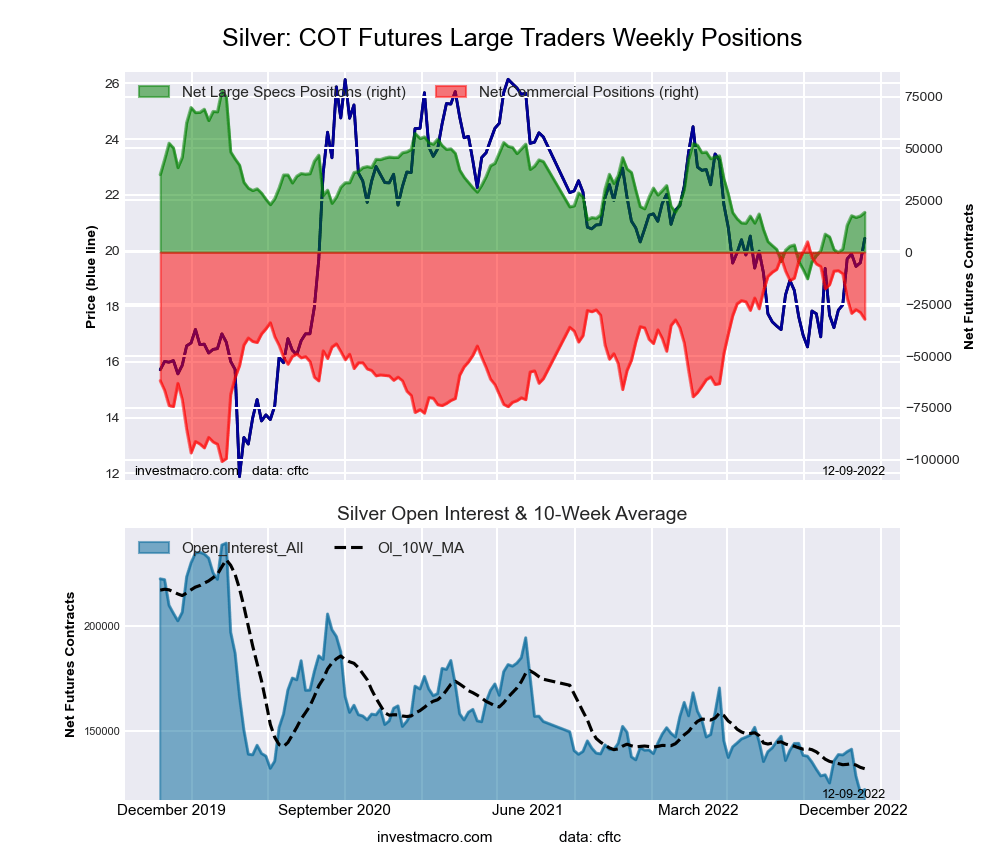 The Silver Comex Futures large speculator standing this week reached a net position of 19,208 contracts in the data reported through Tuesday. This was a weekly lift of 1,725 contracts from the previous week which had a total of 17,483 net contracts.
This week’s current strength score (the trader positioning range over the past three years, measured from 0 to 100) shows the speculators are currently Bearish with a score of 35.3 percent. The commercials are Bullish with a score of 64.7 percent and the small traders (not shown in chart) are Bearish with a score of 33.4 percent.
| Silver Futures Statistics | SPECULATORS | COMMERCIALS | SMALL TRADERS |
| – Percent of Open Interest Longs: | 39.9 | 36.5 | 19.3 |
| – Percent of Open Interest Shorts: | 24.3 | 62.8 | 8.6 |
| – Net Position: | 19,208 | -32,262 | 13,054 |
| – Gross Longs: | 48,954 | 44,757 | 23,648 |
| – Gross Shorts: | 29,746 | 77,019 | 10,594 |
| – Long to Short Ratio: | 1.6 to 1 | 0.6 to 1 | 2.2 to 1 |
| NET POSITION TREND: | |||
| – Strength Index Score (3 Year Range Pct): | 35.3 | 64.7 | 33.4 |
| – Strength Index Reading (3 Year Range): | Bearish | Bullish | Bearish |
| NET POSITION MOVEMENT INDEX: | |||
| – 6-Week Change in Strength Index: | 21.3 | -22.1 | 19.7 |
Copper Grade #1 Futures:
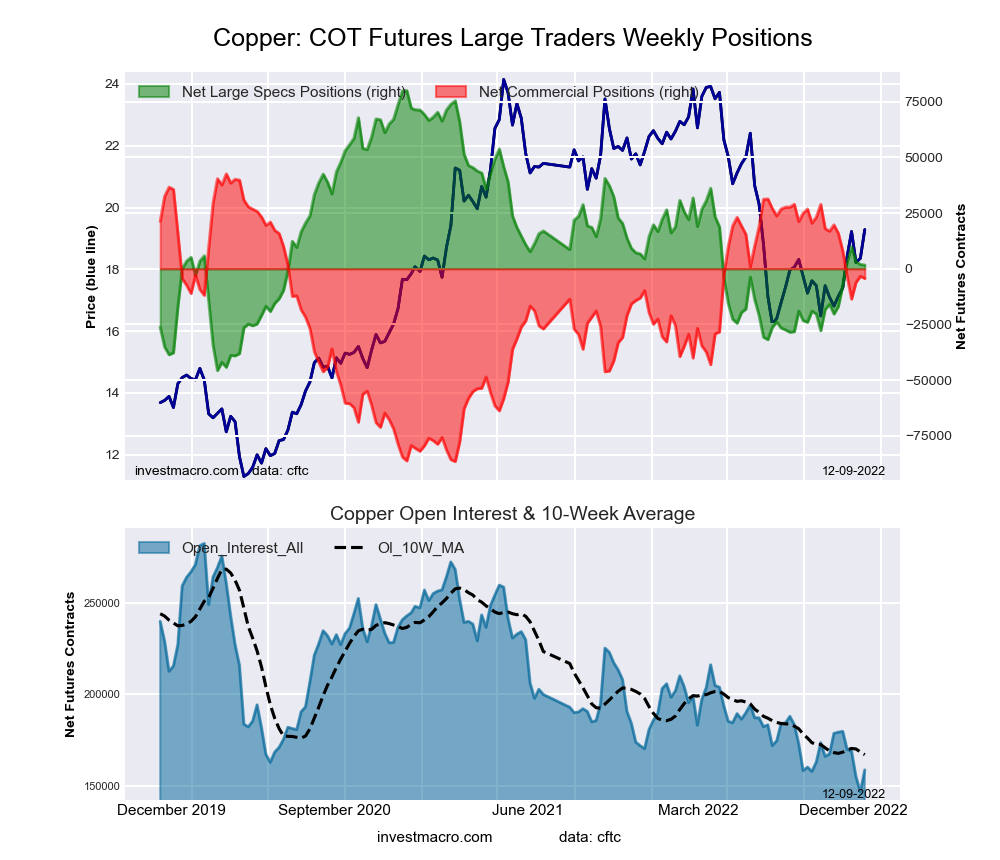 The Copper Grade #1 Futures large speculator standing this week reached a net position of 1,679 contracts in the data reported through Tuesday. This was a weekly reduction of -305 contracts from the previous week which had a total of 1,984 net contracts.
This week’s current strength score (the trader positioning range over the past three years, measured from 0 to 100) shows the speculators are currently Bearish with a score of 37.7 percent. The commercials are Bullish with a score of 63.6 percent and the small traders (not shown in chart) are Bearish with a score of 40.8 percent.
| Copper Futures Statistics | SPECULATORS | COMMERCIALS | SMALL TRADERS |
| – Percent of Open Interest Longs: | 35.0 | 41.8 | 9.7 |
| – Percent of Open Interest Shorts: | 33.9 | 44.5 | 8.0 |
| – Net Position: | 1,679 | -4,354 | 2,675 |
| – Gross Longs: | 55,496 | 66,286 | 15,368 |
| – Gross Shorts: | 53,817 | 70,640 | 12,693 |
| – Long to Short Ratio: | 1.0 to 1 | 0.9 to 1 | 1.2 to 1 |
| NET POSITION TREND: | |||
| – Strength Index Score (3 Year Range Pct): | 37.7 | 63.6 | 40.8 |
| – Strength Index Reading (3 Year Range): | Bearish | Bullish | Bearish |
| NET POSITION MOVEMENT INDEX: | |||
| – 6-Week Change in Strength Index: | 14.8 | -15.7 | 9.6 |
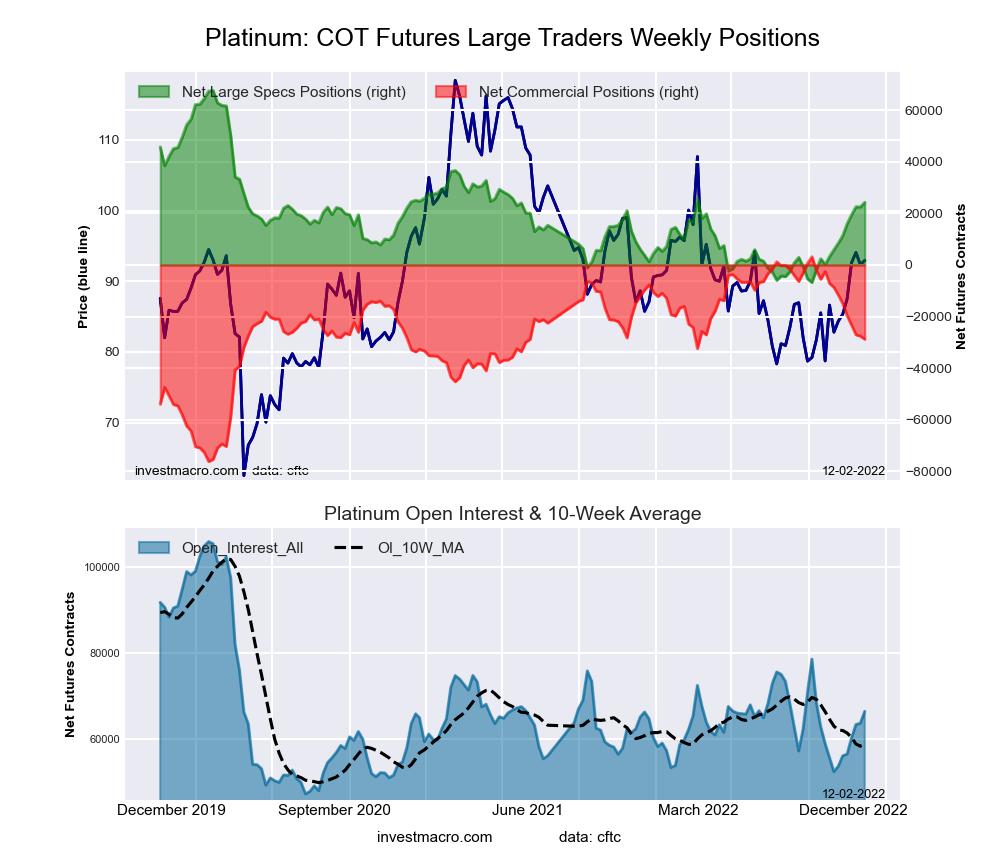
Platinum Futures:
 The Platinum Futures large speculator standing this week reached a net position of 25,636 contracts in the data reported through Tuesday. This was a weekly lift of 1,377 contracts from the previous week which had a total of 24,259 net contracts.
This week’s current strength score (the trader positioning range over the past three years, measured from 0 to 100) shows the speculators are currently Bearish with a score of 43.6 percent. The commercials are Bullish with a score of 58.0 percent and the small traders (not shown in chart) are Bearish with a score of 28.6 percent.
| Platinum Futures Statistics | SPECULATORS | COMMERCIALS | SMALL TRADERS |
| – Percent of Open Interest Longs: | 53.3 | 29.1 | 10.6 |
| – Percent of Open Interest Shorts: | 16.1 | 72.9 | 4.1 |
| – Net Position: | 25,636 | -30,148 | 4,512 |
| – Gross Longs: | 36,693 | 20,025 | 7,324 |
| – Gross Shorts: | 11,057 | 50,173 | 2,812 |
| – Long to Short Ratio: | 3.3 to 1 | 0.4 to 1 | 2.6 to 1 |
| NET POSITION TREND: | |||
| – Strength Index Score (3 Year Range Pct): | 43.6 | 58.0 | 28.6 |
| – Strength Index Reading (3 Year Range): | Bearish | Bullish | Bearish |
| NET POSITION MOVEMENT INDEX: | |||
| – 6-Week Change in Strength Index: | 19.2 | -19.1 | 12.3 |
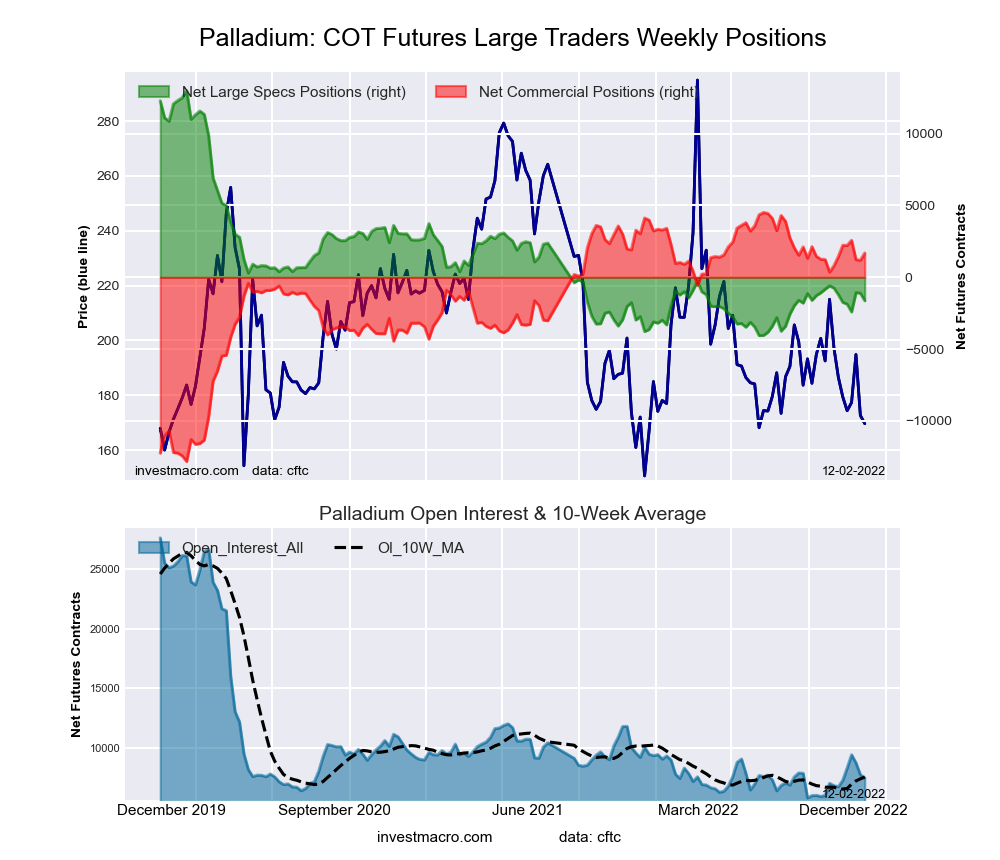
Palladium Futures:
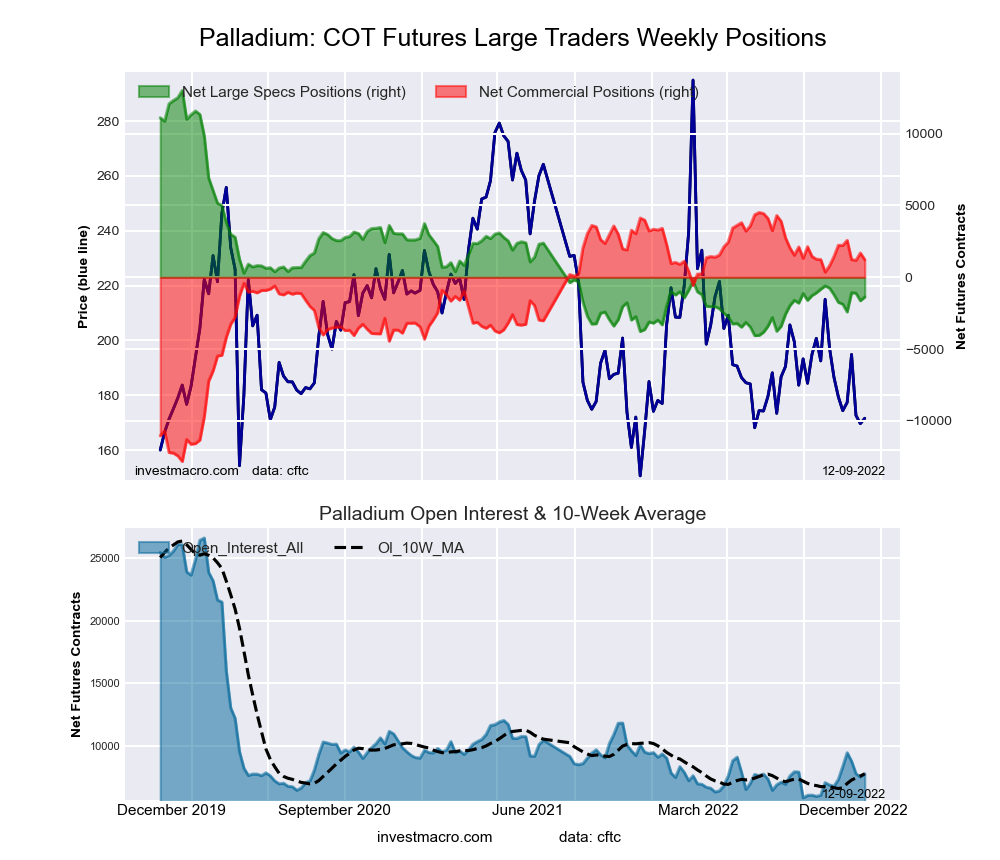 The Palladium Futures large speculator standing this week reached a net position of -1,372 contracts in the data reported through Tuesday. This was a weekly boost of 259 contracts from the previous week which had a total of -1,631 net contracts.
This week’s current strength score (the trader positioning range over the past three years, measured from 0 to 100) shows the speculators are currently Bearish-Extreme with a score of 15.7 percent. The commercials are Bullish-Extreme with a score of 81.1 percent and the small traders (not shown in chart) are Bullish with a score of 50.5 percent.
| Palladium Futures Statistics | SPECULATORS | COMMERCIALS | SMALL TRADERS |
| – Percent of Open Interest Longs: | 31.6 | 49.8 | 14.9 |
| – Percent of Open Interest Shorts: | 49.2 | 34.0 | 13.0 |
| – Net Position: | -1,372 | 1,226 | 146 |
| – Gross Longs: | 2,460 | 3,875 | 1,157 |
| – Gross Shorts: | 3,832 | 2,649 | 1,011 |
| – Long to Short Ratio: | 0.6 to 1 | 1.5 to 1 | 1.1 to 1 |
| NET POSITION TREND: | |||
| – Strength Index Score (3 Year Range Pct): | 15.7 | 81.1 | 50.5 |
| – Strength Index Reading (3 Year Range): | Bearish-Extreme | Bullish-Extreme | Bullish |
| NET POSITION MOVEMENT INDEX: | |||
| – 6-Week Change in Strength Index: | 2.2 | -5.8 | 37.8 |
Article By InvestMacro – Receive our weekly COT Newsletter
*COT Report: The COT data, released weekly to the public each Friday, is updated through the most recent Tuesday (data is 3 days old) and shows a quick view of how large speculators or non-commercials (for-profit traders) were positioned in the futures markets.
The CFTC categorizes trader positions according to commercial hedgers (traders who use futures contracts for hedging as part of the business), non-commercials (large traders who speculate to realize trading profits) and nonreportable traders (usually small traders/speculators) as well as their open interest (contracts open in the market at time of reporting). See CFTC criteria here.


 Graphene has many incredible physical properties that arise from its one-atom-thick carbon structure.


