Archive for Metals – Page 32

Canadian Exploration Co. Bullish on Global Tellurium Demand

Source: Streetwise Reports  (2/16/23)

First Tellurium Corp. sees increased tellurium production in a bid to meet rising global demand in 2023.

First Tellurium Corp. (FTEL:CSE) is expecting global demand and prices of tellurium (Te) to increase this year, therefore also seeing bright prospects for its Te production from its Deer Horn property in British Columbia, Canada.

FTEL is a company engaging in the exploration and development of predominantly Te mines. The company has two high-grade mining jurisdictions, which are its Deer Horn property in British Columbia, Canada, and Klondike property in Colorado, U.S.

Why Tellurium? Looming Shortage Driving Demand and Price Increases

Te is essential for the generation of clean and sustainable energy. It is a raw material for manufacturing solar photovoltaic (PV) panels, new batteries, and other advancing technologies.

Te is incorporated in lithium-ion battery cathodes, and this improves the batteries’ energy density for longer-lasting charging; enhanced electrical conductivity for quicker charging time; and safety. For solar panels, Te provides better conductivity, making a thin film efficiently absorb sunlight and convert it into electricity.

Source: First Tellurium

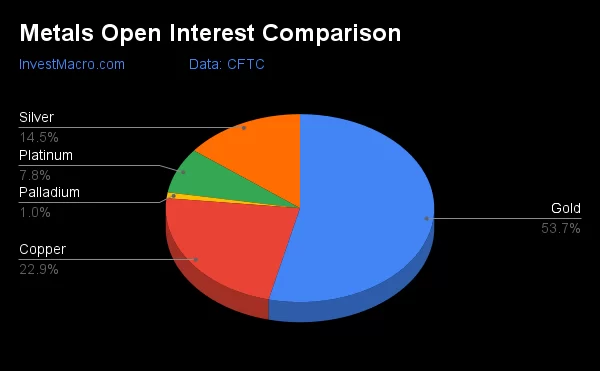
FTEL President and CEO Tyrone Docherty said 90% of Te comes from refining copper, and only 10% comes from mines. The company said there is a looming shortage of Te as the demand is rapidly growing, but much of the supply is not mined on its own.

He said FTEL is well positioned to increase the share of mining in Te production and to meet the increasingly growing demand for Te, which mostly comes from the clean energy sector.

According to a report by Investing Whisperer, other than sourcing through copper processing, Te is a rare and brittle metalloid element found in small quantities in the Earth’s crust — about eight times rarer than gold itself. As the demand from solar panel manufacturers grows, Te production is seen to shoot up in the near future.

“It’s possible that the market for Te could be much larger in the near-to-mid term–due to the increased use of solar panels. Right now, it’s a very small market with just under 600,000 kg produced in 2021,” the report said.

China has 20% of the world’s Te resource and has produced most (61%) of the global Te output last year. Responding to the looming shortage fears and bright prospects in terms of demand, the U.S. wants to get a larger share of the pie — to see more domestic supply chains of Te which denotes an increase in delivery from U.S. suppliers like FTEL.

Chen Lin of What is Chen Buying? What is Chen Selling? recommended FTEL in a December posting. He mentioned that North America is too dependent on outside sources for the element and went on to say, “This metal can be in demand, this is a pure-play, and management just a lot of (its) own money in the stock.” Lin later reiterated his recommendation in a February newsletter.  He said, “FTEL was very well received at both the Metals Investment Forum and Vancouver Resource Investment Conference. The management was surrounded by investors and talked for hours afterward. I think investors’ interests definitely picked up and there could be other newsletters recommending it.”

FTEL Answers Demand

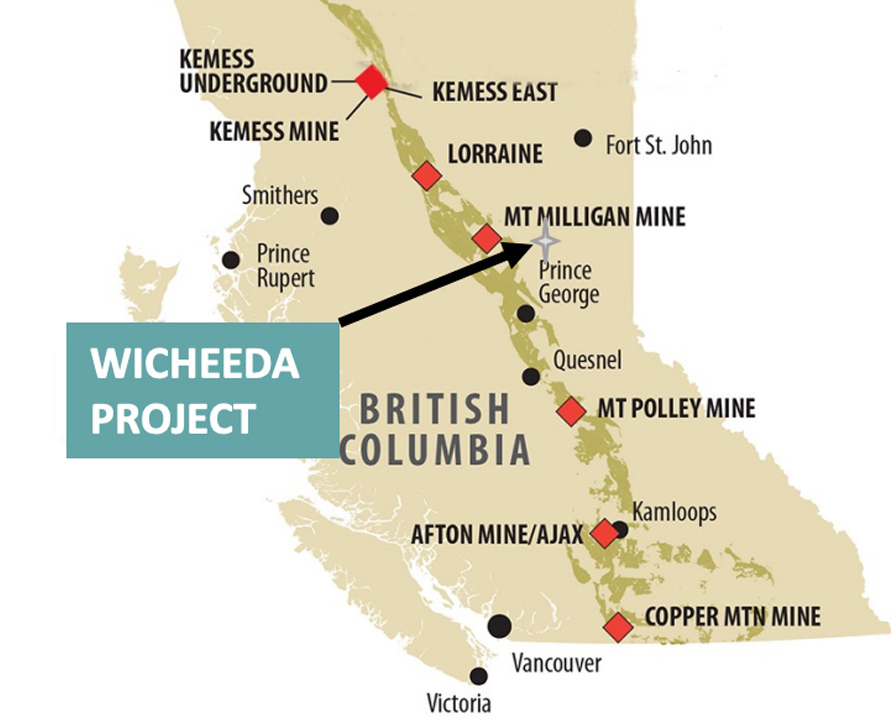
FTEL answers the demand for critical metals such as Te, Au, Ag, Cu, and W, with a focus on Te. Major U.S.-based solar PV manufacturer First Solar has recognized their Deer Horn property as one of the four world-class Te projects, with the other three located in Sichuan, China; Sonora, Mexico; and Boliden Area, Sweden.

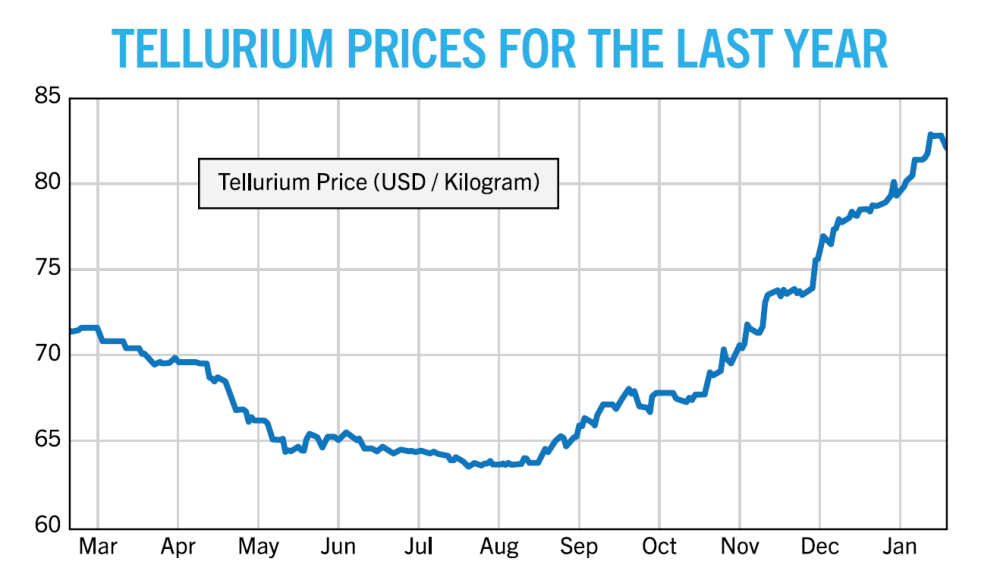
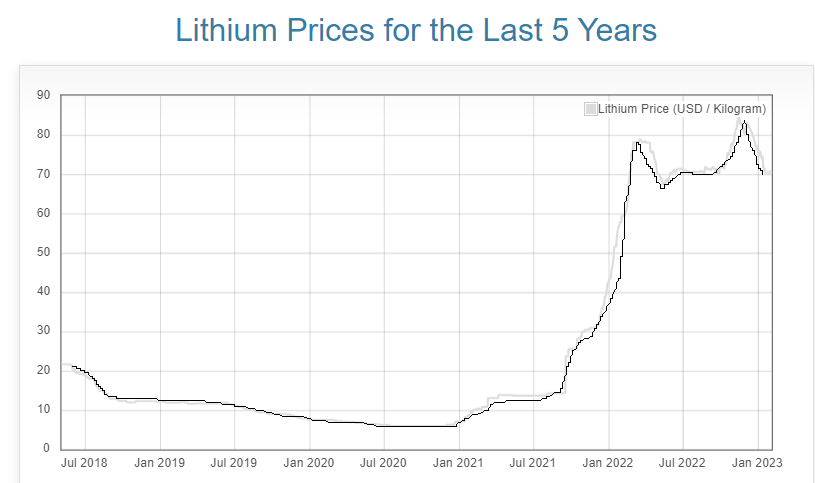
New Te supplies from the company will benefit as prices need to increase to meet Te demand. From a US$70 per kg price level a year ago, prices have already gone up to US$80 per kg as of January 2023. Its market price is expected to get a boost from First Solar as its annual Te demand could exceed last year’s Te global production by up to 70%.

The Deer Horn jurisdiction hosts the only Te, Au, and Ag resources in North America, and has also passed a positive PEA or Preliminary Economic Assessment, which is crucial for moving forward with any mining project.

Based on Investing Whisperer’s analysis, FTEL and its two mines with Te deposits close to the surface is the only Te play for investors.

The company adopts a phased expansion approach, where they start exploration and production with small mines, and then expand mining areas in the same territory over time.

The company benefits from this approach with lower exploration and development costs, lower capital spending, faster production and delivery of supplies, a faster-permitting process with small mine applications than larger mines, and many others.

FTEL’s exploration in 2022 extended their mineral zone potential in the Deer Horn property to an additional 1.1 km, expanding their total potential strike length to 3.5 km.

Based on Investing Whisperer’s analysis, FTEL and its two mines with Te deposits close to the surface is the only Te play for investors.

The report also factored in the prospect to expand these sites in the future, and that there are Au, Ag, Cu, and W deposits in the mines which can account for 50% of the company’s value.

The Catalyst: Drilling Set for the Summer

FTEL is set to start its drilling within its polymetallic Deer Horn site in the summer of 2023. This will yield new Te, Au, and Ag production for the company which will allow them to deliver supply this year.

The company will also greatly benefit from favorable market conditions such as the ongoing advances in battery technologies, and solar power demand, as well as the push for funding and focus on critical metals by the U.S. and Canadian governments.

EcoWatch mentioned that as the green energy technology sector grows, then so is the demand for Te and other critical metals which can have Te as a byproduct, given that 90% of global Te supply comes from refining copper mining. FTEL has two predominantly Te mines that can contribute to supporting the growth of green energy technologies.

Source: Clivemaund.com

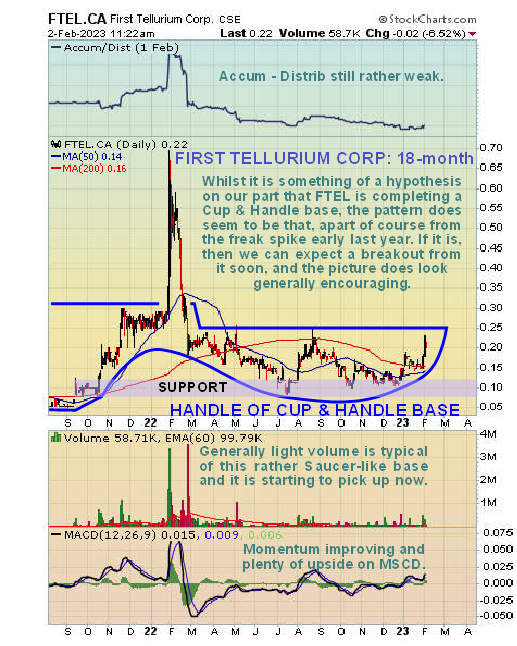
On February 2, 2023, technical analyst Clive Maund touched on the outlook of the company, saying, “First Tellurium presents a positive picture and overall looks like a low-risk setup. We, therefore, stay long.”

Ownership and Share Structure

Streetwise Ownership Overview*

First Tellurium Corp. (FTEL:CSE)

Retail: 89%
Management/Insiders: 11%
Institutions & Strategic Investors: 0%
89%
11%
*Share Structure as of 2/10/2023


According to the company, 11% of First Tellurium is owned by management and insiders. According to Reuters CEO, President, and Director Tyrone Docherty owns 10.50%m with 7.63 million shares. Director Josef Anthony Steve Fogarassy has 1.38%, with 1 million shares, and Director Lyle Allen Schwabe has 0.77%, with 0.56 million shares.

There are no institutional investors and the rest is retail.

FTEL has CA$1.5 million in the bank with a CA$35,000 to CA$40,000 monthly burn rate.

The company has a market cap of CA$23.37 million and 84.026 million outstanding shares. Their stock is trading between CA$0.085 and CA$0.710 based on its 52-week range.


Disclosures:
1) Nika Cataldo wrote this article for Streetwise Reports LLC as an independent contractor. She or members of her household own securities of the following companies mentioned in the article: None. She or members of her household are paid by the following companies mentioned in this article: None.

2) The following companies mentioned in this article are billboard sponsors of Streetwise Reports: None.  Click here for important disclosures about sponsor fees. As of the date of this article, an affiliate of Streetwise Reports has a consulting relationship with: First Tellurium Corp. Please click here for more information.

3) Statements and opinions expressed are the opinions of the author and not of Streetwise Reports or its officers. The author is wholly responsible for the validity of the statements. The author was not paid by Streetwise Reports for this article. Streetwise Reports was not paid by the author to publish or syndicate this article. Streetwise Reports requires contributing authors to disclose any shareholdings in, or economic relationships with, companies that they write about. Streetwise Reports relies upon the authors to accurately provide this information and Streetwise Reports has no means of verifying its accuracy.

4) This article does not constitute investment advice. Each reader is encouraged to consult with his or her individual financial professional and any action a reader takes as a result of information presented here is his or her own responsibility. By opening this page, each reader accepts and agrees to Streetwise Reports’ terms of use and full legal disclaimer. This article is not a solicitation for investment. Streetwise Reports does not render general or specific investment advice and the information on Streetwise Reports should not be considered a recommendation to buy or sell any security. Streetwise Reports does not endorse or recommend the business, products, services or securities of any company mentioned on Streetwise Reports.

5) From time to time, Streetwise Reports LLC and its directors, officers, employees or members of their families, as well as persons interviewed for articles and interviews on the site, may have a long or short position in securities mentioned. Directors, officers, employees or members of their immediate families are prohibited from making purchases and/or sales of those securities in the open market or otherwise from the time of the decision to publish an article until three business days after the publication of the article. The foregoing prohibition does not apply to articles that in substance only restate previously publish First Tellurium Corp., a company mentioned in this article.

Electrified Excitement

Source: Michael Ballanger  (2/6/23)

Michael Ballanger of GGM Advisory Inc. reviews updates within the metals and energy sectors, focusing on some key companies he believes you should take a look at.

In a couple of weeks, I will be defying the accuracy of the actuarial studies by making that fateful transition from sexagenarian to septuagenarian while continuing to shovel winter snow and taking eight-kilometer walks most mornings (when it isn’t –20 C). Being a resident of this “little blue dot,” as Carl Sagan refers to our planet, for seven decades means that I have more than a few memories to recount and more than a few stories to tell.

With that comes an ample helping of regrets of both personal and career origins, but those are offset by the sweet memories of family, friends, and fortuitous events that have been integral to a magnificent journey through time.

One of the most underrated aspects of aging is that trials and tribulations that would have escalated blood pressure when I was in my thirties no longer make a dent in the stress meter, while conversely, considerate gestures and flatteries deemed unremarkable in youth are greatly appreciated in later years.

Humanity has mined about 700 million tonnes of copper to date. The problem is the need to mine that same amount in the next 22 years to keep up with the deepening green energy transition.”

— Robert Friedland, Billionaire mining entrepreneur

Most members of the Boomer Generation can tell you where they were and what they were doing when JFK was gunned down in 1963, where they were in 2001 when the Twin Towers came down, and for residents of former Czechoslovakia, Hungary, Afghanistan, and Ukraine, they will never be able to forget the day the Russian tanks crossed their borders.

Over the past seventy years, there have been far too many instances where political ambition causing pain and suffering was allowed to exert itself within societies and populations, but from my perspective, be it world wars or regional skirmishes, it is always the misguided intentions of politicians that lie as the root of these evils. Left to their own devices, humans, by and large, have learned how to survive together. For centuries upon centuries, homo sapiens have learned to join arms and raise crops, buildings, and families largely absent the horrors of war, especially when they are insulated from the insidious narcotic that accompanies political ambition.

When I sit down at night and listen to speakers like Robert Friedland speak about the future of the global mining industry with specific reference to electrification, I am emboldened that a powerful and highly-influential billionaire entrepreneur like this can offer such a concise vision of the world. Friedland was recently the keynote speaker at the Future Minerals Forum in Riyadh, Saudi Arabia, where he presented the case for “responsible mining” in the quest to provide sufficient quantities of minerals required to implement the global initiative for electrification.

Copper

Included in his remarks were specific mentions of copper, a maidenhead mineral for this publication as well as the suite of minerals used in batteries.

To have a crusty old billionaire boomer take such an active role in the promotion of “responsible mining” crucial to ending mankind’s reliance on fossil fuels is encouraging. Furthermore, to have the greatest promoter that I have ever watched take up the cause in speaking to Heads of State around the globe is exciting. It is also important to understand that the Friedland flagship company, Ivanhoe Mines, is a part owner (39.8%) of Kamoa-Kakula Copper Mine, the world’s fourth-largest but highest-grade copper mine, the Kamoa-Kakula located in the Congo.

With that in mind, please do not get the mistaken impression that I imply that Friedland has been suddenly motivated by altruistic empowerment in place of greed. Taking up the cause of electrification plays beautifully into the future fate of Ivanhoe, and that he now has subsidiary companies Ivanhoe Electric and Cabot Energy exploring opportunities in battery metals and lithium deposits infers a vertical integration for all things that will require an ample Friedland mineral supply, a talent of which he is most certainly capable, gifted, and blessed.

I am certain that if his Electrification Swan Song turns out to be a roaring success, we will have US$8.00/lb. copper and US$500,000/mt lithium, one will find not only a shining halo in the Friedland war chest but also a brand new currency calculator as well. And that’s just fine because there is no motivation better in “building things better” than capitalist aspirations, which include fame and respect along with copious profits. Hence the term “Master Friedland.”

The BLS came out on Friday with the most absurdly-manufactured statistic in economic history with the staggering news that the U.S. economy created more jobs in the December reporting period than median estimates were forecasting. Estimated to be in the 187,000 “new jobs” range, the number came in at 517,000, a 2.76 times your money “beat” that sent everything into the ash can except, of course, the yield on the 10-year treasury, which spiked up 4% to the 3.519% level.

Gold

Notwithstanding that, I absolutely guarantee major revisions with the next report to have such a reaction in the precious metals markets reeked of one thing — shenanigans. No good, rotten, lousy, nefarious, and totally nauseating shenanigans. The gold market has advanced for the past year during a period where yields essentially tripled, so even when Jay Powell threw a number of half-point rate increases at the capital markets, gold absorbed the event because job growth was not the driving force behind gold prices.

The pundits claimed that the shock in the jobs report would see the Fed having conniptions over the inflationary ramifications of the tight employment scene, but what they all forget is that the cost of servicing the U.S. debt bomb is approaching US$1 trillion per year and there comes a point in time where the U.S. currency begins to take the brunt of the credibility gap where foreign investors begin to focus not on the return ON investment but rather the return OF investment before they write a cheque.

In my view, all that has happened is an overreaction to the overbought condition that I spoke of earlier in the week to my subscribers. Using the gold bullion ETF SPDR Gold Trust (GLD:NYSEARCA) as a trading and charting tool, the big resistance band from late December in the US$170-175 range is now supported after prices escaped the range in January.

We also got a golden cross with the 50-DMA moving above the 200-DMA last month, putting all the technical conditions on buy signals until Wednesday, when we got a bearish MACD crossover constituting a short-term sell signal. As a result, we now have a large gap in the chart between US$175 and US$178 that will get filled in probably sometime next week into a rally.

RSI has moved a massive 25 points in two trading sessions, moving from over 70 (overbought) to under 45, placing it firmly in neutral now, and if we get further weakness early next week, GLD could actually be approaching oversold status in what is surely one of the quickest overbought-oversold transitions in history which – AGAIN — reeks of shenanigans.

Flipping over to spot gold, I maintain my price objective at US$2,250-2,350 in 2023, with the HUI dancing through 350 by year-end. The reasons I own gold and silver do not include a phony interpretation of employment data conjured up and delivered by ambitious bureaucrats with highly-politicized agendas. US$1,850 spot gold or US$170-171 on the GLD:US and I back up the Ram.

Lithium

Up until a few years ago, I had never come across any resource opportunity that involved the exploration for or development and/or production of lithium. However, given the heat behind the lithium juniors back in 2018, I felt obliged to attempt to bring myself up-to-speed on that market but since its pricing structure was thoroughly dominated by China, I elected to give it a pass.

Then a few weeks back, I was discussing the state of the junior resource market with an Australian colleague who proceeded to show me the chart patterns of several West Australia junior lithium plays, at which point I nearly fell over.

One of them, Patriot Battery Metals Inc. (PMET:CA) traded at CA$0.21 in late-2021, which I thought deserved mention in last week’s weekly missive as it closed over CA$10 per share.

Then with the weekend news that General Motors was investing US$650 million into Lithium Americas Corp. (LAC:TSX; LAC:NYSE) to assist in the development of the Nevada-based Thacker Pass lithium deposit, every lithium stock on the board went into full liftoff mode with PMET closing up another 60% for the week.

Accordingly, without delay, I launched into a crash course on lithium, ever fearful that I was tempting fate by charging into a market already well-exploited by stock jockeys from Perth, Australia, to Spokane, Washington. What I discovered was a commodity that was on the verge of a massive shortage situation, and despite the 20% correction in lithium prices since last November, demand for the lithium-ion batteries used in every electric vehicle currently in production is going parabolic but with new supply still a few years out.

Lithium carbonate prices in China fell to CNY 472,500 per tonne in February, the lowest since June 2022 and over 20% down since their all-time high of CNY 600,000 in November, as stronger supply and expectations of lower demand drove industry players to bet on a market surplus this year. Added capacity pushed Chinese domestic production to soar by 89% year-on-year in December and by 32.5% in the whole of 2022 despite output cuts in lake-based smelters.

Additionally, top producer Australia projected global output of lithium carbonate equivalent to reach 915,000 tonnes in 2023, a 32% rise from 2022’s estimate. Meanwhile, electric vehicle sales in China are set to decline sharply after the world’s leading consumer stopped subsidies in the sector.

Lithium and its compounds have several industrial applications, including heat-resistant glass and ceramicslithium grease lubricants, flux additives for iron, steel, and aluminum production, lithium metal batteries, and lithium-ion batteries. These uses consume more than three-quarters of lithium production.

From the Wikipedia textbook: “Because of its relative nuclear instability, lithium is less common in the solar system than 25 of the first 32 chemical elements even though its nuclei are very light: it is an exception to the trend that heavier nuclei are less common.” What that implies is that there is not a great deal of naturally-occurring lithium in nature, so it would stand to reason that dependable resources of lithium concentrate will be in high demand, thus giving junior developers a first-mover advantage if they have had the vision to lock down said resources.

To be sure that I was going to avoid the agony of “Bag Holder Blues,” an affliction suffered by “Last Minute Louie’s” that enter a hot market at or near the top, I did some digging and discovered that not only has Bank of America placed Sigma Lithium Corp. (SGML:TSXV;SGML:US) on its list of “50 Stocks for 10 Scarcity Themes”, a group of automobile manufacturers including BMW, Daimler-Benz, and Volkswagen have entered into an agreement with Chilean-based “Responsible Lithium Partnership” group with a view to developing the Salar de Atacama salt flat. There are two distinct takeaways from this information.

  • Large, multi-billion dollar companies with global presences are investing in lithium projects on both the industrial-usage level and the investment banking level, and
  • To have a TSX Venture exchange resource developer trading at CA$40 (SGML:TSXV) is uncanny, but it clearly illustrates the appetite for and opportunity surrounding junior lithium developers.

Two weeks ago, I mentioned Allied Copper Corp. (CPR:TSX.V; CPRRF:OTCQB), trading at CA$0.135 after their recent acquisition of Volt Lithium Corp. As the name change will go into effect next week, it was fitting that they announced the termination of the Klondike copper deal in Colorado as evidence that their working capital position is going to be dedicated to the Rainbow Lake Lithium project in Alberta.

The company is completing financing that has been upsized from CA$2m to CA$3m  in order to complete the construction of the pilot plant designed to test the economic viability of the process. Early testing confirmed a better-than-anticipated 93% recovery rate for the lithium carbonate, and it is expected to be duplicated after pilot plant completion.

CPR traded up to CA$0.30 to a new 52-week high on Wednesday before closing at CA0$.23 on a weekly volume of 1.88 million shares. Considering that the unit funding is being done at CA$0.20, the tape action has been nothing short of superb.

Once the deal closes, I see another big leg up as the post-financing market cap of US$22 million appears compelling relative to its peer group.

Michael Ballanger Disclaimer:

This letter makes no guarantee or warranty on the accuracy or completeness of the data provided. Nothing contained herein is intended or shall be deemed to be investment advice, implied or otherwise. This letter represents my views and replicates trades that I am making but nothing more than that. Always consult your registered advisor to assist you with your investments. I accept no liability for any loss arising from the use of the data contained on this letter. Options and junior mining stocks contain a high level of risk that may result in the loss of part or all invested capital and therefore are suitable for experienced and professional investors and traders only. One should be familiar with the risks involved in junior mining and options trading and we recommend consulting a financial adviser if you feel you do not understand the risks involved.

Disclosures:

1) Michael J. Ballanger: I, or members of my immediate household or family, own securities of the following companies mentioned in this article: All. I personally am, or members of my immediate household or family are, paid by the following companies mentioned in this article: My company, Bonaventure Explorations Ltd., has a consulting relationship with: None.

2) The following companies mentioned in this article are billboard sponsors of Streetwise Reports: None. Click here for important disclosures about sponsor fees. As of the date of this article, an affiliate of Streetwise Reports has a consulting relationship with: None. Please click here for more information.

3) Statements and opinions expressed are the opinions of the author and not of Streetwise Reports or its officers. The author is wholly responsible for the validity of the statements. The author was not paid by Streetwise Reports for this article. Streetwise Reports was not paid by the author to publish or syndicate this article. Streetwise Reports requires contributing authors to disclose any shareholdings in, or economic relationships with, companies that they write about. Streetwise Reports relies upon the authors to accurately provide this information and Streetwise Reports has no means of verifying its accuracy.

4) This article does not constitute investment advice. Each reader is encouraged to consult with his or her individual financial professional and any action a reader takes as a result of information presented here is his or her own responsibility. By opening this page, each reader accepts and agrees to Streetwise Reports’ terms of use and full legal disclaimer. This article is not a solicitation for investment. Streetwise Reports does not render general or specific investment advice and the information on Streetwise Reports should not be considered a recommendation to buy or sell any security. Streetwise Reports does not endorse or recommend the business, products, services or securities of any company mentioned on Streetwise Reports.

5) From time to time, Streetwise Reports LLC and its directors, officers, employees or members of their families, as well as persons interviewed for articles and interviews on the site, may have a long or short position in securities mentioned. Directors, officers, employees or members of their immediate families are prohibited from making purchases and/or sales of those securities in the open market or otherwise from the time of the decision to publish an article until three business days after the publication of the article. The foregoing prohibition does not apply to articles that in substance only restate previously published company releases.

As of the date of this article, officers and/or employees of Streetwise Reports LLC (including members of their household) own securities of Allied Copper Corp. and Lithium Americas Corp., companies mentioned in this article.


Gold and Inflation: Here’s a Market Myth

“If you believe in Gold as a consumer price inflation hedge then…”

By Elliott Wave International

Back in the days of the Roman Empire, an ounce of gold could buy a Roman a well-made toga, belt and finely crafted sandals.

In modern day Rome, lo and behold, a businessman can become sharply dressed via the value of that same ounce of gold.

So, yes, gold has maintained its store of value over the centuries.

However, in the relative short term — which can last years — gold may not be the inflation hedge that gold bugs believe it to be.

In a moment, I’ll show you how this relates to what’s going on with gold and inflation now. However, let’s first get insights from a chart and commentary from our February 2022 Global Market Perspective, which published when inflation was really getting going (The monthly Global Market Perspective is an Elliott Wave International publication which covers 50-plus global financial markets):

The chart shows the U.S. dollar price of Gold versus the annualized rate-of-change in the U.S. Consumer Price Index (CPI). If you believe in Gold as a consumer price inflation hedge then, as the CPI is accelerating, the Gold price should be advancing. The green shaded areas show that there have been five occasions since 1980 when the opposite was true, the last year being a good example. On the other side, the Gold-Inflation myth would allude to the price of Gold declining as CPI was decelerating. The grey shaded areas show five occasions since 1970 when this was not the case, 2007 to 2010 being a prime example.

Fast forward to today and we have these headlines:

  • US inflation eases grip on economy, falling for a 6th month (AP News, Jan. 23)
  • Inflation in U.S. could turn negative by midyear, says [this] billionaire investor … (MarketWatch, Jan. 28)

What’s happened to the price of gold? It’s steadily climbed in the face of easing inflation. Of course, this is just the opposite of what was occurring around this time last year. In both cases, the price of gold went in the opposite direction from what many would expect.

On Sept. 28, gold was trading at $1613.75 and has been in an overall uptrend since. The precious metal traded as high as $1949.46 on Jan. 26 (as of this writing on Jan. 30).

The bottom-line takeaway is that the widespread expected relationship between gold and inflation is not always there — indeed, there have been several instances in the past several decades where the opposite is the case.

Know that Elliott wave analysis, which is by no means a crystal ball, can nonetheless help you anticipate gold’s next big price move.

If you’re unfamiliar with Elliott wave analysis, read Frost & Prechter’s Elliott Wave Principle: Key to Market Behavior. Here’s a quote from the book:

The Wave Principle is governed by man’s social nature, and since he has such a nature, its expression generates forms. As the forms are repetitive, they have predictive value.

Learn about these “forms” for free as a Club EWI member.

That’s right — you can gain free access to the entire online version of this Wall Street classic by joining Club EWI — the world’s largest Elliott wave educational community. A Club EWI membership is also free, and members enjoy complimentary access to a wealth of Elliott wave resources on investing and trading.

Get started right away by following this link: Elliott Wave Principle: Key to Market Behaviorget free and instant access.

This article was syndicated by Elliott Wave International and was originally published under the headline Gold and Inflation: Here’s a Market Myth. EWI is the world’s largest market forecasting firm. Its staff of full-time analysts led by Chartered Market Technician Robert Prechter provides 24-hour-a-day market analysis to institutional and private investors around the world.

Trade Of The Week: Gold Down, But Not Out As February Kicks Off

By ForexTime 

After tumbling 2.5% last Friday due to an unexpectedly strong US jobs report, gold prices have kicked off the new week on a steadier note.

The precious metal is attempting to nurse deep wounds inflicted by January’s blockbuster NFP report which aggressively fuelled expectations around more US rate hikes from the Federal Reserve. Last month, the US economy created a whooping 517k jobs – the most since July and easily bearing market forecasts of 185k. Meanwhile, unemployment fell to its lowest level since 1969 at 3.4%. Given how the stunningly good report is likely to energize dollar bulls and empower Fed hawks, the path of least resistance for gold may point south in the short to medium term.

In our 2023, we highlighted how gold could be one of the biggest gainers this year thanks to expectations around the Fed switching to rate cuts later in 2023. The latest developments may have poured some cold water on these expectations. However, more key economic data may be needed to come to any meaningful conclusions. In the meantime, there is a possibility that the robust jobs data may set the tone for February

Taking a brief look at the technicals, gold may be down but certainly not out yet as bulls remain in some control on the monthly timeframe. There seems to be strong resistance around $1950 – $2000 while support can be found at $1700 – $1680. Gold could find itself rangebound until a fresh directional catalyst is brought into the picture.

Calm week before another storm?

Compared to last week’s mighty few days of market thrills, key central bank meetings, and high-risk events, the economic calendar for this week is relatively lighter.

Naturally, much attention will be directed toward speeches from Fed officials including Jerome Powell and US President Joe Bidens State of the Union Address. Even the weekly initial jobless claims on Thursday and US February consumer sentiment published on Friday may influence gold prices. Overall, the direction of gold should mostly be dictated by renewed Fed hike bets, a stronger dollar, and rising Treasury yields.

Looking beyond this week, it’s all about the US inflation report. Back in December 2022, the annual inflation rate in the United States slowed for a sixth straight month to 6.5%. This was a welcome development for financial markets and raised hopes over the Fed shifting into lower gear on rates. However, the robust strength of the US labour could feed fears over inflation remaining stubbornly high despite the latest recent slowdown. Ultimately, further signs of cooling inflationary pressures in January could provide gold bulls some sort of lifeline as the battle for dominance rages on.

Other themes to watch out for…

It will be wise to keep a close eye on the developments revolving around Sino-U.S. relations. Market sentiment remains gripped by fears over worsening US-China relations after the US shot down a suspected Chinese spy balloon over the weekend. Should tensions escalate, this may promote risk aversion boosting appetite for safe-haven assets. Appetite towards gold could receive a boost, however, this may be capped by an appreciating dollar.

Gold to remain below $1900?

Despite edging higher on Monday, gold prices remain under pressure on the daily charts. After cutting through the $1900 psychological level like a hot knife through butter, bears are clearly in a position of power. Sustained weakness below $1880 may open the doors towards $1825 and $1800, respectively. If prices can push back above $1900, gold could challenge $1950 and $2000, respectively.

Looking at the monthly charts, the recent rejection from the $1950 could guide prices back toward $1700 before bulls re-enter the scene. A breakdown below $1700 has the potential to trigger a selloff towards $1625.


Forex-Time-LogoArticle by ForexTime

ForexTime Ltd (FXTM) is an award winning international online forex broker regulated by CySEC 185/12 www.forextime.com

Trendline Obsession

Source: Michael Ballanger  (1/30/23) 

Michael Ballanger of GGM Advisory Inc. shares his thoughts on the S&P 500, the outlook of Gold and Silver, and specifically why he believes you should be interested in Norseman Silver Ltd. 

In the mid-1980s, I got to know the late and very much renowned Canadian technical analyst Ian McAvity whose relationship with my boss (Jim Biddell) was forged years earlier in the 1960s when Ian and Jim were amongst the top squash players in Canada. In fact, Ian was a member of the Canadian Champion Doubles Squash team, ranked number one in North America for a time.

He also played exhibition matches against Pakistani-born North American professional champion Sharif Khan while showcasing the sport for South Afrikaan audiences shortly after the fall of apartheid rule. Above all else, Ian was not only a brilliant technical analyst and a pioneer in the use of logarithmic analysis to define trends but also a great storyteller with a wicked sense of humor.

I recall the time Ian put on a seminar at the old Holiday Inn in London, Ontario, and at the end of the presentation during the Q and A period, an elderly bespectacled gentleman got up and began to complain rather vociferously about the advice he was receiving from his stockbroker.

After waiting and listening for several very long moments with the stockbrokers in the audience shifting nervously in their chairs, Ian waited for the man to finish and then return to his seat, at which point Ian said, “When you came into this world, you had nothing. When you leave this world, you take nothing with you. So don’t hate your broker . . .  he’s just doing God’s work.”

Between hysterical guffaws and indignant screams of outrage, it was the best comeback ever in the history of boring high finance, and the box of Kleenex I went through wiping the tears of laughter from my cheeks is now legend.

At which point Ian said, “When you came into this world, you had nothing. When you leave this world, you take nothing with you. So don’t hate your broker . . .  he’s just doing God’s work.”

Please refrain from asking me why Ian McAvity suddenly popped into my mind as I sat down to write this weekly missive, but in case you do, the answer lies in the chart shown above that details arguably the most-watched, most-debated and most beaten-to-death technical pattern that has ever existed in the over-analyzed world of stock trading. So, I was wondering how my late friend Ian McAvity would have assessed it . . .

As I have written about for months now, I turned bullish in late September in what can only be described as an “ad hoc” decision. It was totally impulsive, based purely on the massive number of newly-arrived bears, each podcasting their breathless forecasts of stock market Armageddon sure to arrive in October of last year. It was also based on the sentiment numbers and hedge fund positioning (both at bearish extremes) but what sealed the deal for me was when a central bank that had been boasting loudly about its intention to normalize its balance sheet with huge bond sales suddenly did an abrupt one-eighty-degree turn.

When the Bank of England announced their purchase of some US$5 billion worth of 10-year “gilts” in order to alleviate domestic U.K. pension fund “stress,” a psychosomatic alarm bell went off inside me after which I immediately fired off an email alert to subscribers with the opinion that the Bank of England’s “pivot” was the call to arms for all of us to put away the bear clothes and start thinking about a year-end rally, which we got in spades.

The actual low for the S&P was a few trading days later on October 13th, but it was a great call based upon gut feel and had nothing whatsoever to do with the fine science of technical analysis.

S&P 500

That brings me to the topic of the current technical set-up for the S&P 500, which has the entire world focused on what the Twitterverse calls the “MOAT” — as in “Mother of All Trendlines.” We have everyone from thirty-something single moms doing kitchen table financial planning to seasoned CNBC commentators all weighing in on their analysis of this widely-trumpeted “rising wedge” formation that is “most surely” going to resolve itself to the downside and while the Citigroup panic-euphoria gauge has improved from “GREED” to “NEUTRAL,” I suspect that the consensus positioning is still bearish and that, according to Bob Farrell’s trading rule number nine, means that since so many experts all carry the same opinion, odds dictate an equal but opposite outcome.

With the wit and wisdom of Ian McAvity as my compass, this is what I surmised might be the probable outcome: (from Email Alert 2023-08)

“What I see happening by mid-February is the likelihood that Sam Bankman-Fried operating from the back room of his parents’ multi-million-dollar apartment in NYC, devises an algorithm that sends the S&P straight north of the ascending wedge, triggering an avalanche of “BUY” order from legion after legion of algobot traders, into which SBF shorts the entire volume surge sending the S&P southward and in full “failed-breakout” status. His coaches will be Elizabeth Holmes and the ghost of Bernie Madoff to ensure proper execution with zero prisoners taken.”

At the end of the day, only the market itself has any idea where it is going to wind up so technical analysis is simply just another tool.

My point in that veiled attempt at dark humor is that if there is one thing that Ian McAvity preached in his weekly “Deliberations” newsletter, was that at the end of the day, only the market itself has any idea where it is going to wind up so technical analysis is simply just another tool (like a few of the self-inflated podcasters I watch) with which to make investment/trading decisions.

I urge all of you attempting to use the resolution of the MOAT to park the current MSM obsession in the closet and let the “Two-day Close Rule” take effect before committing capital to the next “no-brainer” trade…

This past week I counted news releases from every junior developer/explorer in my 2023 GGMA Portfolio list as the consensus for 2023 is now tilting in the direction of the return of the commodities bull led by gold and silver but dominated by silver. It was almost as if every junior CEO/President were sent the advanced screening of Rick Rule’s appearance on Adam Taggert’s Wealtheon podcast, where the most-erudite stock peddler in world history (Rule) delivers a compellingly-verbose rendering of the commodities version of “In Flanders Field” punctuated with a “to those with failing hands we throw the torch hold it high” dissertation on silver and why Rick is going to join Neil Armstrong in taking “one small step for a man, but one giant leap for my net worth statement” (i.e., “da moon”)

Gold and Silver

Moonshots notwithstanding, silver has lagged behind gold and copper since late December, and while it can be argued that silver was the standout leader from late September to late December, gold and copper are simply playing “catchup.” I disagree. Traders live in the “now,” and until silver can get to a new recovery high for the advance above US$24.77 (basis March silver), the entire metals complex is going to be vulnerable to another bear raid that serves to deflate not only spirits but also the P&L’s of thousands of short-term option and futures punters that are reading and singing off the Rick Rule hymn sheet.

Since those are the very people that will be buying the junior miners, explorers, and developers (all of which I own), I do not wish to see gold and copper actually “catch up” to silver because chances are by the time that happens, the rally will be punctuated with terminal violence (and cries of anguish).

Norseman Silver

I mentioned Allied Copper Corp. (CPR:TSX.V; CPRRF:OTCQB) last week, and since it popped 46.4% this week, prompting dozens upon dozens of emails requesting more of these “penny dreadful” names, I offer this week another one but for a vastly different reason. The name is Norseman Silver Ltd. (NOC:TSX.V; NOCSF:OTCQB), whose principal project is located in South America.

In my career, there have always been areas of the world where the risk premium is elevated either due to the absence of the Rule of Law, infrastructure deficiencies, or domestic politics. In recent years, populist movements around the globe have shifted the winds of foreign investment in many different directions and in some cases, surprisingly hostile from the most unexpected of countries.

Mexico was once the favorite playground for Canadian miners as it was part of the NAFTA accord, so the free trade statutes were always there to protect the foreign investor. That has now changed with the news that Fortuna Silver has had its San Jose mine in southern Oaxaca shuttered due to environmental concerns. Civil unrest and local community protests have shut down countless operations in Peru recently, and for Peru, where over 40% of national taxes are generated by miners, that is a striking development.

I have a dear friend from the U.S. Midwest whose uncles are all worldly entrepreneurs whose contacts monitor foreign investment flows as a means of practicing the “Follow the Money” school of due diligence. He tells me that there are absolutely massive investment dollars being channeled into three South American countries in the fourth quarter of 2022 and again in January of 2023, with Paraguay and Ecuador the two lesser recipients. However, the primary focus of these enormous capital investments is the one country least likely in the past to enjoy such good fortune — Argentina.

The reality is that when governments erect roadblocks to exploration and development, vast regions that contain potential district-scale mining camps fall into the category of “underexplored” and, therefore, by default, “underdeveloped,” and therein lies the opportunity.

When I think of Argentina, all I can recall is that it has a massive inflation problem (94% in 2022) and that it has tended historically to be decidedly anti-mining and anti-foreign in its treatment of investors.

As an example, in 2009, Pan American Silver Corp. (PAAS:TSX; PAAS:NASDAQ) bought the Navidad Silver deposit through the acquisition of Aquiline for US$630 million, only to discover that the province of Chubut disallowed the use of cyanide in mining operations thus preventing commercial exploitation of one of the world’s largest and richest undeveloped silver deposits.

However, recent legislation began to move in the opposite direction, as “limited development” is now possible in 2023. The reality is that when governments erect roadblocks to exploration and development, vast regions that contain potential district-scale mining camps fall into the category of “underexplored” and, therefore, by default, “underdeveloped,” and therein lies the opportunity.

The Navidad silver deposit was discovered in a geological setting in Patagonia known as the “Gastre Fault” structural corridor, which also contains the Calcatreu Gold Mine. It is a vast region largely untapped, but if a foreign entity can enlist the right person or group to navigate the permitting waters successfully, they will have earned the “first mover advantage,” and that is exactly what Norseman silver has accomplished with their acquisition of the Taquetren Project, a land package of some 145,000 acres located in the Navidad-Calcatreu Mining District.

Gold Ridge

Of even greater importance is that the prospector-geologist and Argentinian national that discovered Navidad, Daniel Bussandri, is now Norseman’s country manager and is completely in charge of all operations, including exploration and permitting, for Taquetren. To have a local with a proven track record as a mine-finder at the helm is an asset that is hard to assess, but the one thing I know for sure is that the risk premium that one would normally assign has now been mitigated by the presence of Daniel Bussandri.

Press releases in 2022 have revealed mineralized outcrops of major copper-silver credits and some minor gold occurrences, but that last one from January 23rd was a game-changer.

Buy Norseman Silver.

It detailed the discovery of a 2 km long, 0.5 km wide mineralized vein structure where sub-crops yielded values as high as 12.2 g/t Au with this “Gold Ridge” zone lying within a larger 5 km long corridor hosting the Martha, Neta Nueva, Irma, and Veta Juan targets.

I have learned that the most recent sampling results at Gold Ridge are attracting the eyes and interest of more than a few of the consulting geologists, including 82-year-old crusty veteran geo Ron McMillan, who carries the reputation of being “unexcitable” about anything to do with early-stage exploration. Well, apparently, Mr. McMillan is “noticeably excited” about Gold Ridge, and given that it is located 20 km NW of Calcatreu and in the same mining district, I deem that as significant.

Norseman is completing a fast CA$750k funding in order to pay for the geophysical survey ordered last week, so with the existing CA$600,000 working capital position, the company is fully-funded to commence drilling once targets have been identified and permits received.

In sum, we have what might be a new gold discovery in a known gold-bearing region located in a largely-underexplored part of the world where for the first time in recent memory, large investment flows are suddenly and impressively showing up. We have a country manager with a proven track record and voluminous local relationships in order to facilitate the needs of the local politicians as he tries to capture the Navidad lightning in the junior exploration bottle once again. Remember, Navidad was sold for US$630 million.

At a CA$6.3m market cap, Norseman Silver Inc. appears ready to assume a dominant role in the Patagonia region as a first-mover with strong management at all levels and with a large land package in a mine-bearing region.

Buy Norseman Silver.

Michael Ballanger Disclaimer:

This letter makes no guarantee or warranty on the accuracy or completeness of the data provided. Nothing contained herein is intended or shall be deemed to be investment advice, implied or otherwise. This letter represents my views and replicates trades that I am making but nothing more than that. Always consult your registered advisor to assist you with your investments. I accept no liability for any loss arising from the use of the data contained on this letter. Options and junior mining stocks contain a high level of risk that may result in the loss of part or all invested capital and therefore are suitable for experienced and professional investors and traders only. One should be familiar with the risks involved in junior mining and options trading and we recommend consulting a financial adviser if you feel you do not understand the risks involved.

Disclosures:

1) Michael J. Ballanger: I, or members of my immediate household or family, own securities of the following companies mentioned in this article: All. I personally am, or members of my immediate household or family are, paid by the following companies mentioned in this article: My company, Bonaventure Explorations Ltd., has a consulting relationship with: None.

2) The following companies mentioned in this article are billboard sponsors of Streetwise Reports: None. Click here for important disclosures about sponsor fees. As of the date of this article, an affiliate of Streetwise Reports has a consulting relationship with: None. Please click here for more information.

3) Statements and opinions expressed are the opinions of the author and not of Streetwise Reports or its officers. The author is wholly responsible for the validity of the statements. The author was not paid by Streetwise Reports for this article. Streetwise Reports was not paid by the author to publish or syndicate this article. Streetwise Reports requires contributing authors to disclose any shareholdings in, or economic relationships with, companies that they write about. Streetwise Reports relies upon the authors to accurately provide this information and Streetwise Reports has no means of verifying its accuracy.

4) This article does not constitute investment advice. Each reader is encouraged to consult with his or her individual financial professional and any action a reader takes as a result of information presented here is his or her own responsibility. By opening this page, each reader accepts and agrees to Streetwise Reports’ terms of use and full legal disclaimer. This article is not a solicitation for investment. Streetwise Reports does not render general or specific investment advice and the information on Streetwise Reports should not be considered a recommendation to buy or sell any security. Streetwise Reports does not endorse or recommend the business, products, services or securities of any company mentioned on Streetwise Reports.

5) From time to time, Streetwise Reports LLC and its directors, officers, employees or members of their families, as well as persons interviewed for articles and interviews on the site, may have a long or short position in securities mentioned. Directors, officers, employees or members of their immediate families are prohibited from making purchases and/or sales of those securities in the open market or otherwise from the time of the decision to publish an article until three business days after the publication of the article. The foregoing prohibition does not apply to articles that in substance only restate previously published company releases.

As of the date of this article, officers and/or employees of Streetwise Reports LLC (including members of their household) own securities of Allied Copper Corp. and  Norseman Silver Ltd., companies mentioned in this article.

Large Metals Speculators continue to boost Gold bullish bets to 30-week high

By InvestMacro

Here are the latest charts and statistics for the Commitment of Traders (COT) data published by the Commodities Futures Trading Commission (CFTC).

The latest COT data is updated through Tuesday January 24th and shows a quick view of how large traders (for-profit speculators and commercial entities) were positioned in the futures markets.

Weekly Speculator Changes led by Gold & Copper

The COT metals markets speculator bets were lower this week as two out of the five precious metals markets we cover had higher positioning while the other three markets had lower speculator contracts.

Leading the gains for the metals was Gold (4,433 contracts) with Copper (3,932 contracts) also showing a positive week.

The markets with declines in speculator bets for the week were Silver (-5,784 contracts), Platinum (-3,283 contracts) and Palladium (-546 contracts) also seeing lower bets on the week.

Highlighting the COT metals data this week is the continued bullishness for the Gold speculative positions. The large speculator position in Gold futures advanced once again this week for an eighth straight week and for the tenth time out of the past twelve weeks. The Gold position has now risen from a total of +64,623 contracts on November 1st to a new 30-week high at a total of +157,673 contracts this week.

The Gold futures price closed slightly higher again this week and has now been up for six consecutive weeks. This week’s high was right below the $1,950.00 level and marked the highest Gold prices have reached since April. Gold may be due for a breather with the daily RSI Indicator showing overbought levels but with the US Dollar trending lower, Gold may have a bright outlook in 2023.


Data Snapshot of Commodity Market Traders | Columns Legend
Jan-24-2023OIOI-IndexSpec-NetSpec-IndexCom-NetCOM-IndexSmalls-NetSmalls-Index
Gold499,92725157,67335-180,5546322,88137
Silver134,9221225,68442-39,4615813,77741
Copper213,3985220,17052-26,542466,37262
Palladium9,36320-3,29783,53491-23727
Platinum72,6134620,26139-25,819615,55842


Strength Scores led by Copper & Silver

COT Strength Scores (a normalized measure of Speculator positions over a 3-Year range, from 0 to 100 where above 80 is Extreme-Bullish and below 20 is Extreme-Bearish) showed that the Copper (52 percent) leads the metals markets this week. Silver (42 percent) comes in as the next highest in the weekly strength scores.

On the downside, Palladium (8 percent) comes in at the lowest strength level currently and is in Extreme-Bearish territory (below 20 percent). The next lowest strength score was Gold (35 percent).

Strength Statistics:
Gold (35.0 percent) vs Gold previous week (33.5 percent)
Silver (42.4 percent) vs Silver previous week (48.8 percent)
Copper (52.4 percent) vs Copper previous week (49.2 percent)
Platinum (38.8 percent) vs Platinum previous week (43.6 percent)
Palladium (7.5 percent) vs Palladium previous week (12.9 percent)


Copper & Gold top the 6-Week Strength Trends

COT Strength Score Trends (or move index, calculates the 6-week changes in strength scores) showed that Copper (14 percent) leads the past six weeks trends for metals. Gold (11 percent) is the next highest positive mover in the latest trends data.

Palladium (-24 percent) leads the downside trend scores currently with Platinum (-12 percent) as the next market with lower trend scores.

Move Statistics:
Gold (10.6 percent) vs Gold previous week (12.6 percent)
Silver (3.2 percent) vs Silver previous week (13.5 percent)
Copper (14.0 percent) vs Copper previous week (11.6 percent)
Platinum (-11.8 percent) vs Platinum previous week (-3.0 percent)
Palladium (-23.9 percent) vs Palladium previous week (-13.7 percent)


Individual Markets:

Gold Comex Futures:

Gold Futures COT ChartThe Gold Comex Futures large speculator standing this week totaled a net position of 157,673 contracts in the data reported through Tuesday. This was a weekly boost of 4,433 contracts from the previous week which had a total of 153,240 net contracts.

This week’s current strength score (the trader positioning range over the past three years, measured from 0 to 100) shows the speculators are currently Bearish with a score of 35.0 percent. The commercials are Bullish with a score of 63.4 percent and the small traders (not shown in chart) are Bearish with a score of 37.3 percent.

Gold Futures StatisticsSPECULATORSCOMMERCIALSSMALL TRADERS
– Percent of Open Interest Longs:50.725.59.6
– Percent of Open Interest Shorts:19.161.65.0
– Net Position:157,673-180,55422,881
– Gross Longs:253,311127,41947,880
– Gross Shorts:95,638307,97324,999
– Long to Short Ratio:2.6 to 10.4 to 11.9 to 1
NET POSITION TREND:
– Strength Index Score (3 Year Range Pct):35.063.437.3
– Strength Index Reading (3 Year Range):BearishBullishBearish
NET POSITION MOVEMENT INDEX:
– 6-Week Change in Strength Index:10.6-13.025.1


Silver Comex Futures:

Silver Futures COT ChartThe Silver Comex Futures large speculator standing this week totaled a net position of 25,684 contracts in the data reported through Tuesday. This was a weekly decline of -5,784 contracts from the previous week which had a total of 31,468 net contracts.

This week’s current strength score (the trader positioning range over the past three years, measured from 0 to 100) shows the speculators are currently Bearish with a score of 42.4 percent. The commercials are Bullish with a score of 57.9 percent and the small traders (not shown in chart) are Bearish with a score of 41.0 percent.

Silver Futures StatisticsSPECULATORSCOMMERCIALSSMALL TRADERS
– Percent of Open Interest Longs:41.235.117.7
– Percent of Open Interest Shorts:22.264.37.5
– Net Position:25,684-39,46113,777
– Gross Longs:55,59547,35923,875
– Gross Shorts:29,91186,82010,098
– Long to Short Ratio:1.9 to 10.5 to 12.4 to 1
NET POSITION TREND:
– Strength Index Score (3 Year Range Pct):42.457.941.0
– Strength Index Reading (3 Year Range):BearishBullishBearish
NET POSITION MOVEMENT INDEX:
– 6-Week Change in Strength Index:3.2-3.54.2


Copper Grade #1 Futures:

Copper Futures COT ChartThe Copper Grade #1 Futures large speculator standing this week totaled a net position of 20,170 contracts in the data reported through Tuesday. This was a weekly increase of 3,932 contracts from the previous week which had a total of 16,238 net contracts.

This week’s current strength score (the trader positioning range over the past three years, measured from 0 to 100) shows the speculators are currently Bullish with a score of 52.4 percent. The commercials are Bearish with a score of 46.4 percent and the small traders (not shown in chart) are Bullish with a score of 62.1 percent.

Copper Futures StatisticsSPECULATORSCOMMERCIALSSMALL TRADERS
– Percent of Open Interest Longs:41.235.09.3
– Percent of Open Interest Shorts:31.847.46.3
– Net Position:20,170-26,5426,372
– Gross Longs:87,94174,71519,913
– Gross Shorts:67,771101,25713,541
– Long to Short Ratio:1.3 to 10.7 to 11.5 to 1
NET POSITION TREND:
– Strength Index Score (3 Year Range Pct):52.446.462.1
– Strength Index Reading (3 Year Range):BullishBearishBullish
NET POSITION MOVEMENT INDEX:
– 6-Week Change in Strength Index:14.0-15.513.7


Platinum Futures:

Platinum Futures COT ChartThe Platinum Futures large speculator standing this week totaled a net position of 20,261 contracts in the data reported through Tuesday. This was a weekly fall of -3,283 contracts from the previous week which had a total of 23,544 net contracts.

This week’s current strength score (the trader positioning range over the past three years, measured from 0 to 100) shows the speculators are currently Bearish with a score of 38.8 percent. The commercials are Bullish with a score of 60.9 percent and the small traders (not shown in chart) are Bearish with a score of 42.5 percent.

Platinum Futures StatisticsSPECULATORSCOMMERCIALSSMALL TRADERS
– Percent of Open Interest Longs:54.130.911.3
– Percent of Open Interest Shorts:26.266.43.6
– Net Position:20,261-25,8195,558
– Gross Longs:39,27922,4288,206
– Gross Shorts:19,01848,2472,648
– Long to Short Ratio:2.1 to 10.5 to 13.1 to 1
NET POSITION TREND:
– Strength Index Score (3 Year Range Pct):38.860.942.5
– Strength Index Reading (3 Year Range):BearishBullishBearish
NET POSITION MOVEMENT INDEX:
– 6-Week Change in Strength Index:-11.89.218.3


Palladium Futures:

Palladium Futures COT ChartThe Palladium Futures large speculator standing this week totaled a net position of -3,297 contracts in the data reported through Tuesday. This was a weekly decline of -546 contracts from the previous week which had a total of -2,751 net contracts.

This week’s current strength score (the trader positioning range over the past three years, measured from 0 to 100) shows the speculators are currently Bearish-Extreme with a score of 7.5 percent. The commercials are Bullish-Extreme with a score of 91.1 percent and the small traders (not shown in chart) are Bearish with a score of 27.5 percent.

Palladium Futures StatisticsSPECULATORSCOMMERCIALSSMALL TRADERS
– Percent of Open Interest Longs:19.162.212.9
– Percent of Open Interest Shorts:54.324.515.5
– Net Position:-3,2973,534-237
– Gross Longs:1,7875,8261,212
– Gross Shorts:5,0842,2921,449
– Long to Short Ratio:0.4 to 12.5 to 10.8 to 1
NET POSITION TREND:
– Strength Index Score (3 Year Range Pct):7.591.127.5
– Strength Index Reading (3 Year Range):Bearish-ExtremeBullish-ExtremeBearish
NET POSITION MOVEMENT INDEX:
– 6-Week Change in Strength Index:-23.924.3-16.0


Article By InvestMacroReceive our weekly COT Newsletter

*COT Report: The COT data, released weekly to the public each Friday, is updated through the most recent Tuesday (data is 3 days old) and shows a quick view of how large speculators or non-commercials (for-profit traders) were positioned in the futures markets.

The CFTC categorizes trader positions according to commercial hedgers (traders who use futures contracts for hedging as part of the business), non-commercials (large traders who speculate to realize trading profits) and nonreportable traders (usually small traders/speculators) as well as their open interest (contracts open in the market at time of reporting). See CFTC criteria here.

Rare Earths Co. Sees More High-Grade Results in BC

Source: Streetwise Reports  (1/23/23)

An analyst says Defense Metals Corp. is well-positioned to benefit from demand for rare earth elements with its continued high-grade results in British Columbia.

Defense Metals Corp. (DEFN:TSX.V; DFMTF:OTCQB; 35D:FSE) continues to release high-grade results from its Wicheeda rare earth element (REE) deposit in British Columbia.

This week it released drill results from eight core holes totaling 2,104 meters. One hole, WI22-73, returned the second longest REE-mineralized intercept of the 2021 and 2022 Wicheeda drilling campaigns, which totaled more than 10,000 meters in 47 core holes.

“We think Defense Metals is well positioned to benefit from growing demand for rare earths used in electric vehicle batteries, metal alloys, and advanced technology applications,” wrote analyst Mark Reichman in a note for Noble Capital Markets on Wednesday.

“Data from the 2021 and 2022 drilling programs will be incorporated into a preliminary feasibility study (PFS) which is expected to be completed by the fourth quarter of 2023,” Reichman wrote. “In addition to [the] significant potential to expand the resource and extend the mine life beyond 19 years, we expect grade enhancement and the meaningful conversion of inferred to indicated and potentially measured resources.”

Reichman rated the stock Outperform with a target of CA$0.70. Its price on Thursday was CA$0.315.

The Catalyst: New Drill Results

Source: Defense Metals Corp.

The new results were from two explorations, three resource delineations, and three pit slope geotechnical core drill holes, the company said. Hole WI22-73 intercepted 1.42% total rare earth oxide (TREO) over 221.7 meters. Hole WI22-74 assayed 3.77% TREO over 30 meters and 2.52% TREO over 59 meters at mid-hole depths, the company said, with a broader zone average of 2.03% TREO over a 192-meter interval.

The 2022 drill program comprised of 18 core holes totaling 5,510 meters. Results have been announced for 16 holes. The results of the last two are expected shortly, Reichman wrote.

“We firmly believe Wicheeda is one of the best rare earths projects globally, and we eagerly look forward to advancing the project during 2023,” said Defense Metals Director Kristopher Raffle.

Three other holes, WI22-75, WI22-66, and WI22-65, all collared outside of the deposit, did not return significant REE mineralization.

Elements in High Demand

Defense Metals hopes to produce as much as 10% of the world’s light REEs to reduce reliance on China, which has about 85% of the world’s REE processing capacity. Political issues between the United States, China, and Taiwan put that vital supply at risk, as well as pressure from within China itself.

REEs are in high demand in the new green economy for purifying water, MRIs, fertilizers, weapons, research, wind turbines, computers, and permanent magnet motors for electric vehicles (EVs).

A preliminary economic assessment (PEA) for Wicheeda in 2021 showed an after-tax net present value of CA$512 million. Its 43-101 technical report showed a 5 million tonne indicated resource at 2.95% total rare earth oxides (TREO) and a 29.5 million tonne inferred resource averaging 1.83% TREO.

“DEFN is a best-of-breed North American REE developer that is well-positioned to its leverage growing global REE demand and government support to become part of a North American REE critical metals supply chain,” Gray wrote.

Wicheeda could help fill the resource gap with China, Reichman said. “The assay results released thus far have been outstanding,” he wrote last November.

Analyst Michael Gray of Agentis Capital recently initiated coverage on the company, saying Wicheeda was well-located with access to key infrastructure and “could become a globally significant producer” of REEs. He set a 12-month valuation of CA$3.50 for the stock.

“DEFN is a best-of-breed North American REE developer that is well-positioned to its leverage growing global REE demand and government support to become part of a North American REE critical metals supply chain,” Gray wrote.

The U.S. government in February announced a US$35 million grant to MP Materials Corp. to process REEs at its California facility. The company has agreed to invest US$700 million to create more than 350 jobs in the permanent magnet sector by 2024.

Gray said industries that use REEs are set to expand.

“The fundamentals for REE demand growth (are) very positive,” he wrote. “Demand is high, and forecasts suggest it will continue to grow, vis a vis the markets for EVs, wind turbines, and defense technologies.”

Reichman also noted the recent appointment of Len Clough, president and chief executive officer of Toro Pacific Management, to the board of directors to replace the departing Max Sali. Clough founded Toro, a capital markets advisory firm, in 2013, he said.

Ownership and Share Structure


Retail: 90%
Institutional: 5%
Insider: 5%
90%
5%
5%
*Share Structure as of 1/23/2023


About 5% of the company’s stock is owned by institutional entities, and about 5% is owned by insiders. The rest, 90%, is retail.

Currently, the analysts covering Defense Metals Corp. include Reichman and Gray. Newsletter writers Clive Maund and Bob Moriarty also follow the stock. You can see all the analyst and newsletter coverage by clicking “See More Live Data” in the data box above.

Defense Metals has a market cap of CA$65.43 million with 207.7 million shares outstanding, 164.9 million of them free floating. It trades in a 52-week range of CA$0.365 and CA$0.16.

Disclosures:

1) Steve Sobek wrote this article for Streetwise Reports LLC. He or members of his household own securities of the following companies mentioned in the article: None. He and members of his household are paid by the following companies mentioned in this article: None.

2) The following companies mentioned in this article are billboard sponsors of Streetwise Reports: Defense Metals Corp. Click here for important disclosures about sponsor fees. As of the date of this article, an affiliate of Streetwise Reports has a consulting relationship with Defense Metals Corp. Please click here for more information. The information provided above is for informational purposes only and is not a recommendation to buy or sell any security.

3) The article does not constitute investment advice. Each reader is encouraged to consult with his or her individual financial professional and any action a reader takes as a result of information presented here is his or her own responsibility. By opening this page, each reader accepts and agrees to Streetwise Reports’ terms of use and full legal disclaimer. This article is not a solicitation for investment. Streetwise Reports does not render general or specific investment advice and the information on Streetwise Reports should not be considered a recommendation to buy or sell any security. Streetwise Reports does not endorse or recommend the business, products, services or securities of any company mentioned on Streetwise Reports.

4) From time to time, Streetwise Reports LLC and its directors, officers, employees, or members of their families, as well as persons interviewed for articles and interviews on the site, may have a long or short position in securities mentioned. Directors, officers, employees or members of their immediate families are prohibited from making purchases and/or sales of those securities in the open market or otherwise from the time of the decision to publish an article until three business days after the publication of the article. The foregoing prohibition does not apply to articles that in substance only restate previously published company releases. As of the date of this article, officers and/or employees of Streetwise Reports LLC (including members of their household) own securities of Defense Metals Corp., a company mentioned in this article.


Is Gold’s Rally Vulnerable, as Fed Readies To Meet?

Source: Adrian Day  (1/23/23)

Adrian Day of Adrian Day Asset Management reviews recent results from several resource companies, mostly positive, though cost increases are an issue everywhere. 

Gold has moved ahead on expectations that the Federal Reserve will start to slow and then pause its tightening program. There have been several indications of this since the last Fed policy meeting, including chairman Jerome Powell’s comment at his December press conference that the Fed would not start to cut interest rates “until we are convinced that inflation is moving down towards 2%”, a quite different matter than inflation actually being at 2%. Then in the last week, several Fed officials said “not so fast,” but some of those, such as James Bullard, who called for a half-point increase later this month and another full percentage point this year, are no longer voting members of the rate-setting committee.

But we know the Fed, and particularly Mr. Powell, are concerned at markets discounting the Fed’s message. They are less concerned about the gold market than they are about stocks, bonds, and other assets, but certainly, gold is vulnerable to a pullback after the 18% move since early November. A quarter-point rate increase is now seen as almost certain; it is very unlikely to be less than that, so any surprise is likely to be on the upside, that is, negative for markets and gold.

We remain very positive for the balance of the year, but some trimming of gold stocks and certainly caution in new buys, would not be out of place.

Pending Acquisition of Yamana Overshares Pan American’s Solid Quarter

Pan American Silver Corp. (PAAS:TSX; PAAS:NASDAQ) reported strong production in the last quarter of the year and probably the last full quarter before the acquisition of Yamana, ending a string of disappointing quarterly results. In its preliminary production report, Pan Am said it met its previously reduced guidance, with gold production up 28% on the prior quarter, while silver output rose 5%; zinc and lead, the two primary non-precious metals, also were up meaningfully.

Though the results were positive, they were overshadowed by the pending acquisition of Yamana, which is expected to close sometime this quarter. The deal is accretive for Pan Am and arguably improves the aggregate quality of its mines. We expect to see the company sell some higher-cost or shorter-life assets, thus reducing its purchase cost. Pan Am said it expects to discuss 2023 guidance after the transaction is complete.

Pan American is trading at a discount to both major miners and to other silver-focused companies. Although we are very positive about the stock longer term, especially with the possibility of Escobal in Guatemala coming back online at some point, we are cautious in the near term. We may see some selling from shareholders who own too much of the combined company or Yamana shareholders unhappy with the transaction, and given that Yamana shareholders will hold nearly half of the combined company, this could be meaningful. Hold.

An Osisko Asset Moves Forward

Osisko Gold Royalties Ltd. (OR:TSX; OR:NYSE) received more good news, with the first resource estimate on Osisko Development’s Tintic project in Utah. The Trixie Zone has 456,000 ounces of gold at an average grade of 23.5 g/t., the resource covering only about 10% of the footprint on limited drilling (50 drill holes). The resource should get to one million ounces, at similar grades, for a high-grade mine expected to commence production in early 2024. Osisko Gold holds a 2.5% metals stream on the project, payable at 25% of the spot prices at delivery; it paid $20 million for the stream.

This is a good example of the benefits that Osisko derives from its offspring. And it is only one of more than a dozen projects advancing this year. Given the strong rally, both since early November (up 34%) and the last few days (traded under $13 on Tuesday), we will wait for a pullback to add. Hold.

Fortuna Delivers Another Solid Quarter

Fortuna Silver Mines Inc. (FSM:NYSE; FVI:TSX; FVI:BVL; F4S:FSE) also reported a solid fourth quarter, with gold and silver production both in line with full-year guidance, while lead and zinc exceeded guidance somewhat. Gold production was above many analyst expectations, although costs were up, at most mines around 15%, driven by sustaining capital spending. This quarter represents another consecutive quarter where Fortuna’s operations have met or exceeded expectations after a frustrating series of issues in 2021 and early 2022. Construction at Séguéla remains on track, with the first gold expected in the second quarter after mining begins this quarter.

The company is initiating action in Mexico, on both the judicial and political front, over the last reversal of its permit for San Jose. The company is looking for an increase in gold-equivalent ounces this year of between 3% and 15% over last year, driven by a 25% increase in gold as Séguéla comes on stream. Gold production is expected at between 282Kk and 320K, as much as a 23% increase, while silver output is expected to decline by up to 9% to 6.3 million to 6.9 million ounces.

Strong management, a solid balance sheet, a diversified asset base, and growth ahead: Fortuna can be accumulated here and bought aggressively on any dips.

Barrick Disappoints on Production and Costs

Barrick Gold Corp. (ABX:TSX; GOLD:NYSE) had a disappointing quarter, even though it was the strongest for gold production of any this past year. Gold output was up 13% over the prior quarter, but that was not sufficient to save full-year production, which at 4.14 million ounces, was below the low end of the company’s guidance. The company’s assertion last quarter that it would still meet guidance was treated somewhat skeptically by many analysts. Though copper production was down 5% from the prior quarter and below some estimates, it still came in within the full-year guidance range.

Costs were also disappointing; although down slightly from the third quarter, largely due to higher volumes, costs were higher than management was indicating. Given the results, it is likely that the variable quarterly dividend will decline to the base of 10 cents a share. Separately, Barrick announced a time frame for its new Reko Diq copper project in Pakistan, with a feasibility update expected to be completed by the end of next year, with 2028 targeted for the first production, as indicated previously. Barrick is the 50% owner and the operator.

Barrick remains inexpensive, both fundamentally and in relation to his historical average valuations. However, we would like to see a pullback before buying, given the strong rally in recent months (the stock was at $13.10 in early November).

Midland Has Another Busy Year Ahead

Midland Exploration Inc. (MD:TSX.V) released an overview of its exploration plans for the coming year, expecting a budget of over $11 million with 20,000 meters of diamond drilling. Its plans for 2023 are aimed at following up on new discoveries made throughout 2022. Midland is working on several projects in partnership with others, including BHP, Rio Tino, SOQUEM, Probe, and Wallbridge. The company will also advance several of its wholly-owned properties. Given the activity, the strong management, and the balance sheet, Midland is a strong buy at the current level.

TOP BUYS THIS WEEK, in addition to the above, include Orogen Royalties Inc. (OGN:TSX.V). As we have said for the last couple of weeks, we are generally cautious on buying right now, given valuations in the broad market and following the strong gold-stock move in the last couple of months. Patience will pay off!

Adrian Day Disclosures:

Adrian Day’s Global Analyst is distributed for $990 per year by Investment Consultants International, Ltd., P.O. Box 6644, Annapolis, MD 21401. (410) 224-8885. www.AdrianDayGlobalAnalyst.com. Publisher: Adrian Day. Owner: Investment Consultants International, Ltd. Staff may have positions in securities discussed herein. Adrian Day is also President of Global Strategic Management (GSM), a registered investment advisor, and a separate company from this service. In his capacity as GSM president, Adrian Day may be buying or selling for clients securities recommended herein concurrently, before or after recommendations herein, and may be acting for clients in a manner contrary to recommendations herein. This is not a solicitation for GSM. Views herein are the editor’s opinion and not fact. All information is believed to be correct, but its accuracy cannot be guaranteed. The owner and editor are not responsible for errors and omissions. © 2022. Adrian Day’s Global Analyst. Information and advice herein are intended purely for the subscriber’s own account. Under no circumstances may any part of a Global Analyst e-mail be copied or distributed without prior written permission of the editor. Given the nature of this service, we will pursue any violations aggressively.

Disclosures:

1) Adrian Day: I, or members of my immediate household or family, own securities of the following companies mentioned in this article: All. I personally am, or members of my immediate household or family are, paid by the following companies mentioned in this article: None. My company has a financial relationship with the following companies mentioned in this article: None. Funds controlled by Adrian Day Asset Management, which is unaffiliated with Adrian Day’s newsletter, hold shares of the following companies mentioned in this article: All. I determined which companies would be included in this article based on my research and understanding of the sector.

2) The following companies mentioned in this article are billboard sponsors of Streetwise Reports: None. Click here for important disclosures about sponsor fees. The information provided above is for informational purposes only and is not a recommendation to buy or sell any security.

3) Statements and opinions expressed are the opinions of the author and not of Streetwise Reports or its officers. The author is wholly responsible for the validity of the statements. The author was not paid by Streetwise Reports for this article. Streetwise Reports was not paid by the author to publish or syndicate this article. Streetwise Reports requires contributing authors to disclose any shareholdings in, or economic relationships with, companies that they write about. Streetwise Reports relies upon the authors to accurately provide this information and Streetwise Reports has no means of verifying its accuracy.

4) This article does not constitute investment advice. Each reader is encouraged to consult with his or her individual financial professional and any action a reader takes as a result of information presented here is his or her own responsibility. By opening this page, each reader accepts and agrees to Streetwise Reports’ terms of use and full legal disclaimer. This article is not a solicitation for investment. Streetwise Reports does not render general or specific investment advice and the information on Streetwise Reports should not be considered a recommendation to buy or sell any security. Streetwise Reports does not endorse or recommend the business, products, services, or securities of any company mentioned on Streetwise Reports.

5) From time to time, Streetwise Reports LLC and its directors, officers, employees, or members of their families, as well as persons interviewed for articles and interviews on the site, may have a long or short position in the securities mentioned. Directors, officers, employees, or members of their immediate families are prohibited from making purchases and/or sales of those securities in the open market or otherwise from the time of the decision to publish an article until three business days after the publication of the article. The foregoing prohibition does not apply to articles that in substance only restate previously published company release.


Metals Speculators boosted their Gold Bullish Bets higher for 7th week

By InvestMacro

Here are the latest charts and statistics for the Commitment of Traders (COT) data published by the Commodities Futures Trading Commission (CFTC).

The latest COT data is updated through Tuesday January 17th and shows a quick view of how large traders (for-profit speculators and commercial entities) were positioned in the futures markets.

Weekly Speculator Changes led by Copper & Gold

The COT metals markets speculator bets were higher this week as three out of the five precious metals markets we cover had higher positioning while the other two markets had lower speculator contracts.

Leading the gains for the metals was Copper (6,011 contracts) with Gold (2,705 contracts) and Silver (2,455 contracts) also showing positive weeks.

The markets with declines in speculator bets for the week were Platinum (-7,158 contracts) and Palladium (-261 contracts) also registering lower bets on the week.

Highlighting the COT metals data this week is the recent streak of gains for the Gold speculative positions. The large speculator position in Gold futures rose this week for a seventh consecutive week and for the ninth time out of the past eleven weeks. The Gold position has now gone from a multi-year low total of +64,623 contracts on November 1st to a total of +153,240 contracts this week which marks the highest weekly total of the past 29 weeks, dating back to June 28th.

The Gold futures price has been on the move higher since seeing a recent bottom in October around the $1,620.00 level. This week, the Gold futures closed at $1,928.20 per ounce which is the highest close since April and Gold is showing an approximate gain by 18 percent since the October bottom.


Data Snapshot of Commodity Market Traders | Columns Legend
Jan-17-2023OIOI-IndexSpec-NetSpec-IndexCom-NetCOM-IndexSmalls-NetSmalls-Index
Gold491,81822153,24034-175,9136522,67337
Silver131,862931,46849-45,3675213,89940
Copper201,4554216,23849-22,695496,45763
Palladium8,79916-2,751122,90286-15133
Platinum71,1444123,54441-28,913595,36940


Strength Scores led by Silver & Copper

COT Strength Scores (a normalized measure of Speculator positions over a 3-Year range, from 0 to 100 where above 80 is Extreme-Bullish and below 20 is Extreme-Bearish) showed that Silver (49 percent) and Copper (49 percent) lead the metals markets this week.

On the downside, Palladium (12 percent) comes in at the lowest strength level currently and is in Extreme-Bearish territory (below 20 percent). The next lowest strength score was Gold (34 percent).

Strength Statistics:
Gold (33.5 percent) vs Gold previous week (32.6 percent)
Silver (48.8 percent) vs Silver previous week (46.1 percent)
Copper (49.2 percent) vs Copper previous week (44.5 percent)
Platinum (40.7 percent) vs Platinum previous week (50.4 percent)
Palladium (11.9 percent) vs Palladium previous week (14.3 percent)


Silver & Gold top the 6-Week Strength Trends

COT Strength Score Trends (or move index, calculates the 6-week changes in strength scores) showed that Silver (14 percent) leads the past six weeks trends for metals. Gold (13 percent) is the next highest positive mover in the latest trends data.

Palladium (-13 percent) leads the downside trend scores currently with Platinum (-3 percent) as the next market with lower trend scores.

Move Statistics:
Gold (12.6 percent) vs Gold previous week (13.4 percent)
Silver (13.5 percent) vs Silver previous week (12.7 percent)
Copper (11.6 percent) vs Copper previous week (6.6 percent)
Platinum (-2.8 percent) vs Platinum previous week (8.7 percent)
Palladium (-12.6 percent) vs Palladium previous week (-7.8 percent)


Individual Markets:

Gold Comex Futures:

Gold Futures COT ChartThe Gold Comex Futures large speculator standing this week reached a net position of 153,240 contracts in the data reported through Tuesday. This was a weekly lift of 2,705 contracts from the previous week which had a total of 150,535 net contracts.

This week’s current strength score (the trader positioning range over the past three years, measured from 0 to 100) shows the speculators are currently Bearish with a score of 33.5 percent. The commercials are Bullish with a score of 64.8 percent and the small traders (not shown in chart) are Bearish with a score of 36.8 percent.

Gold Futures StatisticsSPECULATORSCOMMERCIALSSMALL TRADERS
– Percent of Open Interest Longs:50.225.09.8
– Percent of Open Interest Shorts:19.060.75.2
– Net Position:153,240-175,91322,673
– Gross Longs:246,874122,81448,128
– Gross Shorts:93,634298,72725,455
– Long to Short Ratio:2.6 to 10.4 to 11.9 to 1
NET POSITION TREND:
– Strength Index Score (3 Year Range Pct):33.564.836.8
– Strength Index Reading (3 Year Range):BearishBullishBearish
NET POSITION MOVEMENT INDEX:
– 6-Week Change in Strength Index:12.6-14.219.4


Silver Comex Futures:

Silver Futures COT ChartThe Silver Comex Futures large speculator standing this week reached a net position of 31,468 contracts in the data reported through Tuesday. This was a weekly lift of 2,455 contracts from the previous week which had a total of 29,013 net contracts.

This week’s current strength score (the trader positioning range over the past three years, measured from 0 to 100) shows the speculators are currently Bearish with a score of 48.8 percent. The commercials are Bullish with a score of 52.4 percent and the small traders (not shown in chart) are Bearish with a score of 39.7 percent.

Silver Futures StatisticsSPECULATORSCOMMERCIALSSMALL TRADERS
– Percent of Open Interest Longs:43.632.418.2
– Percent of Open Interest Shorts:19.766.87.6
– Net Position:31,468-45,36713,899
– Gross Longs:57,43942,66823,983
– Gross Shorts:25,97188,03510,084
– Long to Short Ratio:2.2 to 10.5 to 12.4 to 1
NET POSITION TREND:
– Strength Index Score (3 Year Range Pct):48.852.439.7
– Strength Index Reading (3 Year Range):BearishBullishBearish
NET POSITION MOVEMENT INDEX:
– 6-Week Change in Strength Index:13.5-12.44.3


Copper Grade #1 Futures:

Copper Futures COT ChartThe Copper Grade #1 Futures large speculator standing this week reached a net position of 16,238 contracts in the data reported through Tuesday. This was a weekly rise of 6,011 contracts from the previous week which had a total of 10,227 net contracts.

This week’s current strength score (the trader positioning range over the past three years, measured from 0 to 100) shows the speculators are currently Bearish with a score of 49.2 percent. The commercials are Bearish with a score of 49.4 percent and the small traders (not shown in chart) are Bullish with a score of 62.6 percent.

Copper Futures StatisticsSPECULATORSCOMMERCIALSSMALL TRADERS
– Percent of Open Interest Longs:42.134.79.9
– Percent of Open Interest Shorts:34.146.06.7
– Net Position:16,238-22,6956,457
– Gross Longs:84,91069,99719,961
– Gross Shorts:68,67292,69213,504
– Long to Short Ratio:1.2 to 10.8 to 11.5 to 1
NET POSITION TREND:
– Strength Index Score (3 Year Range Pct):49.249.462.6
– Strength Index Reading (3 Year Range):BearishBearishBullish
NET POSITION MOVEMENT INDEX:
– 6-Week Change in Strength Index:11.6-14.221.9


Platinum Futures:

Platinum Futures COT ChartThe Platinum Futures large speculator standing this week reached a net position of 23,544 contracts in the data reported through Tuesday. This was a weekly reduction of -7,158 contracts from the previous week which had a total of 30,702 net contracts.

This week’s current strength score (the trader positioning range over the past three years, measured from 0 to 100) shows the speculators are currently Bearish with a score of 40.7 percent. The commercials are Bullish with a score of 59.1 percent and the small traders (not shown in chart) are Bearish with a score of 40.0 percent.

Platinum Futures StatisticsSPECULATORSCOMMERCIALSSMALL TRADERS
– Percent of Open Interest Longs:56.827.911.5
– Percent of Open Interest Shorts:23.768.53.9
– Net Position:23,544-28,9135,369
– Gross Longs:40,38719,8318,162
– Gross Shorts:16,84348,7442,793
– Long to Short Ratio:2.4 to 10.4 to 12.9 to 1
NET POSITION TREND:
– Strength Index Score (3 Year Range Pct):40.759.140.0
– Strength Index Reading (3 Year Range):BearishBullishBearish
NET POSITION MOVEMENT INDEX:
– 6-Week Change in Strength Index:-2.81.611.4


Palladium Futures:

Palladium Futures COT ChartThe Palladium Futures large speculator standing this week reached a net position of -2,751 contracts in the data reported through Tuesday. This was a weekly reduction of -261 contracts from the previous week which had a total of -2,490 net contracts.

This week’s current strength score (the trader positioning range over the past three years, measured from 0 to 100) shows the speculators are currently Bearish-Extreme with a score of 11.9 percent. The commercials are Bullish-Extreme with a score of 86.3 percent and the small traders (not shown in chart) are Bearish with a score of 32.6 percent.

Palladium Futures StatisticsSPECULATORSCOMMERCIALSSMALL TRADERS
– Percent of Open Interest Longs:24.257.114.6
– Percent of Open Interest Shorts:55.424.116.3
– Net Position:-2,7512,902-151
– Gross Longs:2,1255,0251,285
– Gross Shorts:4,8762,1231,436
– Long to Short Ratio:0.4 to 12.4 to 10.9 to 1
NET POSITION TREND:
– Strength Index Score (3 Year Range Pct):11.986.332.6
– Strength Index Reading (3 Year Range):Bearish-ExtremeBullish-ExtremeBearish
NET POSITION MOVEMENT INDEX:
– 6-Week Change in Strength Index:-12.614.3-17.8


Article By InvestMacroReceive our weekly COT Newsletter

*COT Report: The COT data, released weekly to the public each Friday, is updated through the most recent Tuesday (data is 3 days old) and shows a quick view of how large speculators or non-commercials (for-profit traders) were positioned in the futures markets.

The CFTC categorizes trader positions according to commercial hedgers (traders who use futures contracts for hedging as part of the business), non-commercials (large traders who speculate to realize trading profits) and nonreportable traders (usually small traders/speculators) as well as their open interest (contracts open in the market at time of reporting). See CFTC criteria here.

Large Metals Speculators boost their Copper bets into bullish territory

By InvestMacro

Here are the latest charts and statistics for the Commitment of Traders (COT) data published by the Commodities Futures Trading Commission (CFTC).

The latest COT data is updated through Tuesday January 10th and shows a quick view of how large traders (for-profit speculators and commercial entities) were positioned in the futures markets.

Weekly Speculator Changes led by Gold & Palladium

The COT metals markets speculator bets were higher this week as four out of the five precious metals markets we cover had higher positioning while only one market had lower speculator contracts.

Leading the gains for the metals was Copper (14,902 contracts) with Gold (8,869 contracts), Palladium (52 contracts) and Platinum (199 contracts) also showing positive weeks.

The market with a decline in speculator bets for the week was Silver with a drop by -1,921 contracts on the week.

Highlighting the COT metals data this week is the boost the the Copper positions got this week. The large speculator position in Copper futures rose this week for only the first time in the past four weeks but represented the highest one-week gain of the past 64 weeks, dating back to October of 2019.

Copper speculators pushed the overall position back into bullish territory after a week spent in bearish levels on January 3rd. Copper had been in bearish territory in 29 out of the previous 37 weeks before this week’s gain.

The Copper futures price jumped by over 7 percent this week to around the $4.20 per pound level and the highest weekly close since June. Copper is also up by over 30 percent since hitting a recent low in July of 2022. The opening of China’s economy (after discarding its zero-covid policies) has been a positive development for the price outlook as China is one of the leading countries in both producing and consuming Copper.


Data Snapshot of Commodity Market Traders | Columns Legend
Jan-10-2023OIOI-IndexSpec-NetSpec-IndexCom-NetCOM-IndexSmalls-NetSmalls-Index
Gold481,51916150,53533-172,4786621,94335
Silver129,961729,01346-42,9255513,91240
Copper186,3832910,22744-16,253546,02660
Palladium8,35212-2,490112,3378515351
Platinum72,2164330,70250-34,346533,64417


Strength Scores led by Platinum & Silver

COT Strength Scores (a normalized measure of Speculator positions over a 3-Year range, from 0 to 100 where above 80 is Extreme-Bullish and below 20 is Extreme-Bearish) showed that  Platinum (50 percent) leads the metals markets this week. Silver (46 percent) comes in as the next highest in the weekly strength scores.

On the downside, Palladium (11 percent) comes in at the lowest strength level currently and is in Extreme-Bearish territory (below 20 percent). The next lowest strength score was Gold (33 percent).

Strength Statistics:
Gold (32.6 percent) vs Gold previous week (29.7 percent)
Silver (46.1 percent) vs Silver previous week (48.2 percent)
Copper (44.5 percent) vs Copper previous week (32.6 percent)
Platinum (50.4 percent) vs Platinum previous week (50.1 percent)
Palladium (11.3 percent) vs Palladium previous week (10.9 percent)


Gold & Silver top the 6-Week Strength Trends

COT Strength Score Trends (or move index, calculates the 6-week changes in strength scores) showed that Gold (13.4 percent) leads the past six weeks trends for metals. Silver (12.7 percent) is the next highest positive mover in the latest trends data.

Palladium (-6.2 percent) leads the downside trend scores currently and is the only negative mover over the past six weeks.

Move Statistics:
Gold (13.4 percent) vs Gold previous week (8.5 percent)
Silver (12.7 percent) vs Silver previous week (15.6 percent)
Copper (6.6 percent) vs Copper previous week (-6.2 percent)
Platinum (8.7 percent) vs Platinum previous week (10.8 percent)
Palladium (-6.2 percent) vs Palladium previous week (-10.3 percent)


Individual Markets:

Gold Comex Futures:

Gold Futures COT ChartThe Gold Comex Futures large speculator standing this week recorded a net position of 150,535 contracts in the data reported through Tuesday. This was a weekly lift of 8,869 contracts from the previous week which had a total of 141,666 net contracts.

This week’s current strength score (the trader positioning range over the past three years, measured from 0 to 100) shows the speculators are currently Bearish with a score of 32.6 percent. The commercials are Bullish with a score of 65.9 percent and the small traders (not shown in chart) are Bearish with a score of 34.9 percent.

Gold Futures StatisticsSPECULATORSCOMMERCIALSSMALL TRADERS
– Percent of Open Interest Longs:50.623.29.6
– Percent of Open Interest Shorts:19.359.05.1
– Net Position:150,535-172,47821,943
– Gross Longs:243,566111,71846,373
– Gross Shorts:93,031284,19624,430
– Long to Short Ratio:2.6 to 10.4 to 11.9 to 1
NET POSITION TREND:
– Strength Index Score (3 Year Range Pct):32.665.934.9
– Strength Index Reading (3 Year Range):BearishBullishBearish
NET POSITION MOVEMENT INDEX:
– 6-Week Change in Strength Index:13.4-16.532.0


Silver Comex Futures:

Silver Futures COT ChartThe Silver Comex Futures large speculator standing this week recorded a net position of 29,013 contracts in the data reported through Tuesday. This was a weekly reduction of -1,921 contracts from the previous week which had a total of 30,934 net contracts.

This week’s current strength score (the trader positioning range over the past three years, measured from 0 to 100) shows the speculators are currently Bearish with a score of 46.1 percent. The commercials are Bullish with a score of 54.7 percent and the small traders (not shown in chart) are Bearish with a score of 39.7 percent.

Silver Futures StatisticsSPECULATORSCOMMERCIALSSMALL TRADERS
– Percent of Open Interest Longs:43.732.818.4
– Percent of Open Interest Shorts:21.465.87.7
– Net Position:29,013-42,92513,912
– Gross Longs:56,77042,59923,938
– Gross Shorts:27,75785,52410,026
– Long to Short Ratio:2.0 to 10.5 to 12.4 to 1
NET POSITION TREND:
– Strength Index Score (3 Year Range Pct):46.154.739.7
– Strength Index Reading (3 Year Range):BearishBullishBearish
NET POSITION MOVEMENT INDEX:
– 6-Week Change in Strength Index:12.7-13.212.2


Copper Grade #1 Futures:

Copper Futures COT ChartThe Copper Grade #1 Futures large speculator standing this week recorded a net position of 10,227 contracts in the data reported through Tuesday. This was a weekly gain of 14,902 contracts from the previous week which had a total of -4,675 net contracts.

This week’s current strength score (the trader positioning range over the past three years, measured from 0 to 100) shows the speculators are currently Bearish with a score of 44.5 percent. The commercials are Bullish with a score of 54.4 percent and the small traders (not shown in chart) are Bullish with a score of 60.1 percent.

Copper Futures StatisticsSPECULATORSCOMMERCIALSSMALL TRADERS
– Percent of Open Interest Longs:40.137.410.6
– Percent of Open Interest Shorts:34.646.27.3
– Net Position:10,227-16,2536,026
– Gross Longs:74,75369,78719,691
– Gross Shorts:64,52686,04013,665
– Long to Short Ratio:1.2 to 10.8 to 11.4 to 1
NET POSITION TREND:
– Strength Index Score (3 Year Range Pct):44.554.460.1
– Strength Index Reading (3 Year Range):BearishBullishBullish
NET POSITION MOVEMENT INDEX:
– 6-Week Change in Strength Index:6.6-10.026.9


Platinum Futures:

Platinum Futures COT ChartThe Platinum Futures large speculator standing this week recorded a net position of 30,702 contracts in the data reported through Tuesday. This was a weekly advance of 199 contracts from the previous week which had a total of 30,503 net contracts.

This week’s current strength score (the trader positioning range over the past three years, measured from 0 to 100) shows the speculators are currently Bullish with a score of 50.4 percent. The commercials are Bullish with a score of 52.7 percent and the small traders (not shown in chart) are Bearish-Extreme with a score of 17.0 percent.

Platinum Futures StatisticsSPECULATORSCOMMERCIALSSMALL TRADERS
– Percent of Open Interest Longs:60.626.59.5
– Percent of Open Interest Shorts:18.174.04.4
– Net Position:30,702-34,3463,644
– Gross Longs:43,74519,1286,832
– Gross Shorts:13,04353,4743,188
– Long to Short Ratio:3.4 to 10.4 to 12.1 to 1
NET POSITION TREND:
– Strength Index Score (3 Year Range Pct):50.452.717.0
– Strength Index Reading (3 Year Range):BullishBullishBearish-Extreme
NET POSITION MOVEMENT INDEX:
– 6-Week Change in Strength Index:8.7-7.0-11.4


Palladium Futures:

Palladium Futures COT ChartThe Palladium Futures large speculator standing this week recorded a net position of -2,490 contracts in the data reported through Tuesday. This was a weekly lift of 52 contracts from the previous week which had a total of -2,542 net contracts.

This week’s current strength score (the trader positioning range over the past three years, measured from 0 to 100) shows the speculators are currently Bearish-Extreme with a score of 11.3 percent. The commercials are Bullish-Extreme with a score of 84.7 percent and the small traders (not shown in chart) are Bullish with a score of 50.9 percent.

Palladium Futures StatisticsSPECULATORSCOMMERCIALSSMALL TRADERS
– Percent of Open Interest Longs:25.353.316.3
– Percent of Open Interest Shorts:55.125.314.5
– Net Position:-2,4902,337153
– Gross Longs:2,1144,4521,362
– Gross Shorts:4,6042,1151,209
– Long to Short Ratio:0.5 to 12.1 to 11.1 to 1
NET POSITION TREND:
– Strength Index Score (3 Year Range Pct):11.384.750.9
– Strength Index Reading (3 Year Range):Bearish-ExtremeBullish-ExtremeBullish
NET POSITION MOVEMENT INDEX:
– 6-Week Change in Strength Index:-6.24.612.6


Article By InvestMacroReceive our weekly COT Newsletter

*COT Report: The COT data, released weekly to the public each Friday, is updated through the most recent Tuesday (data is 3 days old) and shows a quick view of how large speculators or non-commercials (for-profit traders) were positioned in the futures markets.

The CFTC categorizes trader positions according to commercial hedgers (traders who use futures contracts for hedging as part of the business), non-commercials (large traders who speculate to realize trading profits) and nonreportable traders (usually small traders/speculators) as well as their open interest (contracts open in the market at time of reporting). See CFTC criteria here.