The new U.S. Administration may have hastened some economic and market trends, but the underlying factors were already underway. Inflation has been picking up since last July; the U.S. consumer has been pulling on the reins for months now amid tapped-out credit; the Federal government has been careening towards a debt crisis.
The stock market was ripe for a correction, bonds have been weak, while gold had been on a tear for a couple of years. The new administration’s actions and policies, and the uncertainty created by them sparked some of these developments, but the trends were already underway.
The Move To Global Markets Starts
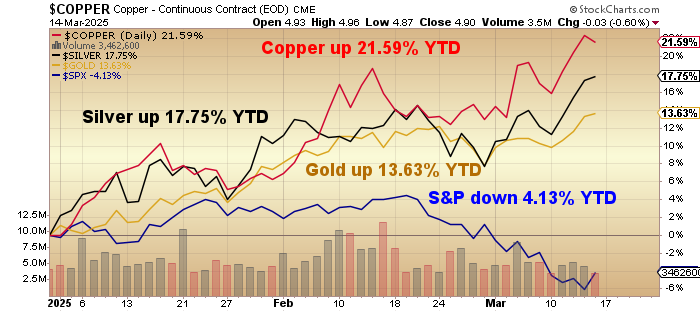
For the first time in several years, the U.S. market is underperforming global equities. The S&P fell 4.6% and Nasdaq just over 10% for the quarter, while stocks outside the U.S. rose 4.6% (per the Morgan Stanley-Capital International World ex-U.S. Index). Most European markets were up by the mid-teens, while most of Asia fell, with Hong Kong (up 15%) and Singapore (up 6.6%) the major exceptions. Tech stocks were the biggest losers.
Our global accounts outperformed the indexes, with our mid-risk growth accounts up just over 16% for the quarter.* (See disclosures below.)
Conservative accounts were up somewhat less — virtually 12% — and more aggressive accounts a tad more. In all cases, however, our global accounts outperformed the benchmarks. The main reasons were a low exposure to the U.S. markets and above-weight exposure to Hong Kong and Singapore, while a high allocation to gold stocks also clearly helped. Going forward, we expect these same factors to help us in the next quarter or more.
Gold Stocks Have Started To Move, Seniors First
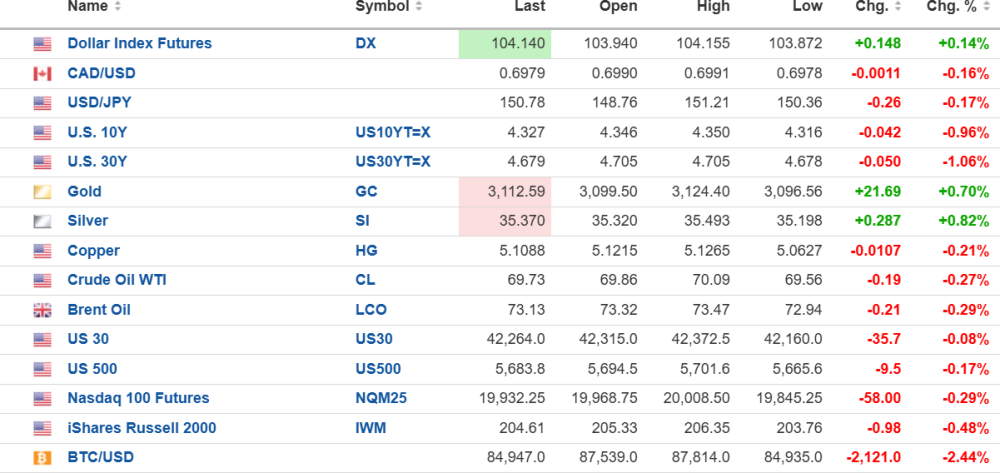
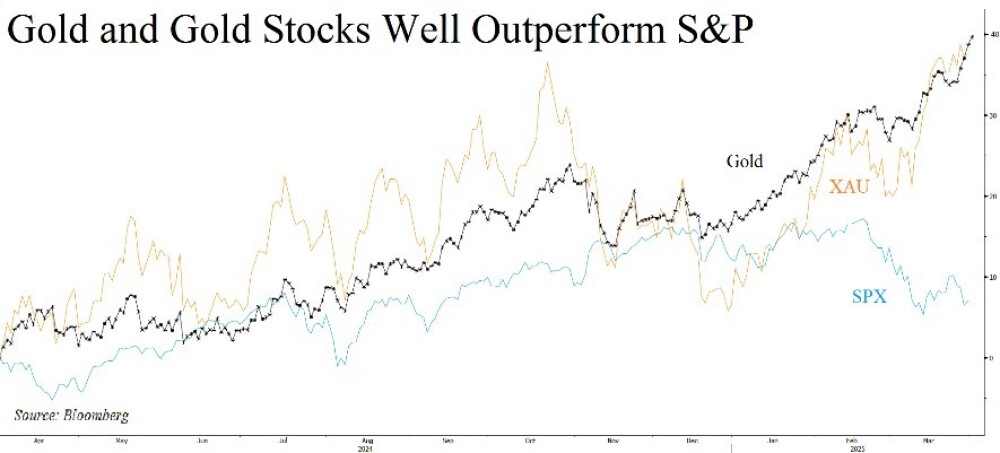
As always, commodities were mixed, with the complex up just under 8% (per Bloomberg Commodity Index). Gold, silver, and copper led the metals, while natural gas was also strong. Oil was essentially flat. The major gold stocks finally outperformed the metal; while gold rose 20% in the first quarter, the senior gold stocks (per the XAU) jumped 29%.
Though our resource accounts, up 17.5%, well outperformed the resource index, our gold accounts, up 17.4%, lagged. The main reasons our resource accounts outperformed were a high exposure to the top-performing gold, silver, and copper and a low exposure to oil.
In gold accounts, our exposure to smaller companies hurt relative performance since these smaller stocks have barely budged as the seniors surged ahead. This will change as the bull market develops and retail investors return to the sector. In addition, the most leveraged stocks can have the most dramatic moves early on, but they don’t sustain those moves.
Uncertainty and Volatility Lie Ahead
The last quarter provides a look at what we can expect over the next four years, including a high degree of uncertainty. One thing is certain, though: it won’t be like the last four years.
The markets will be unpredictable and volatile, and the winners of the last four years — U.S. stocks, tech, and the dollar — may not be the winners of the period ahead.
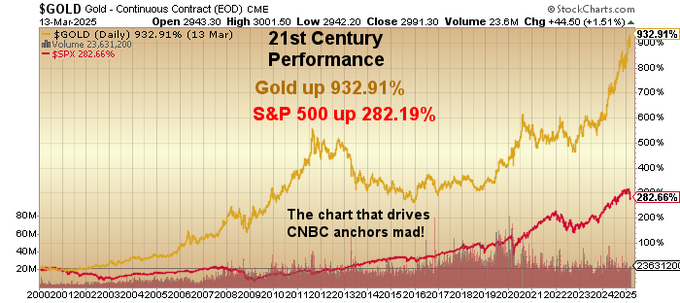
Gold, which has actually gained more than the S&P Index over the past four years, may continue to shine: it responds well to uncertainty, whether geopolitical, economic, or monetary.
Much of this uncertainty arises from what is known as the “Mar-A-Lago Accord,” notwithstanding that the primary author has walked back its import in recent weeks.
The “Accord” refers to a set of economic and monetary policies espoused by various people around President Trump to reset the global financial system. It is not (yet) a complete, specific plan.
Rather, it is a collection of ideas, some well-formulated, some aspirational, and some conflicting.
Security Will Be Linked With Debt
The aims behind the so-called “Accord” are to lower debt and interest payments, get foreign countries to pay more and end what is viewed as foreign countries living off the U.S., end what is deemed “persistent dollar overvaluation,” and bring manufacturing back to the U.S.
Among the ideas put forward is the concept advanced by Treasury Secretary Scott Bessent to monetize the U.S.’s assets, including revaluing the U.S. gold reserves. The idea has been floated of using government assets as collateral for loans, thus — theoretically, at least — reducing the interest rate required to be paid on these loans. Another proposal would require foreign governments to exchange Treasuries that they hold for 50-year, non-tradeable, zero-coupon bonds. In exchange, these countries would receive the military protection of the U.S. and access to U.S. market.
Many of the ideas came in a paper last November written by now-Chairman of the White House Council of Economic Advisors Stephen Miran, in which he termed the phrase “Mar-A-Lago Accord,” a riff on the 1985 Plaza Accord. He has since tried to walk back the idea of a restructuring of the global financial system, saying that his paper was “a catalog of available options…(not) the source of the policy agenda.” He added that the paper presented “various recipes (but) the President is the chef.”
We have seen specific moves towards some of this with the Trump tariffs, as well as demands for European nations to pay more towards NATO and the defense of Europe, but as yet no holistic plan towards implementing the restructuring of the global financial system. But whether it comes in one grand scheme or piecemeal, policy is moving in that direction. The implications for markets — let alone geopolitics and the global economy — are vast and wide-ranging.
Respected advisor Jim Bianco hit the nail on the head when he warned, “Don’t take this literally, but do take it seriously.”
Having the Reserve Currency Comes With Benefits
The thinking behind some of the aims is real, if one-sided and exaggerated. But one fundamental is wrong or, at minimum, incomplete. Having the world’s reserve currency carries costs and obligations, but it also enables the country to print more money than it otherwise could, knowing that other countries will buy its debt.
Thus, it increases the country’s standard of living and exports inflation. This comes at the cost of a higher value of the currency, hurting exports and domestic industry. It is not for nothing that having the world’s reserve currency has been called (by then-French Finance Minister Valéry Giscard d’Estaing) “the exorbitant privilege.”
One major problem with having that privilege is what happens when one starts to lose it (in this case, either because other countries start to turn away from using the dollar or when the U.S. itself tries to lower the dollar’s value): money held abroad starts to come back, increasing inflation; imports become more expensive; interest rates increase (because other countries are less inclined to hold U.S. debt); and the debt becomes an intolerable burden. Look at what happened to Britain after 1945.
In 1985, at the time of the Plaza Accord, allies Japan, Taiwan, Canada, and Germany had the largest trade surpluses with the U.S. Today, China has the largest trade surplus with the U.S., while Vietnam has the third largest (Mexico the second), and they will not so readily succumb to U.S. carrots or sticks. Certainly, the leading trade surplus countries in 1985 relied on U.S. security, but that is not the case with many of today’s leading surplus countries. Similarly, the countries with the largest holdings of long-term Treasuries are not likely to take kindly to these threats. So, it is not even clear that a new currency accord would even work today, and certainly not with the agreement of leading trading countries.
Moves Could Hurt the Treasury Market
The mere idea of such a proposal is hardly an incentive for governments to buy more U.S. bonds, and is likely to only speed up the move away from the dollar in foreign central bank reserves. In the short term, this may well help depress the value of the dollar (over what it otherwise would be). And it would also make it more difficult for the U.S. to sell long-term bonds, thus driving up yields at the long end.
There is already an impending debt crisis in the U.S., rapidly moving towards denouement. The U.S. is issuing most of its debt in the short term because there is a shortage of traditional buyers of long-term bonds. The Treasury would have difficulty selling long-term bonds of any size without a meaningful increase in the interest paid.
The government has been doing this increasingly over the past 16 years after missing the opportunity to issue ultra-long-dated bonds when interest rates were at zero. This is a crisis that has to be dealt with, and probably before the end of this year, with or without broad restructuring and policy changes. It will likely lead to the end of Quantitative Tightening (QT) and another round of Quantitative Easing (QE).
The Fed is Changing Policy
This shift is already underway. Earlier in the month, the Federal Reserve decided to reduce the pace of the roll-off from the Fed’s balance sheet. While not changing the reduction in mortgage-backed securities, the Fed slashed the rate of the roll-off in Treasuries from an already-cut $25 billion a month to just $5 billion.
Given a balance sheet of $6.76 trillion ($4.23 trillion of which is in Treasuries), Bill Fleckenstein is right to call this “a rounding error.” The balance sheet remains higher, by more than 60%, from where it stood on the eve of COVID-19, despite three years of QT.
During his post-meeting press conference, Fed Chairman Jerome Powell was at pains to say repeatedly that nothing should be read into this. It was to do with money markets, he said, or maybe to do with the debt
ceiling, but “don’t take any signal from it.” That is just plain nonsense. This move is clearly to help the long-term Treasury market, which already has few buyers at current rates. Powell himself said the Fed would stop the reduction in Treasury holdings “at some point.” In my view, it is a precursor to a new round of QE from the Fed, likely later this year. It may not be called QE, but that is what it will be.
Whether we see just QE and tariffs or a broader set of policies, depending on whether they are implemented successfully, they would likely lead to more stock market weakness (probably after a near-term contrarian rally), bond market weakness, and some dollar weakness. But every one of these policies would be gold positive, if only by increasing uncertainty, both in the near term as well as over the longer term. Gold reacts positively to chaos and uncertainty, to disruption and volatility.
A Change in the Monetary System Presages Commodity Bull Market
Not only gold but also commodities will generally likely respond positively.
As analysts Goehring & Rozencwajg have noted, every past commodity bull market has been set in motion by a shock to the global monetary system, citing 1929 (end of the return to the gold standard), 1969 (end of Bretton Woods) and 1999 (end of the dollar pegs).
“A major shift in the global monetary system may be imminent,” and commodities are already responding to this, although fundamentally, commodities are as low relative to financial assets as they have been at any time in the last 100 years, cheaper even than at those three previous points of extreme under-valuation.
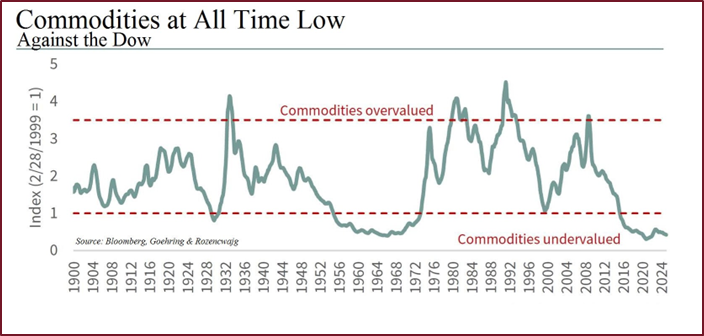
I must quote Goehring & Rozencwajg: “If gold is the canary in the coal mine, it is singing loudly.”
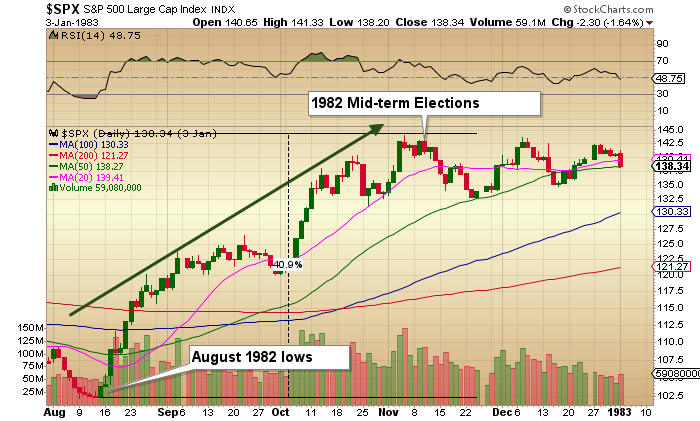
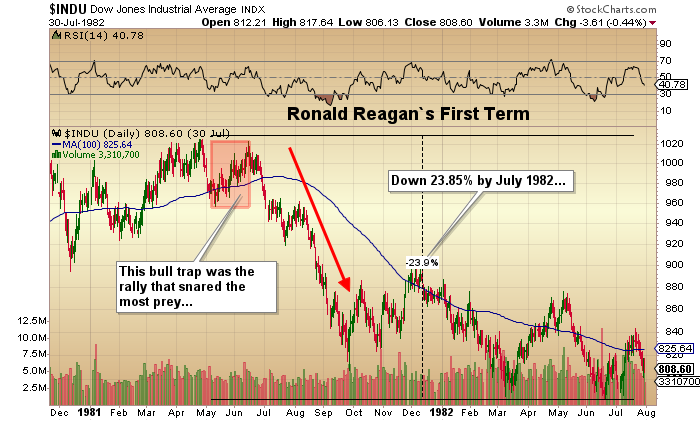
Each of those previous troughs in commodity prices against financial asset prices was followed not only by strong bull markets in commodities but also by weakness in stocks. In less than three years after the market crash in October 1929, the Dow fell 88%; stocks were still trading below their 1969 peak seven years later; while the S&P did not exceed its dot-com bubble highs until 2007, and then only very briefly, not to move sustainably higher until 2013.
The stock Rotation is Underway
U.S. stocks have been overvalued and extended for some time, with high valuation multiples, very narrow breadth, weak market internals, and so on. The February correction is but a beginning to what I expect will be an extended period of decline and rotation out of the erstwhile leaders and into markets and sectors that have lagged, or that offer attractive valuations.
(To be clear, we could see a contrarian bounce in the immediate term — the mid-March rally was very meager — but further out, we suspect the S&P will be lower.)
Respected market analyst John Hussman says that by many measures, the U.S. stock market is more overvalued today than even in 1999 or 1929. Price to sales; market cap vs GDP; market cap to Gross Value- added: all these and more show a market at historic valuation extremes. Other indicators, such as market breadth, support that assertion, while margin levels and excess speculation suggest a market that could drop sharply.
If we do see an extended period of weakness in the stock market, history would suggest that short-term Treasuries and gold are the assets most likely to do well. Other commodities also often do well. And even
within equities, some markets and sectors start to outperform as the old leaders fall. These include defensive and dividend-paying stocks, as well as small-cap value.
Global Stocks Start to Outperform
Global markets could also benefit from the weakness in the U.S. market; they have experienced the longest period of underperformance relative to the U.S. ever. The turn is beginning. Stocks outside the U.S. (per Morgan Stanely-Capital International World Ex-U.S. Index) are up 6.5% this year, against a negative 5% plus for U.S. stocks. European stock markets have done even better, up in the mid-teens this year.
In the U.S., growth stocks, which have dramatically and consistently outperformed value since the Great Financial Crisis, the trends have reversed, with value now outperforming growth and small-cap value even more so.
These styles, sectors, and markets are the ones that should outperform in the next period. The extent to which various groups outperform depends largely on how the dollar, interest rates, inflation, and other economic factors perform. Rising interest rates would dampen returns on dividend-paying stocks, while a declining dollar should help emerging markets, for example.
But as per above, the sector most likely to outperform is the commodity sector, and within that, gold has the best risk-reward. Though commodities generally are likely to outperform, they have a risk that gold does not, namely a sharp economic slowdown in China and global economic retraction.
Gold Drivers Remain Intact
Gold, however, does not have that risk. We have discussed several times over the past many quarters why gold has been going up. We do not see the drivers for gold demand changing, be it central banks buying to diversify their reserves amid increased dollar weaponization or Chinese consumers concerned at the loss of purchasing power and a fragile banking system. Western investors are concerned about political uncertainty amid unsustainably high debt levels in many governments.
None of this is likely to change, and gold thus is likely to be higher a year from now, notwithstanding the possibility of a pullback at some stage. Gold has moved well above trend line, but there is yet no manic buying, certainly not in North America; premiums on coins and bars tell the opposite story.
Why Are the Stocks Lagging?
The main investor concern of the past couple of years has been the disconnect between bullion and gold equities. Though the major gold stocks are up nearly 40% over the past 12 months — that’s five times the return on the S&P over the same period! — they have only just matched gold’s returns and not exhibited the traditional leverage. At the same time, many intermediate and junior gold stocks have barely budged.
As we have explained previously, this is not surprising given where the demand for gold has come from. Whether it is central banks, Chinese consumers worried about their economy, or global investors concerned about uncertainty amid high debt levels, these buyers will focus on bullion, not gold miners.
Stock Rotation Will Benefit Gold Stocks
We can now see the first beginnings of a turn. Finally, the largest gold equity ETF, the VanEck Gold Miners ETF (GDX), has reported some net inflows.
This was a single day in mid-March, the first and only reported net inflow this year. Though it was just $6.4 million of inflows, and the subsequent two weeks have seen $317 million in net outflows — the fund has lost $1.99 billion in assets this year — it is a small sign of an impending shift. (See table)
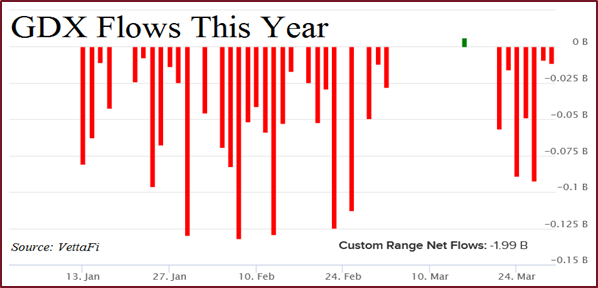
As a contrarian indicator, this is hopeful.
Further declines in the broad market will see money flow to undervalued sectors, including gold stocks. With the gold stocks having outperformed the S&P five-fold over the last year — did you read about that in The Wall Street Journal or hear it on CNBC? — With gold at record highs and mining company margins expanding, the broad investing public is going to notice sooner or later.
And despite the price moves, the valuations of the gold miners remain, in many cases, near their long-term lows.
Top Resource Sectors Have Supply Constraints
Other commodities may also do well. We favor the resources with growing demand and supply constraints.
Among these, copper and uranium stand out. The copper price has now moved above previous highs of 2010 to new all-time highs on the growing appreciation of a pending deficit by the end of this decade.
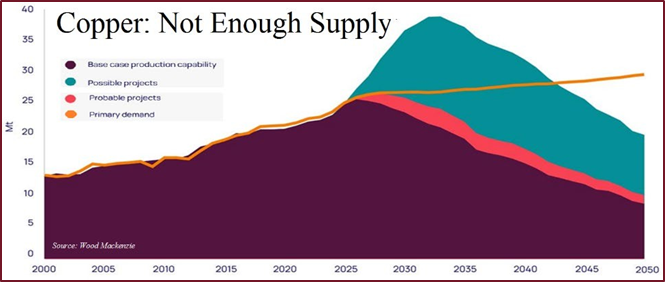
The huge potential increases in demand for copper from electrification, EVs, and AI are well known, but significantly, these uses represent only a relatively small part of the demand for copper over the next decade.
Even if EV adoption slows dramatically and the build-out for power for AI is behind us, demand for copper will continue to grow and exceed probable new supply. As we have written before, given the very long lags in bringing new copper online, the likely copper supply five or even 10 years into the future can be estimated with relative accuracy. There will not be enough copper in five years to meet demand.
The biggest risk to copper is on the demand side: a significant slowdown in China, which still purchases nearly two-thirds of the world’s copper. Longer term, there could be new technologies that speed up discovery and development, and in the U.S., the acceleration of the permitting process will bring some projects into production sooner. But none of this will meaningfully affect the global copper supply over the next five years.
Uranium Decline Is Short Term
The uranium price has declined from $95/lb to $65 over the past year. The liquidation of a physical fund (in Kazakhstan) put supply on the market somewhat indiscriminately. This came amid repeated references by the first candidate, then President Trump, to denuclearization. The last time the superpowers decommissioned nuclear warheads was in the late 1980s; it was followed by a sustained period of low uranium prices.
For various reasons, even if it were to happen, any new “Megatons to Megawatts program” would be relatively small, would be years in the future, and would be offset by increasing demand from end users amid growing realization that nuclear energy is the answer to the world’s energy problems. It is the cleanest, safest, most reliable, and lowest cost form of energy.
It must be emphasized that the decline in the uranium price is due to the spot price, which is far less significant than contract prices. Most uranium is sold on long-term contracts, since for the power plant end user, reliability of supply is more important than price.
A year ago, the spot price moved far above the contract price amid heavy speculation. As that speculative buying has unwound, the spot price is now back more-or- less to where contracts are priced, and attractive buying level once again. It should also be noted that the current uncertainty about tariffs has led to a slowdown in new contracts being signed. The need for the material remains, however, and we expect to see a pick-up in new contracts, which should see prices firm.
Overall, we are cautious about U.S. and major developed market financial assets, preferring to find attractive holdings mostly in smaller companies and smaller markets, always on a bottom- up approach. At the same time, we are increasing exposure to the commodity space, holding gold exposure while broadening the range of resources held. On balance, we expect to see cash holdings increase over the next few months as uncertainly increases.
Review of Individual Accounts
Global Accounts:
We have lowered our cash holdings in most accounts (though more conservative global accounts still have over 11% cash) as we took advantage of recent declines in global stock markets and topped up resource exposure.
Though we employ a bottom-up approach to stock picking, our largest exposures continue to be in Hong Kong and Singapore as we continue to reduce exposure to the U.S. market, including further trimming of Business Development Companies, which nonetheless remain a large holding for most accounts.
We exited a British banknote printer after a strong rally amid takeover activity. We also trimmed many stocks for various clients, depending on risk tolerance, cash levels, and overall portfolio weightings.
Adding to Japan:
With proceeds, we added to some Japanese companies in particular; the entire market seems ready for a move. And we bought two new companies, an intriguing property developer in southern Manhattan, and an innovative finance company, based in Canada, but operating both there and in the U.K. The long-term prospects for both are attractive.
Going forward, we expect to raise cash as we will be a little quicker to take profits in the current uncertain outlook, but will as always continue to look globally for quality companies that are undervalued. All global accounts retain high exposure to resources, particularly gold.
Gold Accounts:
Our gold accounts remain fully invested, with the same broad allocations to the different groups in the gold space. Allocation to large miners and senior royalty companies increased to 30% of accounts, as we added to some of the best companies for underweight accounts. The allocations to silver and exploration remained at little less than one-third each, with the rest to intermediate companies.
Other than a couple of small companies owned by few clients, we did not exit any holdings this quarter. Most of our selling was reducing positions to an intermediate that had rallied and to a large but trouble development company in Nevada. Otherwise, we trimmed various positions for different clients on rallies, mostly for clients overweight in a particular stock.
This provided us with cash to add a couple of smaller companies — a developer in an attractive part of Ontario and potential takeover target; and an exploration company in the high-potential southern Andes.
In addition, we added extensively to a U.S. company looking to bring back into production the U.S.’s most prolific historic gold mine, the Homestake mine.
Looking forward, we expect to remain fully invested, with a continued emphasis on larger, high-quality miners and royalty companies. We will continue to trim overweight positions, giving accounts cash with which to buy new opportunities. As the market develops, we will increase allocation to intermediates and smaller companies which tend to have higher potential, but usually have their strongest moves as the market matures.
Resource Accounts:
Our resource accounts are also fully invested, with gold, copper, and silver continuing to be our largest exposures. We are underweight oil and gas, but continue to add slowly to quality names on weakness, mostly in the intermediate size companies, and are also, once again, accumulating uranium holdings.
This quarter we had no wholesale sells, though did, as always, trim some positions for select clients. With cash, we added one copper company — returning to it again on stock price weakness — and have also been adding aggressively to a company with an advanced copper exploration project in Arizona.
Looking ahead, we expect to remain fully invested, with gold, copper and silver continuing to be our top individual resources, though we are also accumulating uranium again after a significant decline. Our focus is on resources with supply constraints in addition to demand growth.
In sum, with the increased uncertainly in the political and economic outlook amid a possible restructuring of the global monetary system, as the U.S. careens towards a funding crisis, it is time to be more defensive, to reduce exposure to the U.S. equity and bond markets, and increase exposure to uncorrelated global markets; to defensive stocks; and to commodities, particularly gold.
* Please note: Past performance is no guarantee of future results. For complete information on our past performance, including factors to be considered in viewing past performance and other disclosures, please contact our office. Specific stocks mentioned herein are intended solely as illustrative of strategies and types of stocks we are buying or selling, and are not intended as indicative of entire portfolios or of any individual client’s portfolio. The numbers mentioned represent our composite averages. They represent all accounts that fall within the stated objectives which have the ability to buy and sell options; they exclude accounts under $25,000 and accounts with significant limitations or restrictions that would make them unrepresentative of the account type. Performance figures for composites reflect the deduction of administrative fees, but do not take into account any performance fee that may be charged for the period stated.
The performance of any individual stock or stocks does not take into account fees. Performance numbers include dividends; dividends are not reinvested. Commissions charged may vary depending on the brokerage firm at which an individual account is held. All accounts are managed individually and are therefore different, even within the same broad objective. Factors such as an individual’s circumstances, the size of the portfolio, and the time the account opened can affect specific buy and sell decisions. Factors such as price movements and security liquidity can affect whether any trade is made for all accounts. Global Strategic Management, an SEC-registered investment advisor, does business as Adrian Day Asset Management.


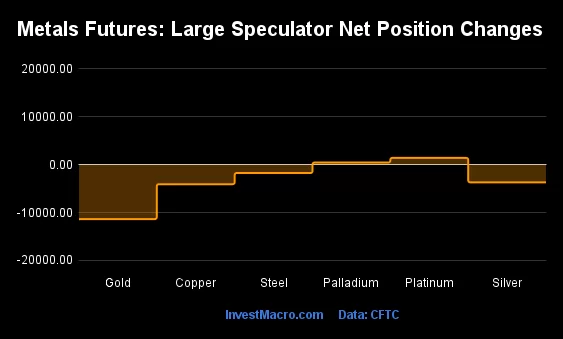
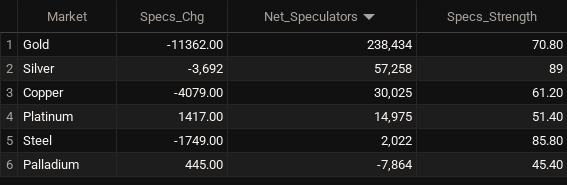
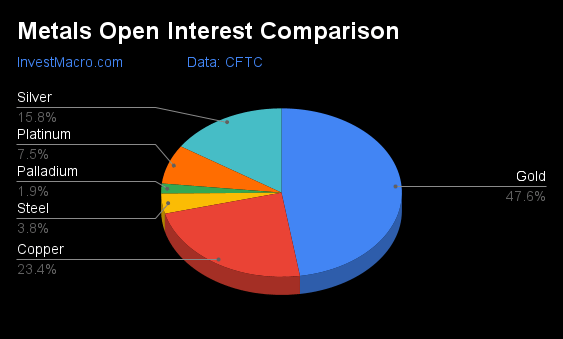
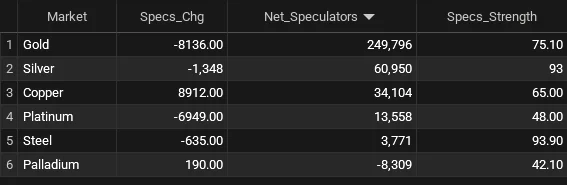
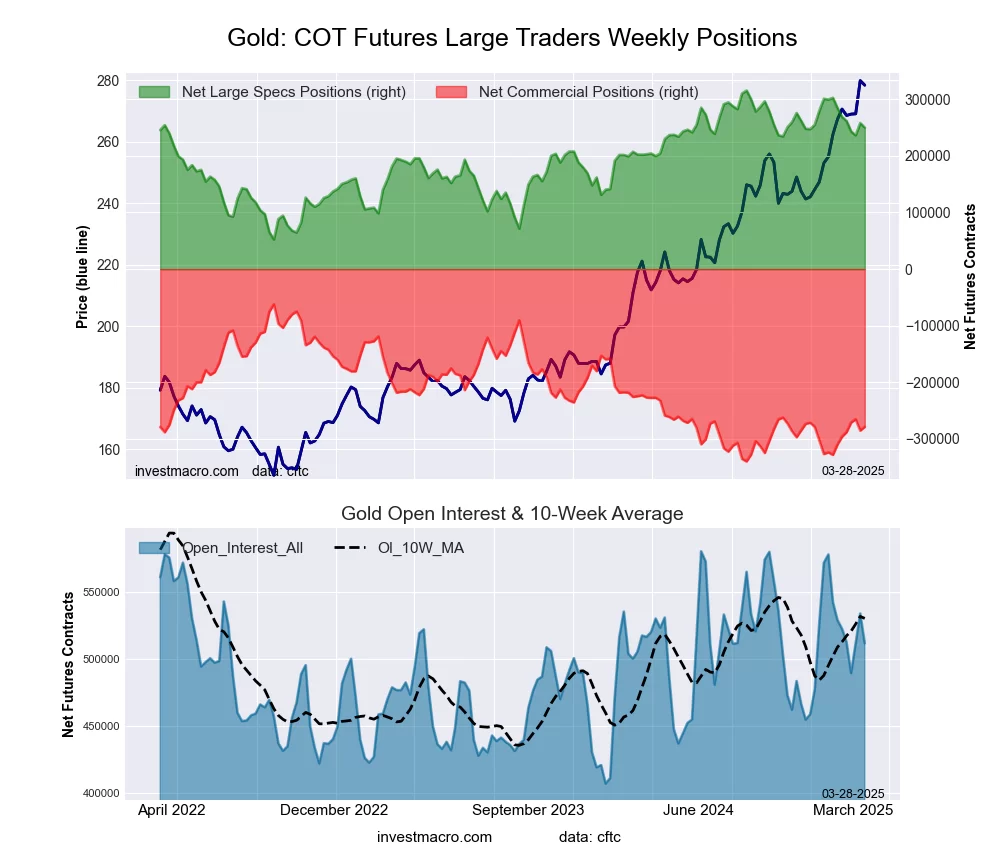
 The Gold Comex Futures large speculator standing this week totaled a net position of 200,715 contracts in the data reported through Tuesday. This was a weekly fall of -37,719 contracts from the previous week which had a total of 238,434 net contracts.
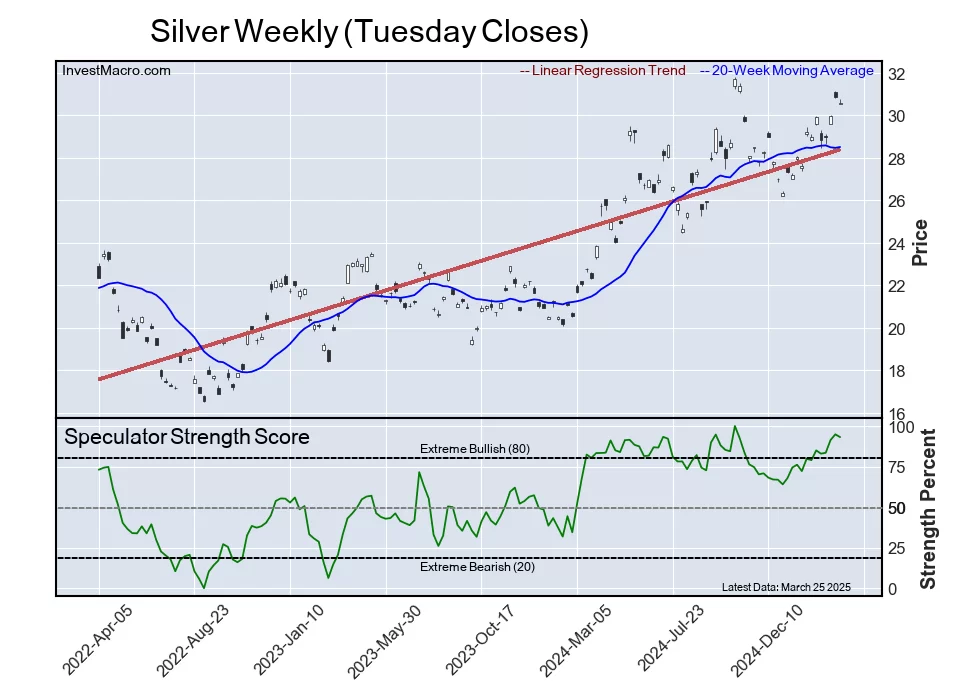
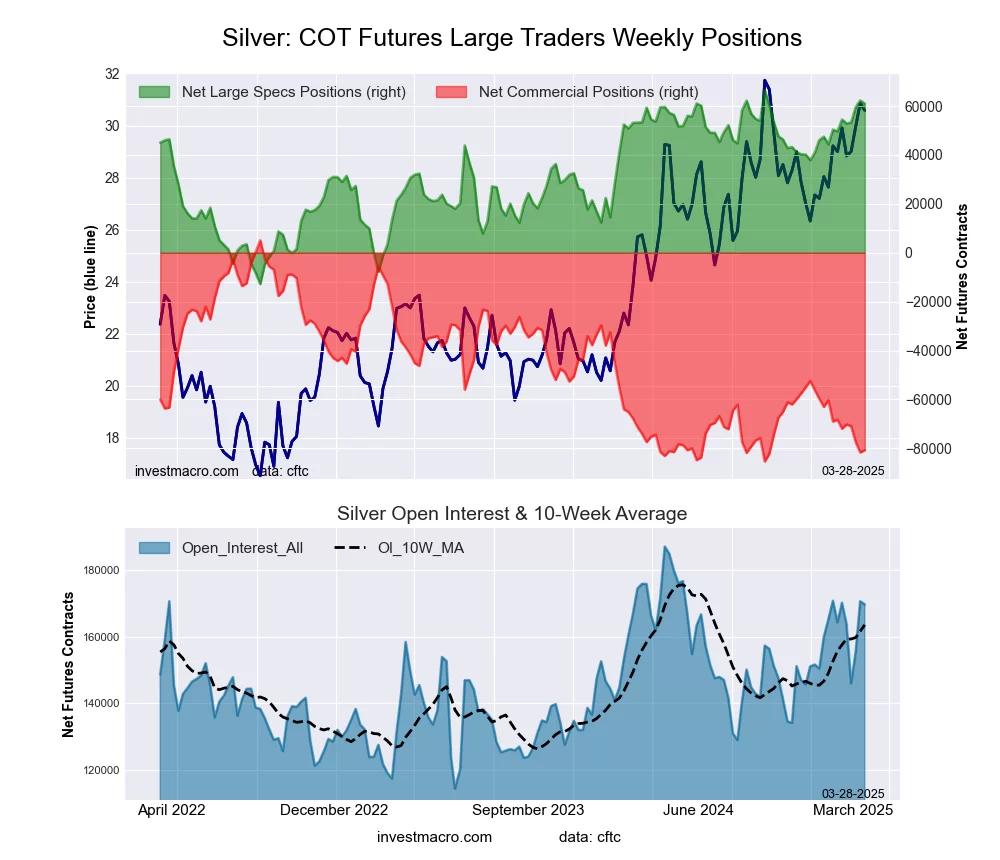
 The Silver Comex Futures large speculator standing this week totaled a net position of 46,516 contracts in the data reported through Tuesday. This was a weekly fall of -10,742 contracts from the previous week which had a total of 57,258 net contracts.
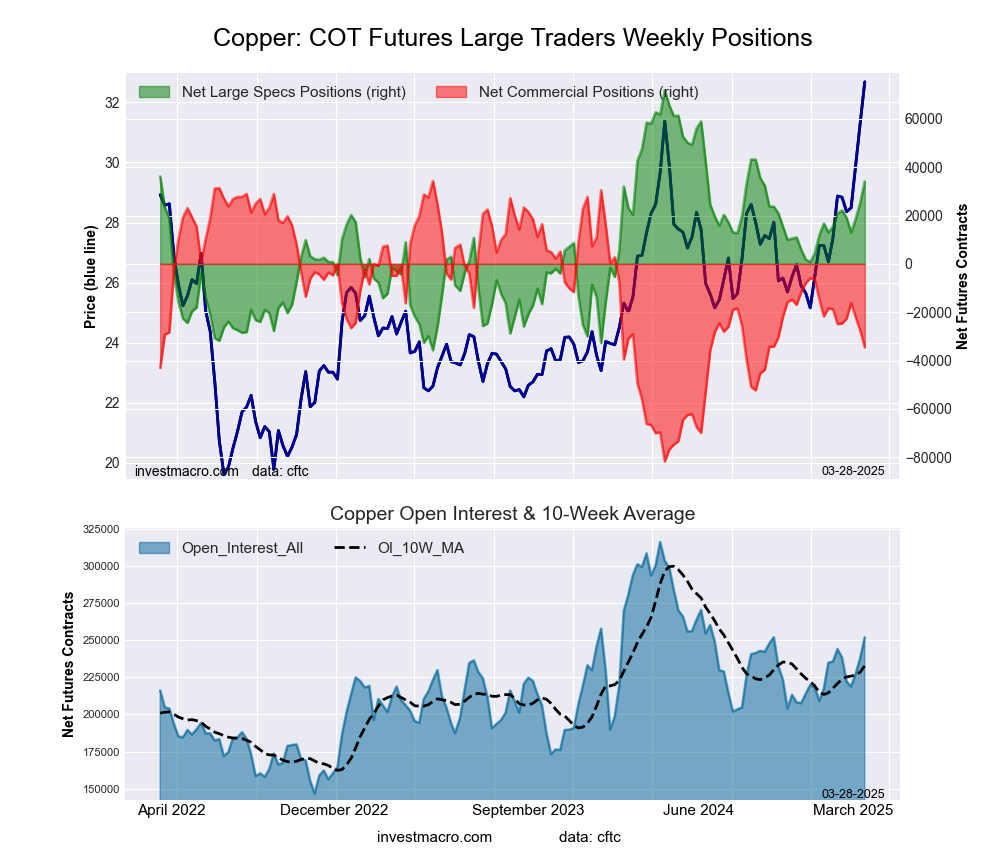
 The Copper Grade #1 Futures large speculator standing this week totaled a net position of 24,241 contracts in the data reported through Tuesday. This was a weekly lowering of -5,784 contracts from the previous week which had a total of 30,025 net contracts.
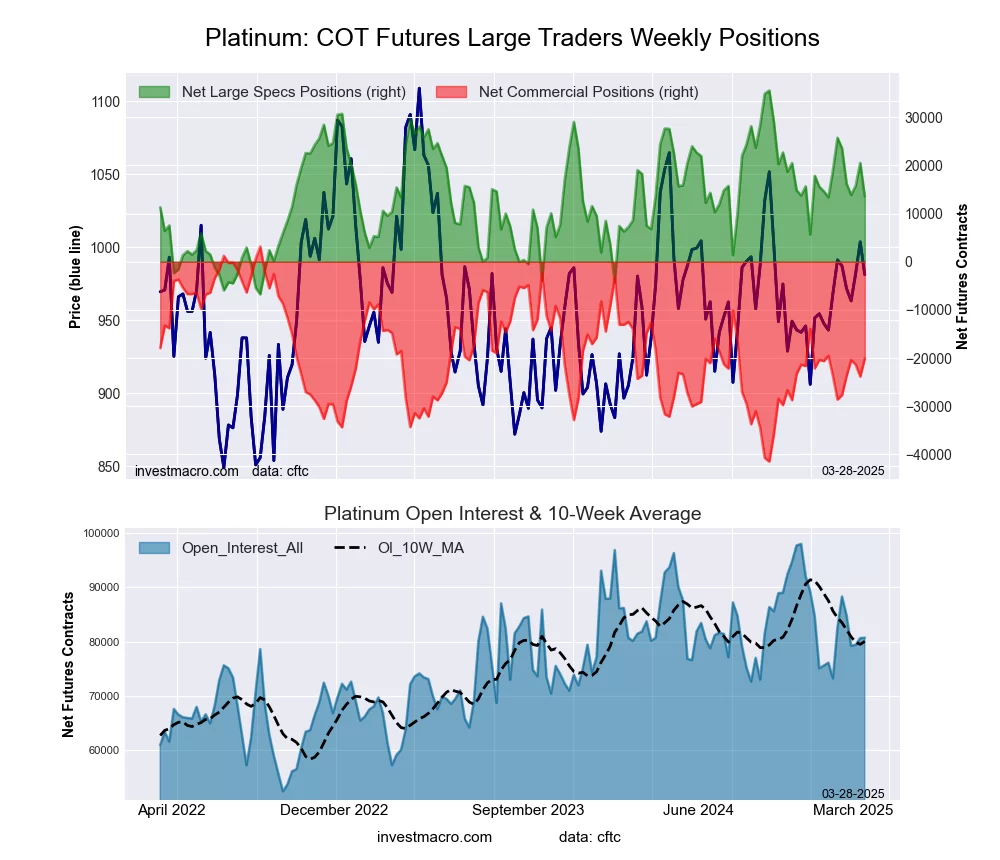
 The Platinum Futures large speculator standing this week totaled a net position of -794 contracts in the data reported through Tuesday. This was a weekly decline of -15,769 contracts from the previous week which had a total of 14,975 net contracts.
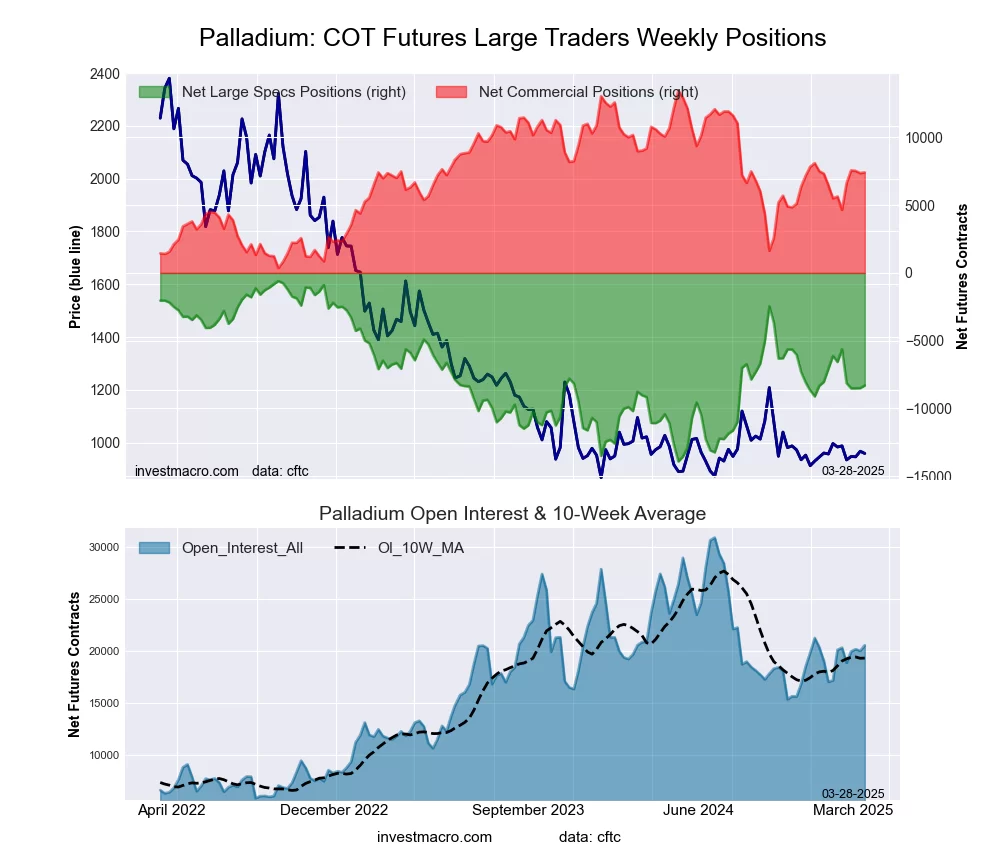
 The Palladium Futures large speculator standing this week totaled a net position of -10,728 contracts in the data reported through Tuesday. This was a weekly decline of -2,864 contracts from the previous week which had a total of -7,864 net contracts.
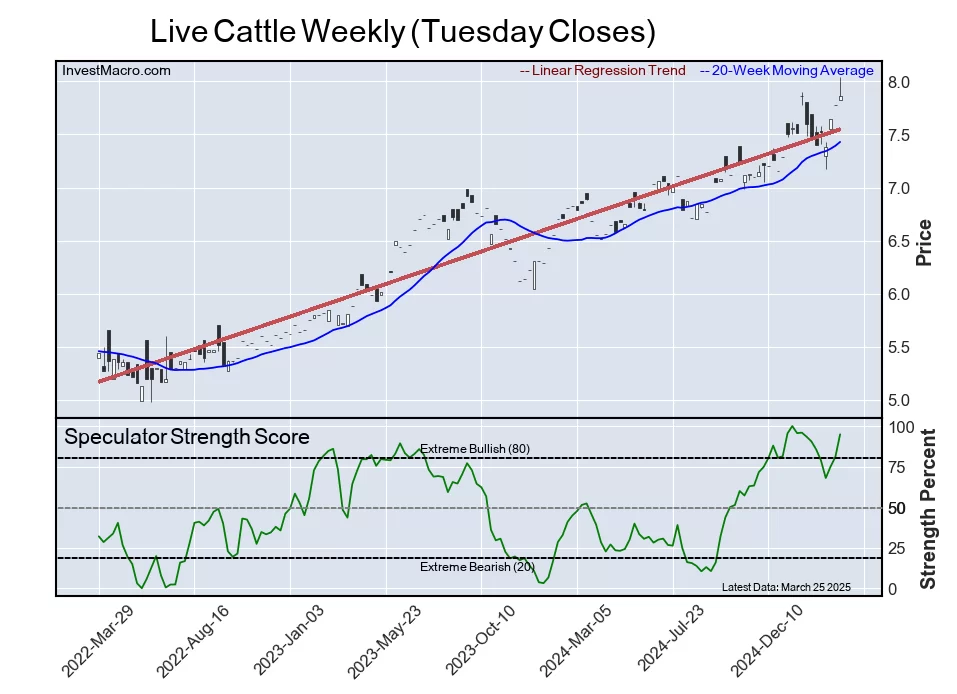
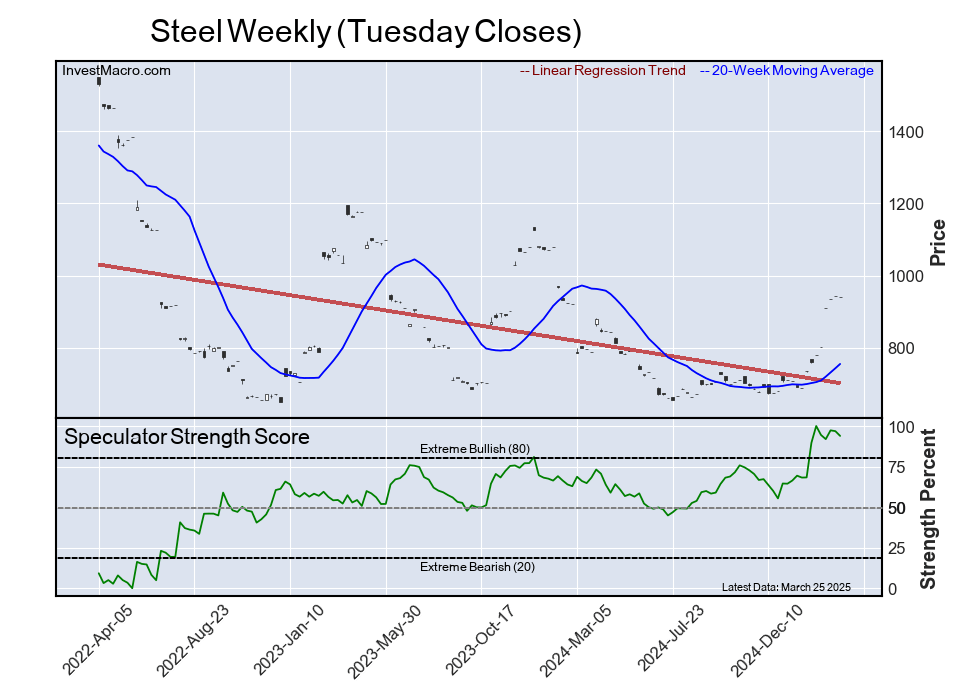
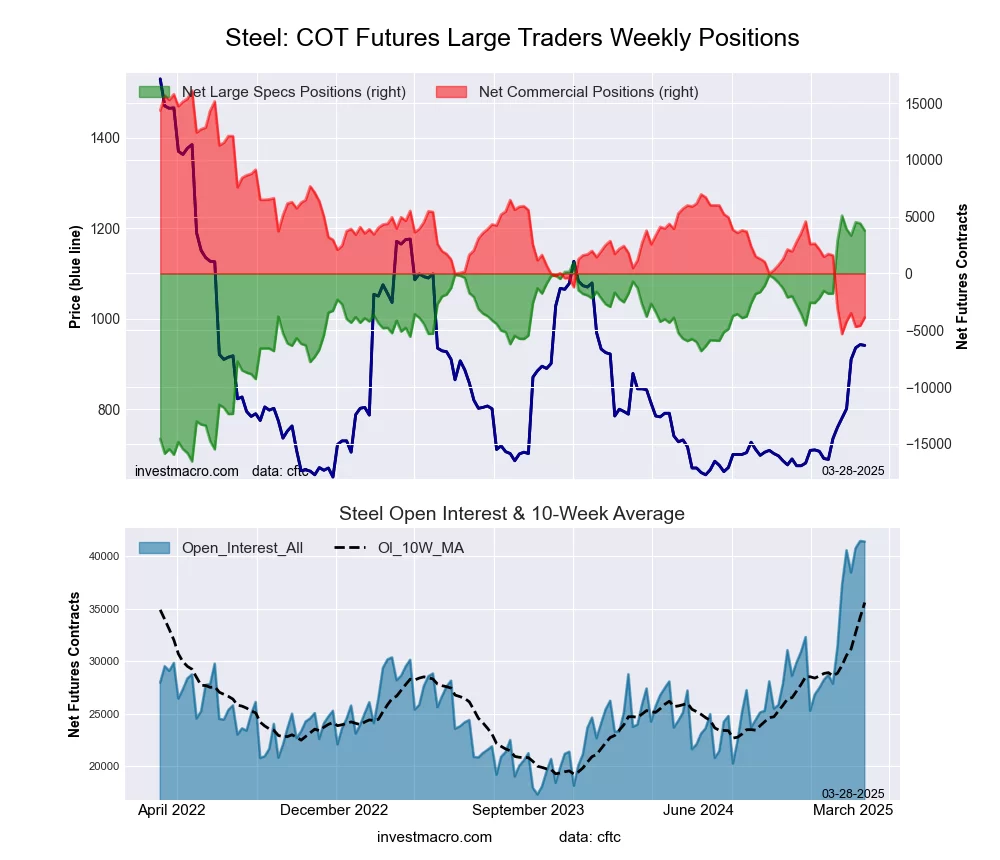
 The Steel Futures large speculator standing this week totaled a net position of 1,704 contracts in the data reported through Tuesday. This was a weekly fall of -318 contracts from the previous week which had a total of 2,022 net contracts.