By InvestMacro
Here are the latest charts and statistics for the Commitment of Traders (COT) data published by the Commodities Futures Trading Commission (CFTC).
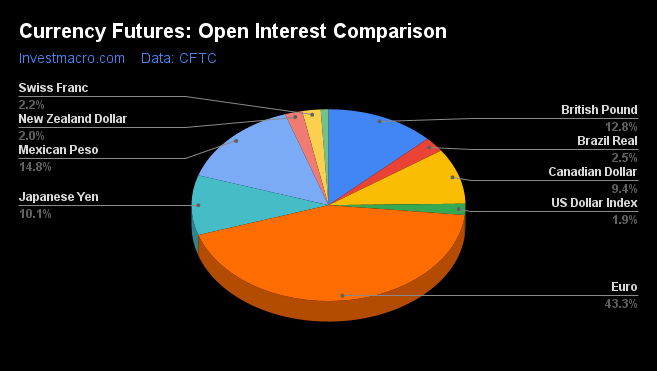
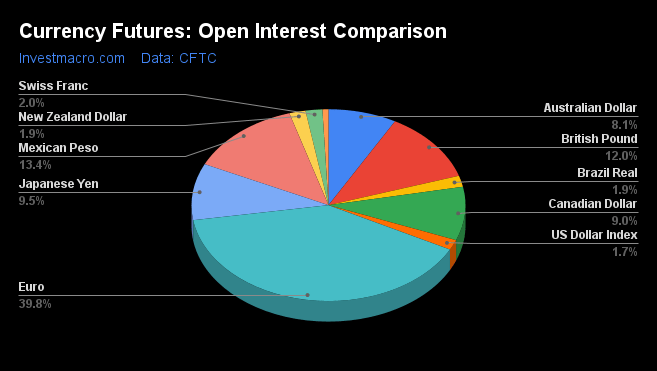
The latest COT data is updated through Tuesday April 11th and shows a quick view of how large market participants (for-profit speculators and commercial traders) were positioned in the futures markets. All currency positions are in direct relation to the US dollar where, for example, a bet for the euro is a bet that the euro will rise versus the dollar while a bet against the euro will be a bet that the euro will decline versus the dollar.
Weekly Speculator Changes led by Euro & British Pound
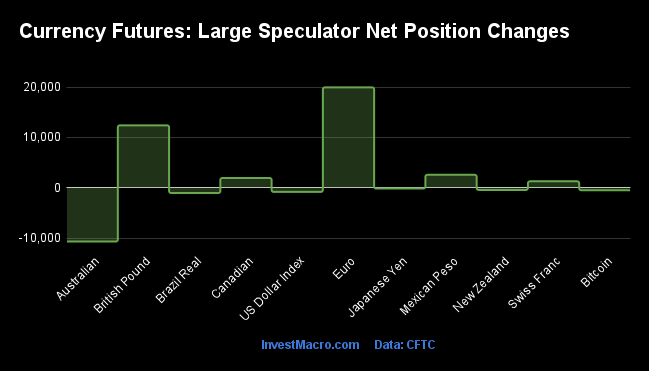
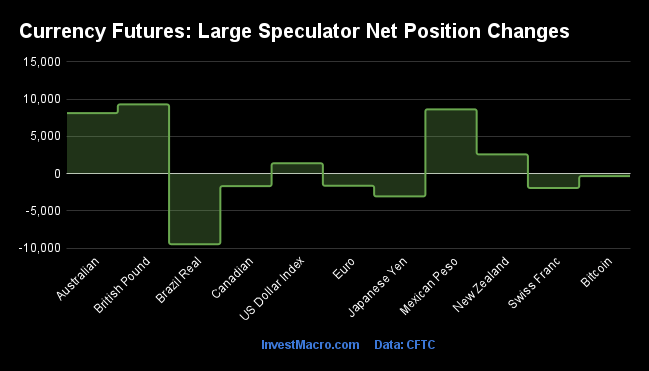
The COT currency market speculator bets were lower this week as five out of the eleven currency markets we cover had higher positioning while the other six markets had lower speculator contracts.
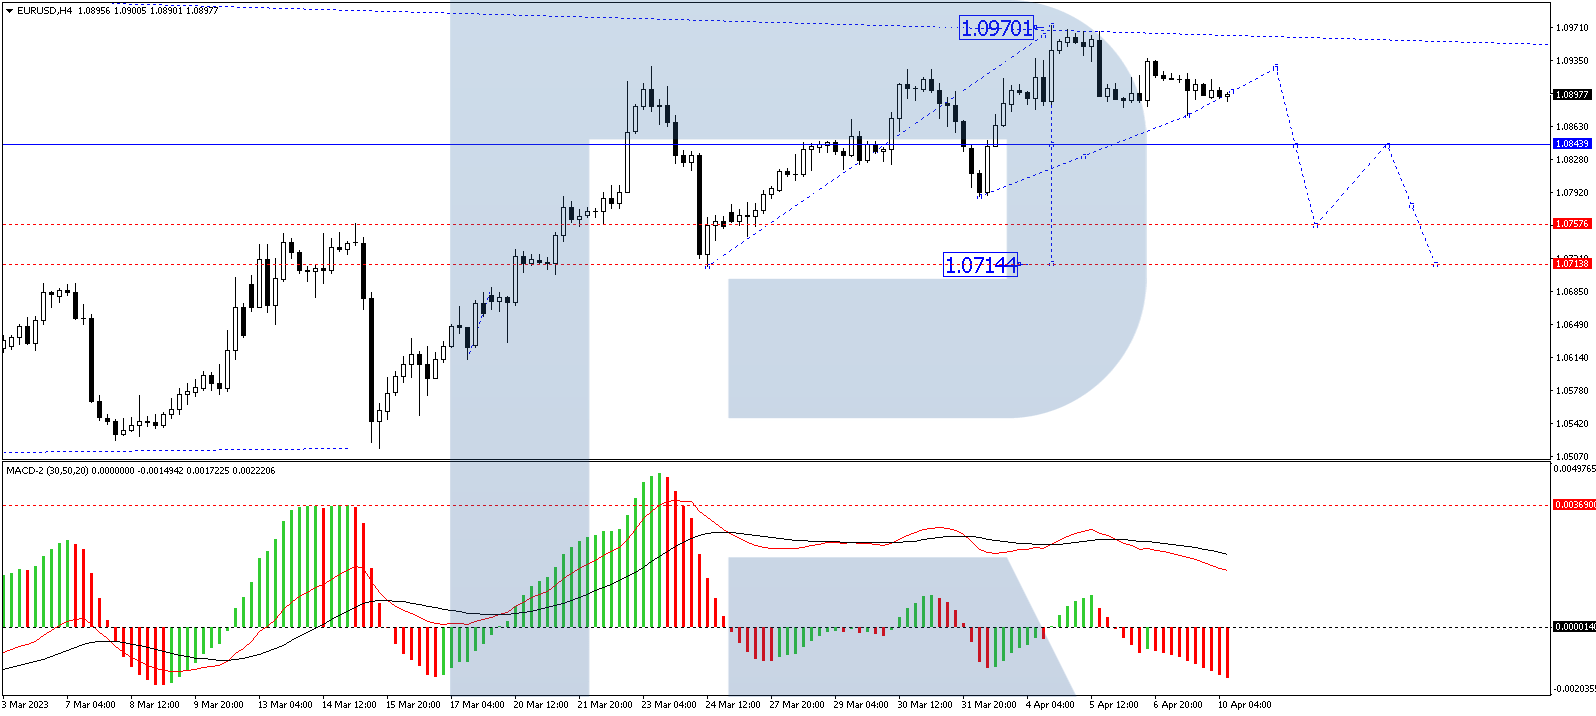
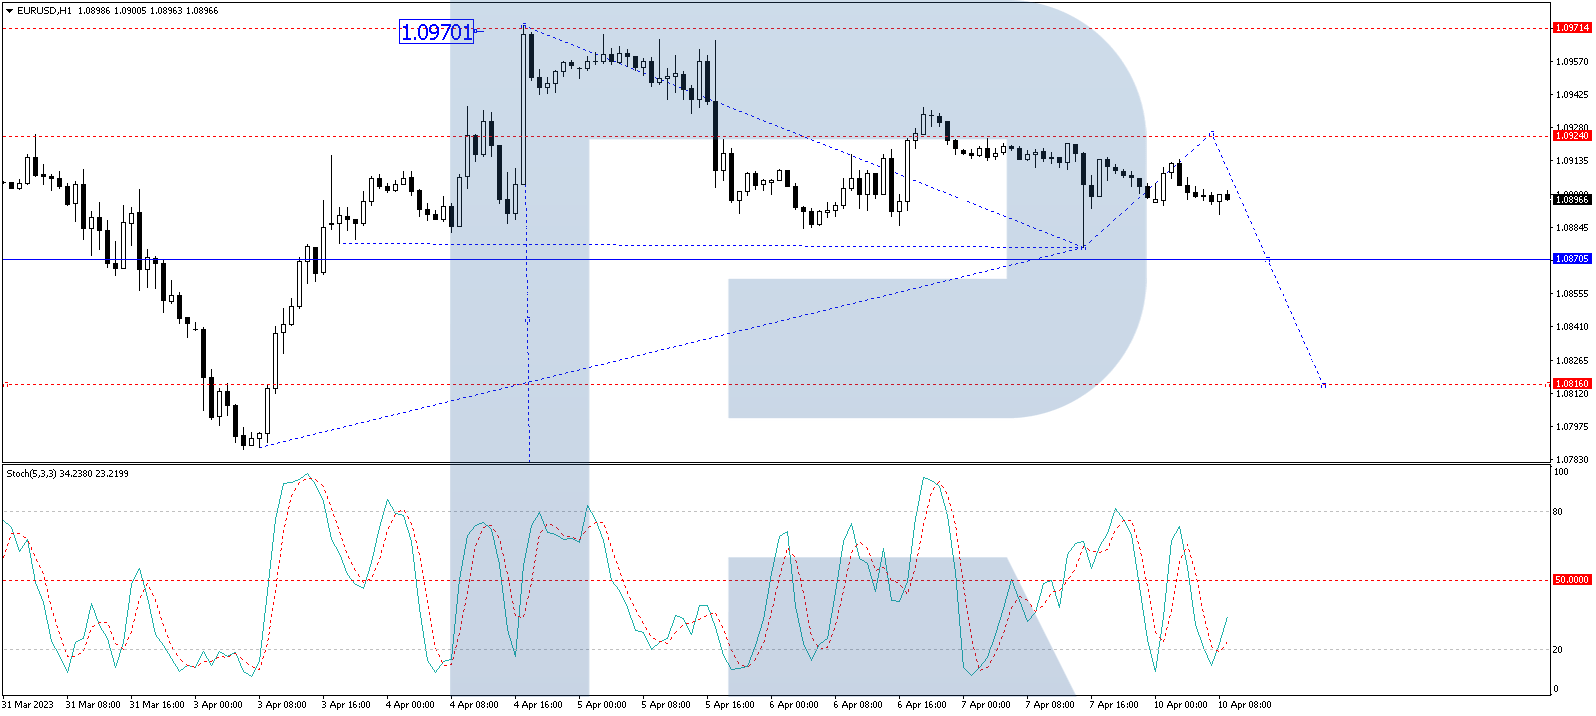
Leading the gains for the currency markets was the EuroFX (19,945 contracts) with the British Pound (12,395 contracts), Mexican Peso (2,564 contracts), Canadian Dollar (1,930 contracts) and the Swiss Franc (1,269 contracts) also showing positive weeks.
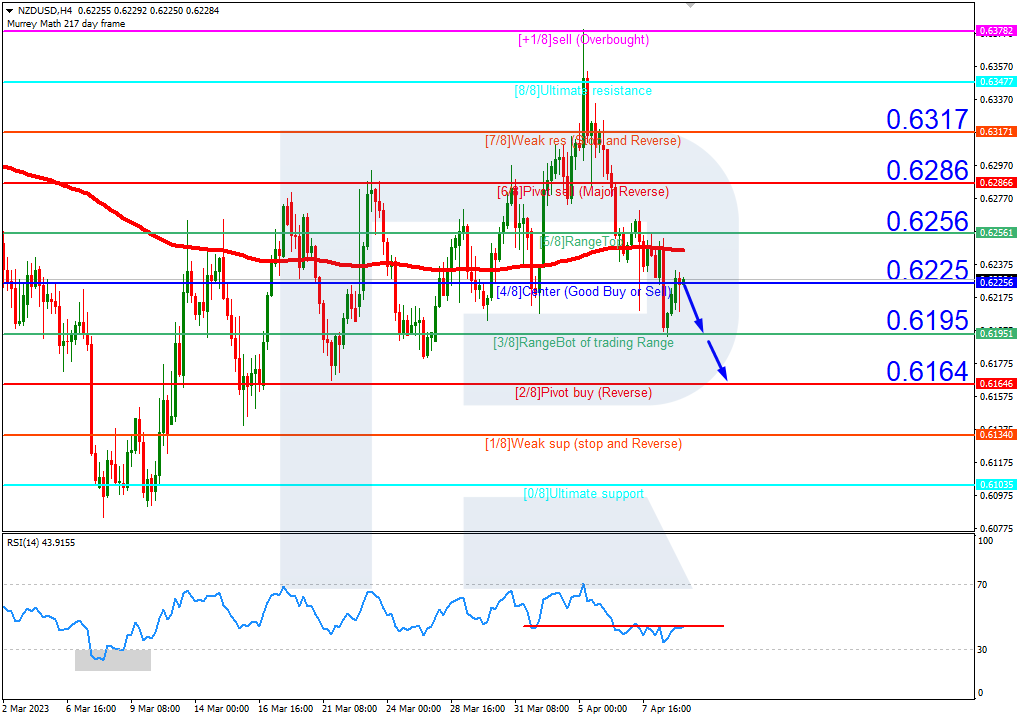
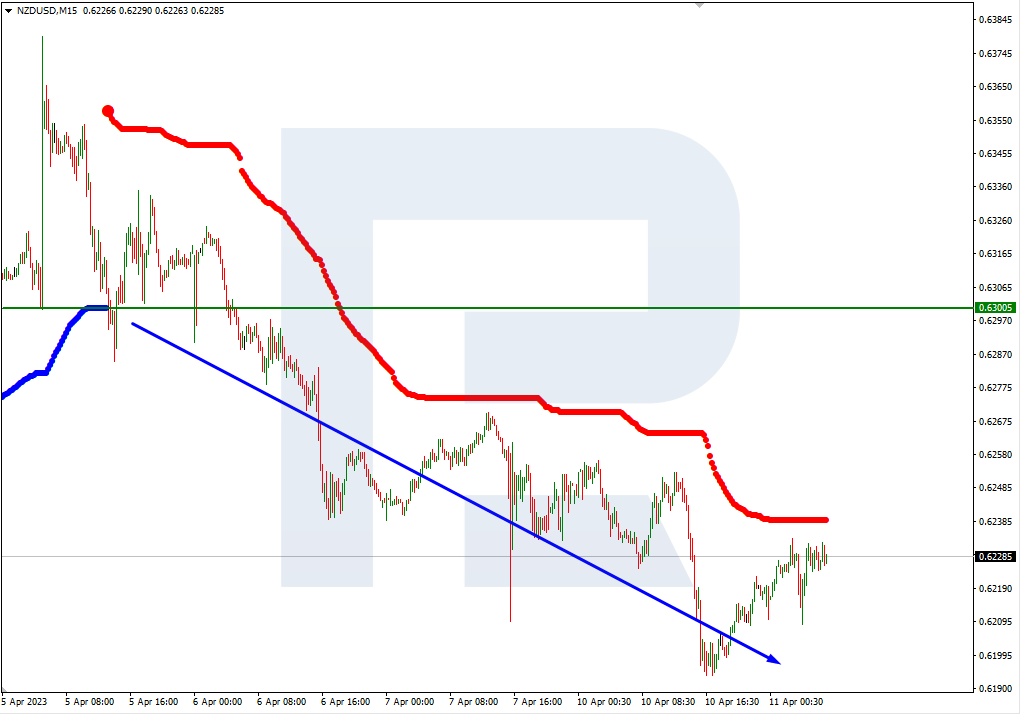
The currencies seeing declines in speculator bets on the week were the Australian Dollar (-10,704 contracts), the Brazilian Real (-1,058 contracts), the Japanese Yen (-171 contracts), the New Zealand Dollar (-450 contracts), the US Dollar Index (-842 contracts) and Bitcoin (-507 contracts) also registering lower bets on the week.
Euro bullish bets go higher to 7-week high
Highlighting the COT currency’s data this week is the continued strength of the speculator’s positioning for the Euro. Large speculative Euro currency positions jumped this week by over +19,000 net contracts, marking the highest one-week gain since September. This is the third time Euro positions have risen in the past four weeks and places the current net position at the best level in the past seven weeks.
The Euro, overall, has now been in a continuous bullish standing for the past 30 weeks, dating back to September 20th when the net position flipped from bearish to bullish. It was also in September when the Euro exchange rate hit a multi-decade low against the US Dollar. The Euro fell below the parity level for the first time since 2002 and bottomed out near the 0.9600 exchange level in late-September. Since that bottom, the Euro has bounced back above parity and has risen by over 14 percent to close this week above the 1.1030 exchange rate.
Helping the Euro gain ground against the US Dollar has been the interest rate differential. Last year, the rate differential was in favor of the US Dollar as the Federal Reserve hiked consistently and sharply while the European Central Bank (ECB) lagged behind. This year, investor’s are forecasting an end to the Fed’s hiking campaign while the ECB seeks to continue raising their interest rate to further combat inflation and triggering further Euro bullish calls.
| Apr-11-2023 | OI | OI-Index | Spec-Net | Spec-Index | Com-Net | COM-Index | Smalls-Net | Smalls-Index |
|---|
| USD Index | 33,076 | 30 | 13,264 | 47 | -15,012 | 52 | 1,748 | 36 |
| EUR | 759,439 | 78 | 163,338 | 81 | -212,065 | 19 | 48,727 | 57 |
| GBP | 225,292 | 52 | -2,398 | 67 | -5,341 | 30 | 7,739 | 73 |
| JPY | 176,822 | 32 | -57,207 | 34 | 56,349 | 63 | 858 | 55 |
| CHF | 38,272 | 29 | -6,734 | 37 | 9,736 | 61 | -3,002 | 47 |
| CAD | 164,875 | 40 | -56,579 | 2 | 58,205 | 96 | -1,626 | 19 |
| AUD | 159,441 | 57 | -37,937 | 50 | 47,070 | 54 | -9,133 | 30 |
| NZD | 35,806 | 23 | -4,481 | 41 | 2,571 | 53 | 1,910 | 74 |
| MXN | 260,053 | 59 | 60,477 | 94 | -65,515 | 6 | 5,038 | 87 |
| RUB | 20,930 | 4 | 7,543 | 31 | -7,150 | 69 | -393 | 24 |
| BRL | 43,986 | 31 | 12,945 | 52 | -14,593 | 47 | 1,648 | 57 |
| Bitcoin | 15,977 | 81 | -1,122 | 57 | 373 | 0 | 749 | 30 |
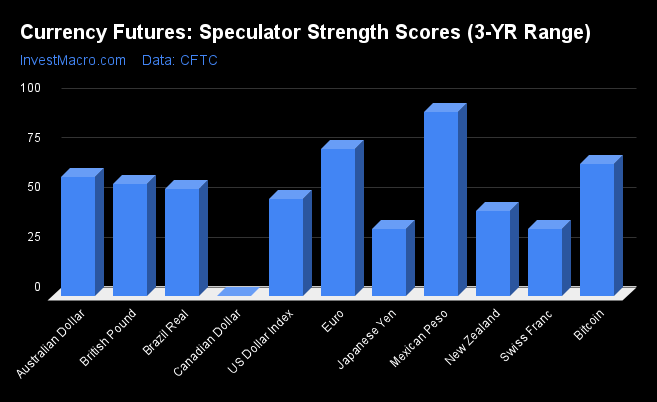
Strength Scores led by Mexican Peso & EuroFX
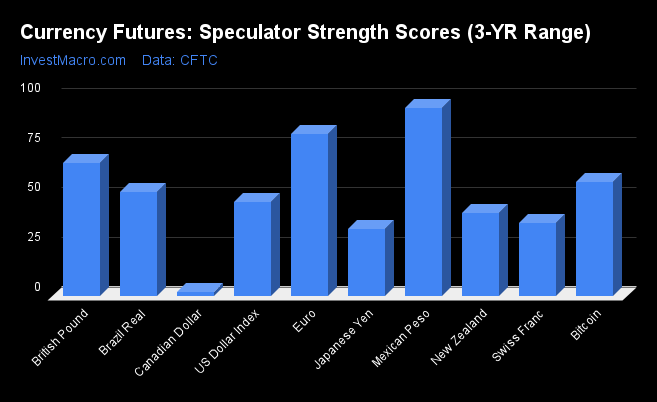
COT Strength Scores (a normalized measure of Speculator positions over a 3-Year range, from 0 to 100 where above 80 is Extreme-Bullish and below 20 is Extreme-Bearish) showed that the Mexican Peso (94 percent) and the EuroFX (81 percent) lead the currency markets this week. The British Pound (67 percent), Bitcoin (57 percent) and the Brazilian Real (52 percent) come in as the next highest in the weekly strength scores.
On the downside, the Canadian Dollar (2 percent) comes in at the lowest strength levels currently and is in Extreme-Bearish territory (below 20 percent). The next lowest strength scores are the Japanese Yen (34 percent) and the Swiss Franc (37 percent).
Strength Statistics:
US Dollar Index (47.1 percent) vs US Dollar Index previous week (48.5 percent)
EuroFX (81.3 percent) vs EuroFX previous week (73.7 percent)
British Pound Sterling (67.0 percent) vs British Pound Sterling previous week (56.3 percent)
Japanese Yen (33.6 percent) vs Japanese Yen previous week (33.7 percent)
Swiss Franc (36.8 percent) vs Swiss Franc previous week (33.4 percent)
Canadian Dollar (1.8 percent) vs Canadian Dollar previous week (0.0 percent)
Australian Dollar (49.7 percent) vs Australian Dollar previous week (59.6 percent)
New Zealand Dollar (41.4 percent) vs New Zealand Dollar previous week (42.7 percent)
Mexican Peso (94.4 percent) vs Mexican Peso previous week (92.5 percent)
Brazilian Real (52.3 percent) vs Brazilian Real previous week (53.6 percent)
Bitcoin (57.4 percent) vs Bitcoin previous week (66.2 percent)
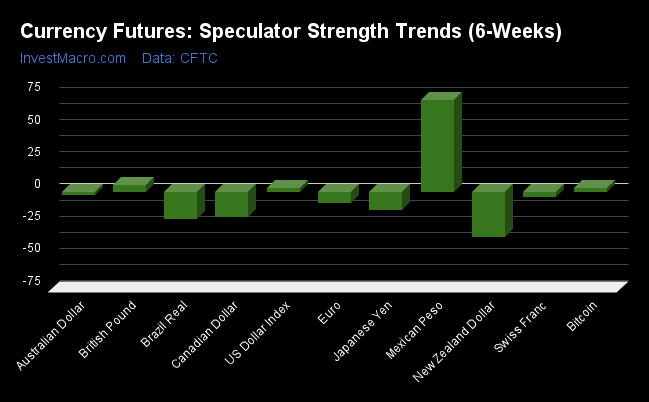
Mexican Peso & British Pound top the 6-Week Strength Trends
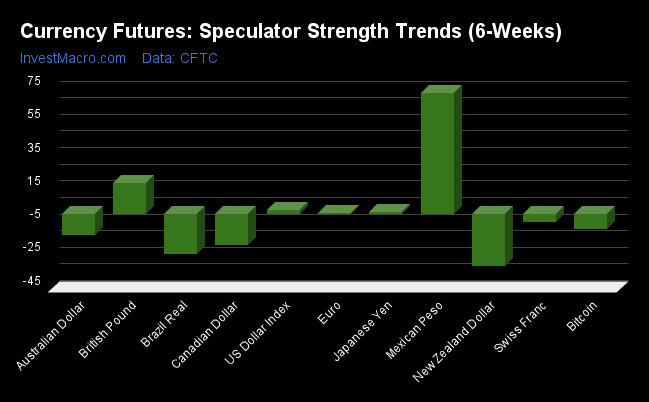
COT Strength Score Trends (or move index, calculates the 6-week changes in strength scores) showed that the Mexican Peso (72 percent) and the British Pound (18 percent) lead the past six weeks trends for the currencies. The US Dollar Index (2 percent) and the Japanese Yen (1 percent) are the next highest positive movers in the latest trends data.
The New Zealand Dollar (-31 percent) leads the downside trend scores currently with the Brazilian Real (-24 percent), Canadian Dollar (-19 percent) and the Australian Dollar (-13 percent) following next with lower trend scores.
Strength Trend Statistics:
US Dollar Index (2.3 percent) vs US Dollar Index previous week (3.2 percent)
EuroFX (0.4 percent) vs EuroFX previous week (-8.4 percent)
British Pound Sterling (18.3 percent) vs British Pound Sterling previous week (5.7 percent)
Japanese Yen (0.9 percent) vs Japanese Yen previous week (-14.2 percent)
Swiss Franc (-4.8 percent) vs Swiss Franc previous week (-3.9 percent)
Canadian Dollar (-19.1 percent) vs Canadian Dollar previous week (-19.6 percent)
Australian Dollar (-12.8 percent) vs Australian Dollar previous week (-2.3 percent)
New Zealand Dollar (-31.4 percent) vs New Zealand Dollar previous week (-34.7 percent)
Mexican Peso (72.5 percent) vs Mexican Peso previous week (71.8 percent)
Brazilian Real (-24.0 percent) vs Brazilian Real previous week (-21.0 percent)
Bitcoin (-9.1 percent) vs Bitcoin previous week (3.4 percent)
Individual COT Forex Markets:
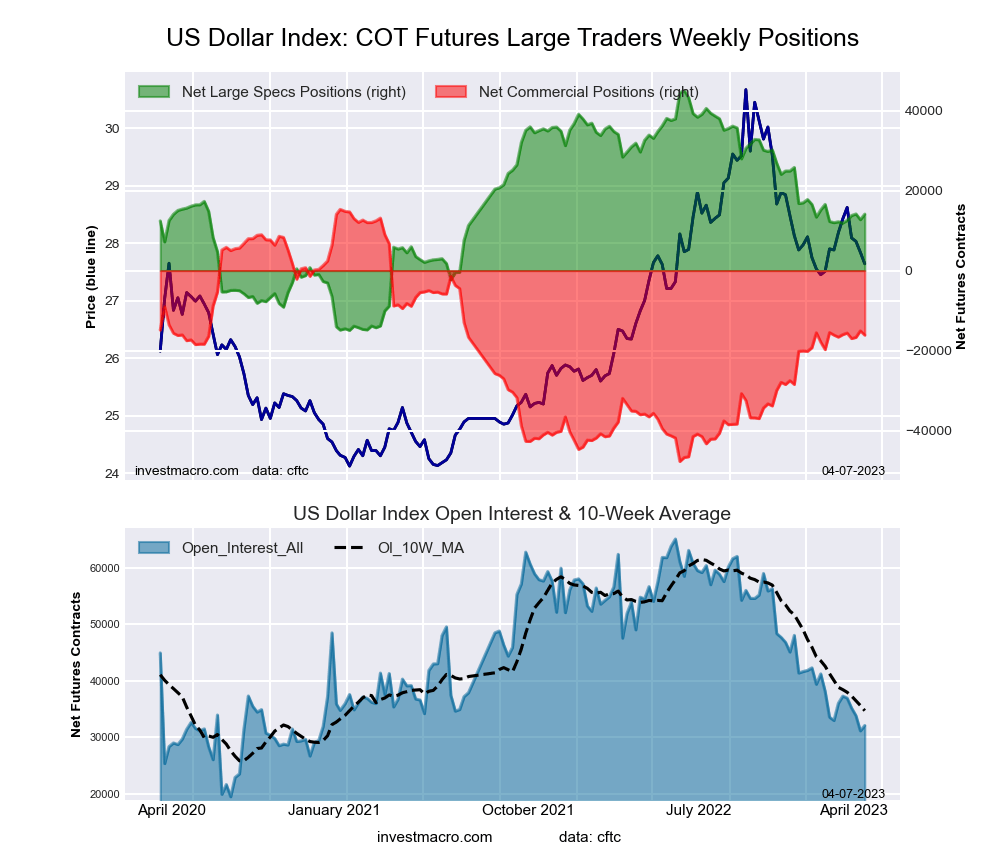
US Dollar Index Futures:
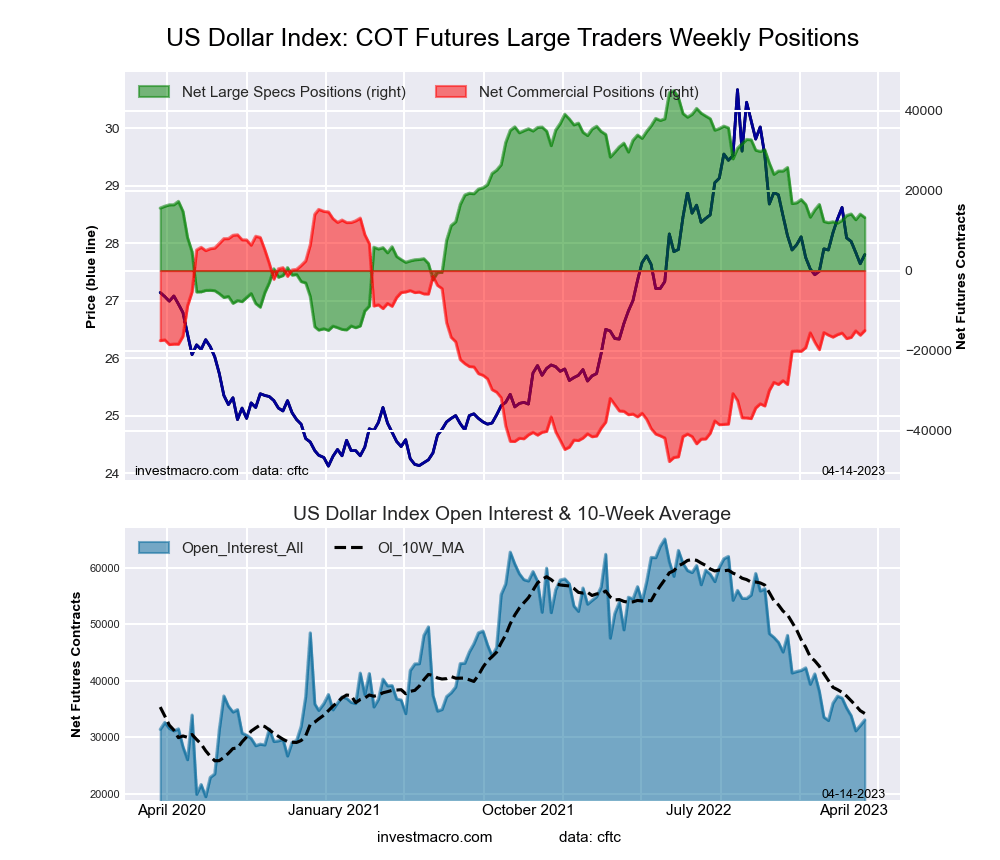 The US Dollar Index large speculator standing this week totaled a net position of 13,264 contracts in the data reported through Tuesday. This was a weekly lowering of -842 contracts from the previous week which had a total of 14,106 net contracts.
This week’s current strength score (the trader positioning range over the past three years, measured from 0 to 100) shows the speculators are currently Bearish with a score of 47.1 percent. The commercials are Bullish with a score of 51.9 percent and the small traders (not shown in chart) are Bearish with a score of 35.6 percent.
| US DOLLAR INDEX Statistics | SPECULATORS | COMMERCIALS | SMALL TRADERS |
| – Percent of Open Interest Longs: | 78.9 | 3.0 | 14.0 |
| – Percent of Open Interest Shorts: | 38.8 | 48.4 | 8.7 |
| – Net Position: | 13,264 | -15,012 | 1,748 |
| – Gross Longs: | 26,090 | 1,006 | 4,626 |
| – Gross Shorts: | 12,826 | 16,018 | 2,878 |
| – Long to Short Ratio: | 2.0 to 1 | 0.1 to 1 | 1.6 to 1 |
| NET POSITION TREND: | | | |
| – Strength Index Score (3 Year Range Pct): | 47.1 | 51.9 | 35.6 |
| – Strength Index Reading (3 Year Range): | Bearish | Bullish | Bearish |
| NET POSITION MOVEMENT INDEX: | | | |
| – 6-Week Change in Strength Index: | 2.3 | 1.6 | -26.3 |
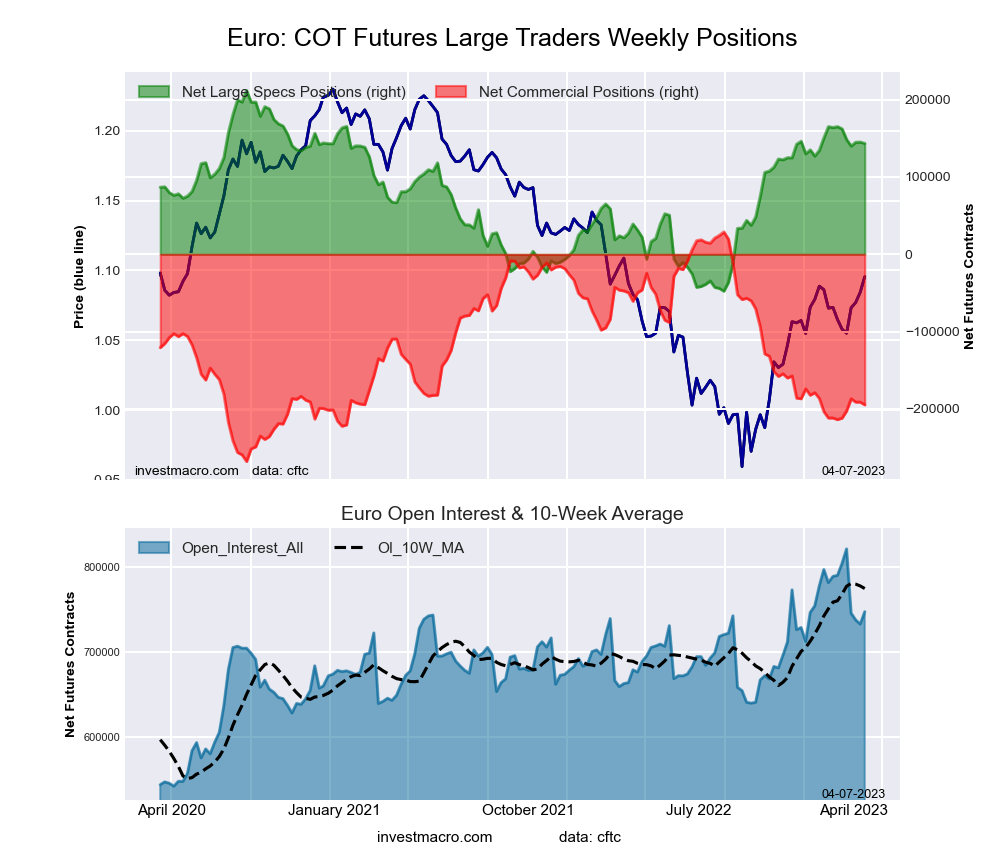
Euro Currency Futures:
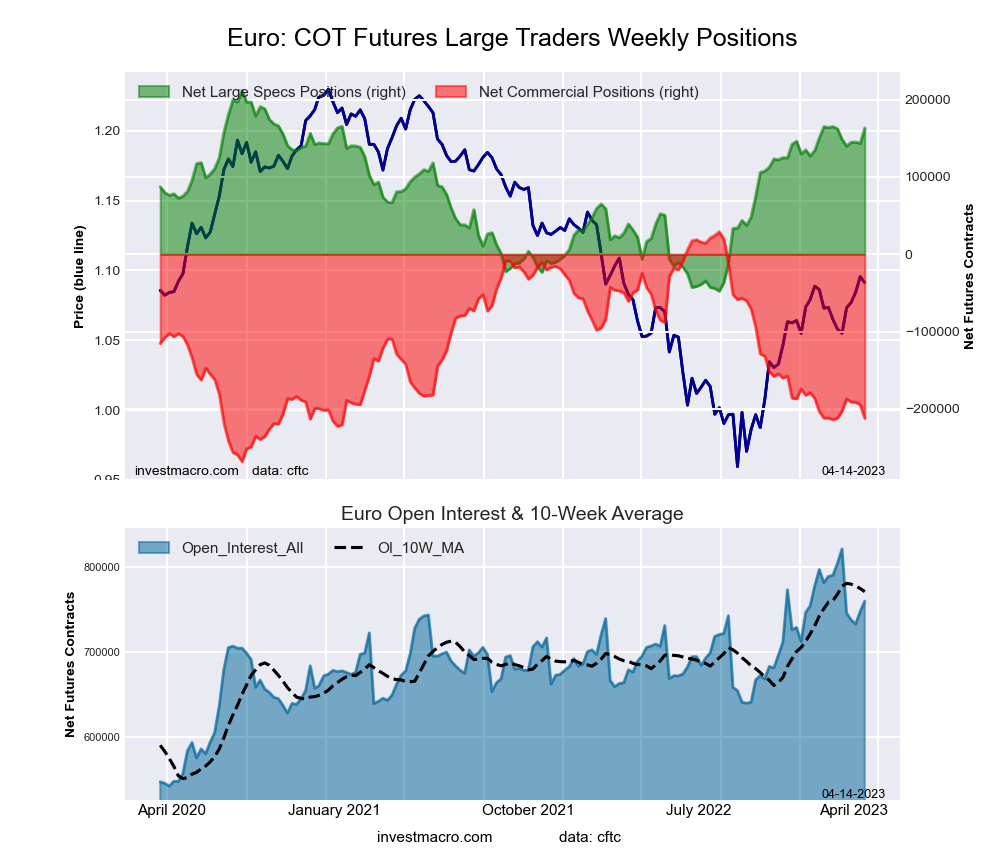 The Euro Currency large speculator standing this week totaled a net position of 163,338 contracts in the data reported through Tuesday. This was a weekly boost of 19,945 contracts from the previous week which had a total of 143,393 net contracts.
This week’s current strength score (the trader positioning range over the past three years, measured from 0 to 100) shows the speculators are currently Bullish-Extreme with a score of 81.3 percent. The commercials are Bearish-Extreme with a score of 18.8 percent and the small traders (not shown in chart) are Bullish with a score of 56.7 percent.
| EURO Currency Statistics | SPECULATORS | COMMERCIALS | SMALL TRADERS |
| – Percent of Open Interest Longs: | 32.2 | 54.2 | 11.8 |
| – Percent of Open Interest Shorts: | 10.6 | 82.1 | 5.3 |
| – Net Position: | 163,338 | -212,065 | 48,727 |
| – Gross Longs: | 244,180 | 411,456 | 89,357 |
| – Gross Shorts: | 80,842 | 623,521 | 40,630 |
| – Long to Short Ratio: | 3.0 to 1 | 0.7 to 1 | 2.2 to 1 |
| NET POSITION TREND: | | | |
| – Strength Index Score (3 Year Range Pct): | 81.3 | 18.8 | 56.7 |
| – Strength Index Reading (3 Year Range): | Bullish-Extreme | Bearish-Extreme | Bullish |
| NET POSITION MOVEMENT INDEX: | | | |
| – 6-Week Change in Strength Index: | 0.4 | -0.1 | -1.6 |
British Pound Sterling Futures:
 The British Pound Sterling large speculator standing this week totaled a net position of -2,398 contracts in the data reported through Tuesday. This was a weekly advance of 12,395 contracts from the previous week which had a total of -14,793 net contracts.
This week’s current strength score (the trader positioning range over the past three years, measured from 0 to 100) shows the speculators are currently Bullish with a score of 67.0 percent. The commercials are Bearish with a score of 30.5 percent and the small traders (not shown in chart) are Bullish with a score of 73.2 percent.
| BRITISH POUND Statistics | SPECULATORS | COMMERCIALS | SMALL TRADERS |
| – Percent of Open Interest Longs: | 24.4 | 55.8 | 13.9 |
| – Percent of Open Interest Shorts: | 25.4 | 58.1 | 10.4 |
| – Net Position: | -2,398 | -5,341 | 7,739 |
| – Gross Longs: | 54,928 | 125,634 | 31,221 |
| – Gross Shorts: | 57,326 | 130,975 | 23,482 |
| – Long to Short Ratio: | 1.0 to 1 | 1.0 to 1 | 1.3 to 1 |
| NET POSITION TREND: | | | |
| – Strength Index Score (3 Year Range Pct): | 67.0 | 30.5 | 73.2 |
| – Strength Index Reading (3 Year Range): | Bullish | Bearish | Bullish |
| NET POSITION MOVEMENT INDEX: | | | |
| – 6-Week Change in Strength Index: | 18.3 | -28.4 | 40.1 |
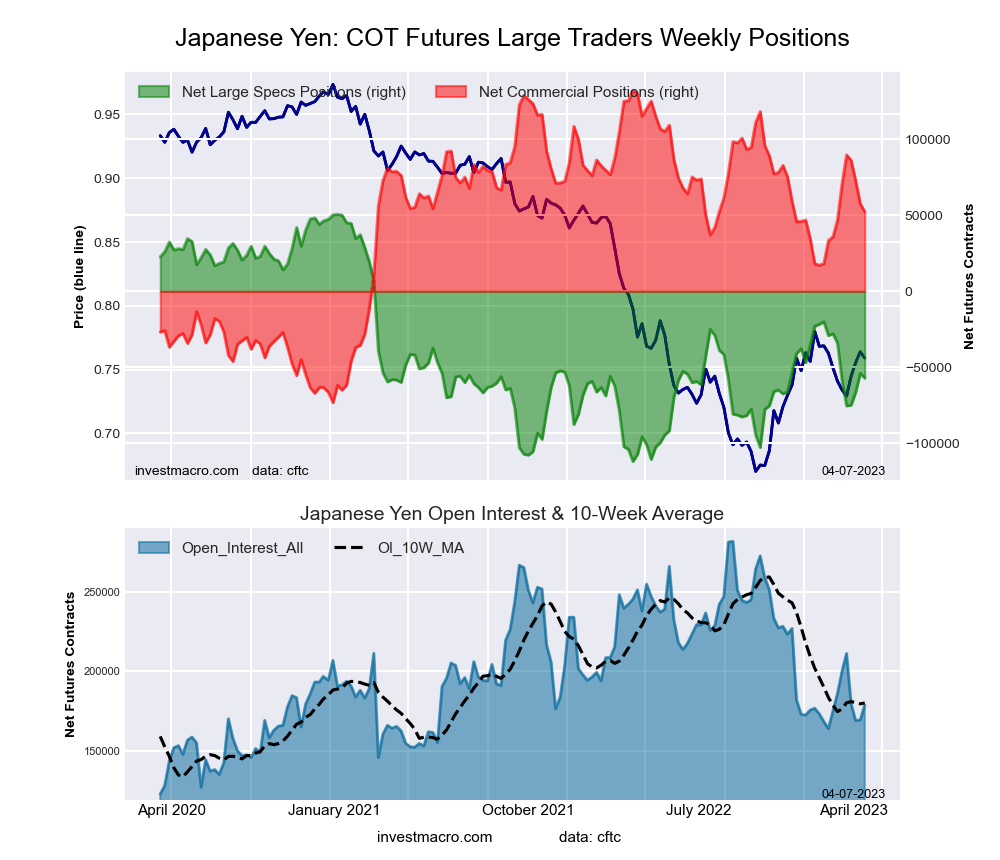
Japanese Yen Futures:
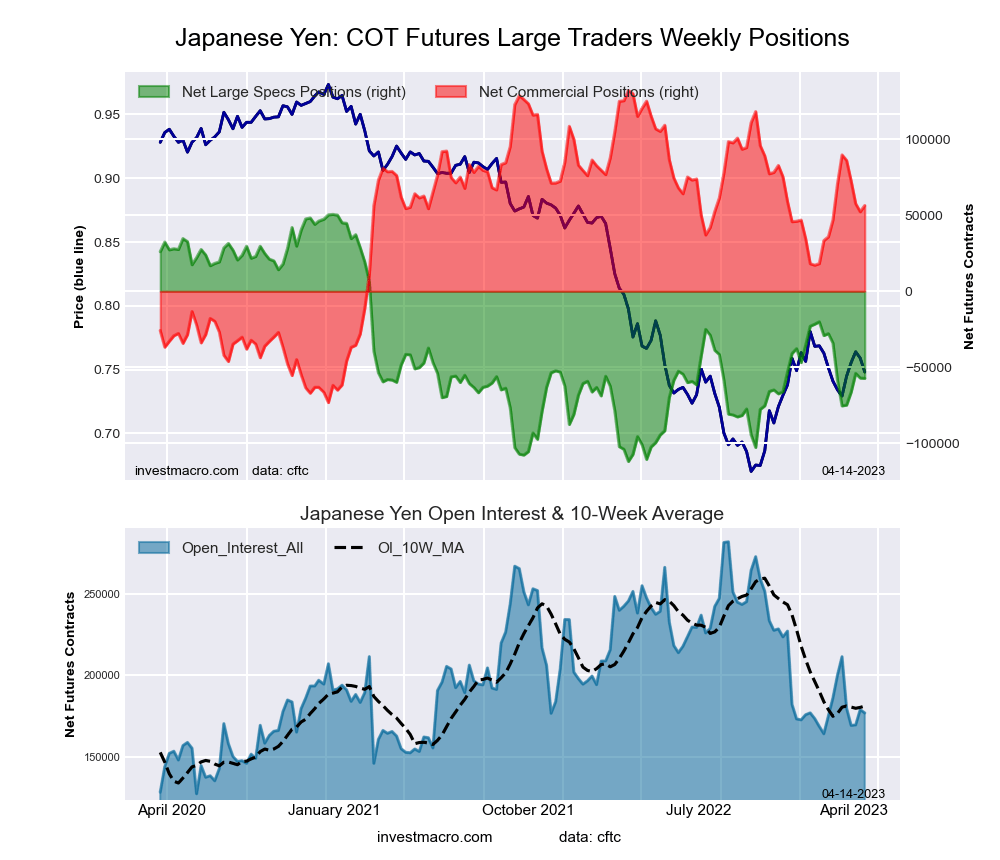 The Japanese Yen large speculator standing this week totaled a net position of -57,207 contracts in the data reported through Tuesday. This was a weekly fall of -171 contracts from the previous week which had a total of -57,036 net contracts.
This week’s current strength score (the trader positioning range over the past three years, measured from 0 to 100) shows the speculators are currently Bearish with a score of 33.6 percent. The commercials are Bullish with a score of 63.1 percent and the small traders (not shown in chart) are Bullish with a score of 55.2 percent.
| JAPANESE YEN Statistics | SPECULATORS | COMMERCIALS | SMALL TRADERS |
| – Percent of Open Interest Longs: | 6.7 | 75.0 | 17.2 |
| – Percent of Open Interest Shorts: | 39.1 | 43.1 | 16.7 |
| – Net Position: | -57,207 | 56,349 | 858 |
| – Gross Longs: | 11,933 | 132,604 | 30,405 |
| – Gross Shorts: | 69,140 | 76,255 | 29,547 |
| – Long to Short Ratio: | 0.2 to 1 | 1.7 to 1 | 1.0 to 1 |
| NET POSITION TREND: | | | |
| – Strength Index Score (3 Year Range Pct): | 33.6 | 63.1 | 55.2 |
| – Strength Index Reading (3 Year Range): | Bearish | Bullish | Bullish |
| NET POSITION MOVEMENT INDEX: | | | |
| – 6-Week Change in Strength Index: | 0.9 | -6.9 | 25.8 |
Swiss Franc Futures:
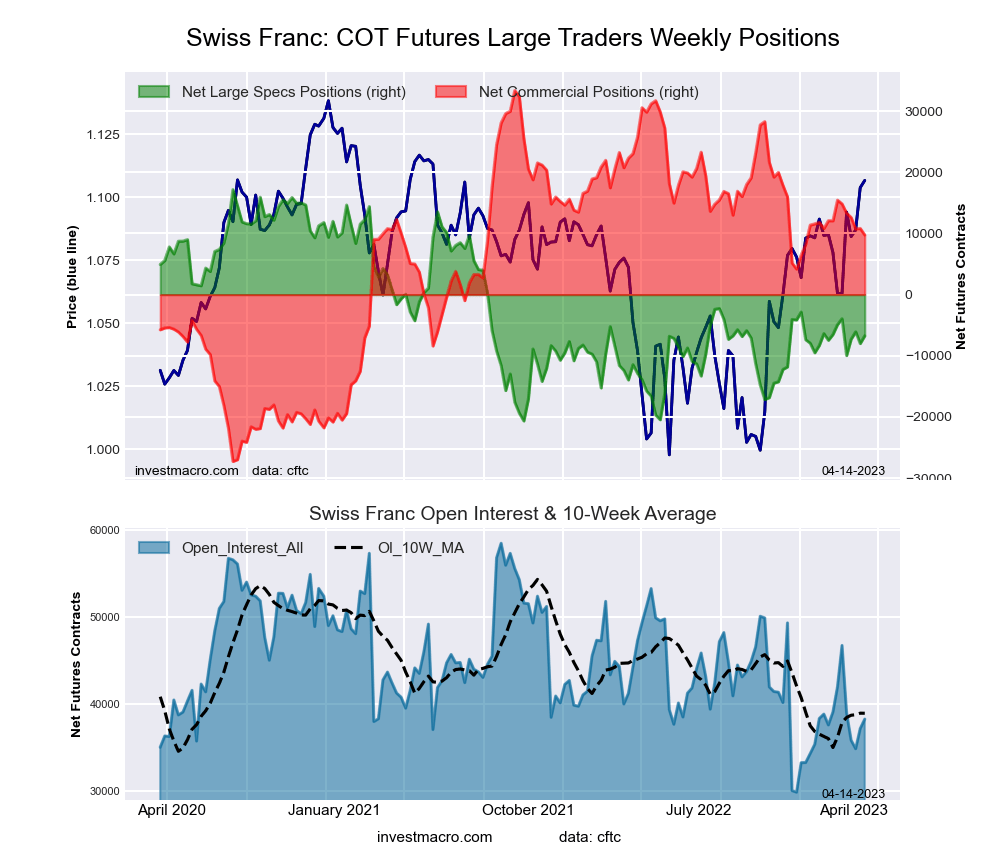 The Swiss Franc large speculator standing this week totaled a net position of -6,734 contracts in the data reported through Tuesday. This was a weekly increase of 1,269 contracts from the previous week which had a total of -8,003 net contracts.
This week’s current strength score (the trader positioning range over the past three years, measured from 0 to 100) shows the speculators are currently Bearish with a score of 36.8 percent. The commercials are Bullish with a score of 61.0 percent and the small traders (not shown in chart) are Bearish with a score of 47.4 percent.
| SWISS FRANC Statistics | SPECULATORS | COMMERCIALS | SMALL TRADERS |
| – Percent of Open Interest Longs: | 10.9 | 52.0 | 31.5 |
| – Percent of Open Interest Shorts: | 28.5 | 26.6 | 39.3 |
| – Net Position: | -6,734 | 9,736 | -3,002 |
| – Gross Longs: | 4,155 | 19,920 | 12,050 |
| – Gross Shorts: | 10,889 | 10,184 | 15,052 |
| – Long to Short Ratio: | 0.4 to 1 | 2.0 to 1 | 0.8 to 1 |
| NET POSITION TREND: | | | |
| – Strength Index Score (3 Year Range Pct): | 36.8 | 61.0 | 47.4 |
| – Strength Index Reading (3 Year Range): | Bearish | Bullish | Bearish |
| NET POSITION MOVEMENT INDEX: | | | |
| – 6-Week Change in Strength Index: | -4.8 | -9.4 | 25.5 |
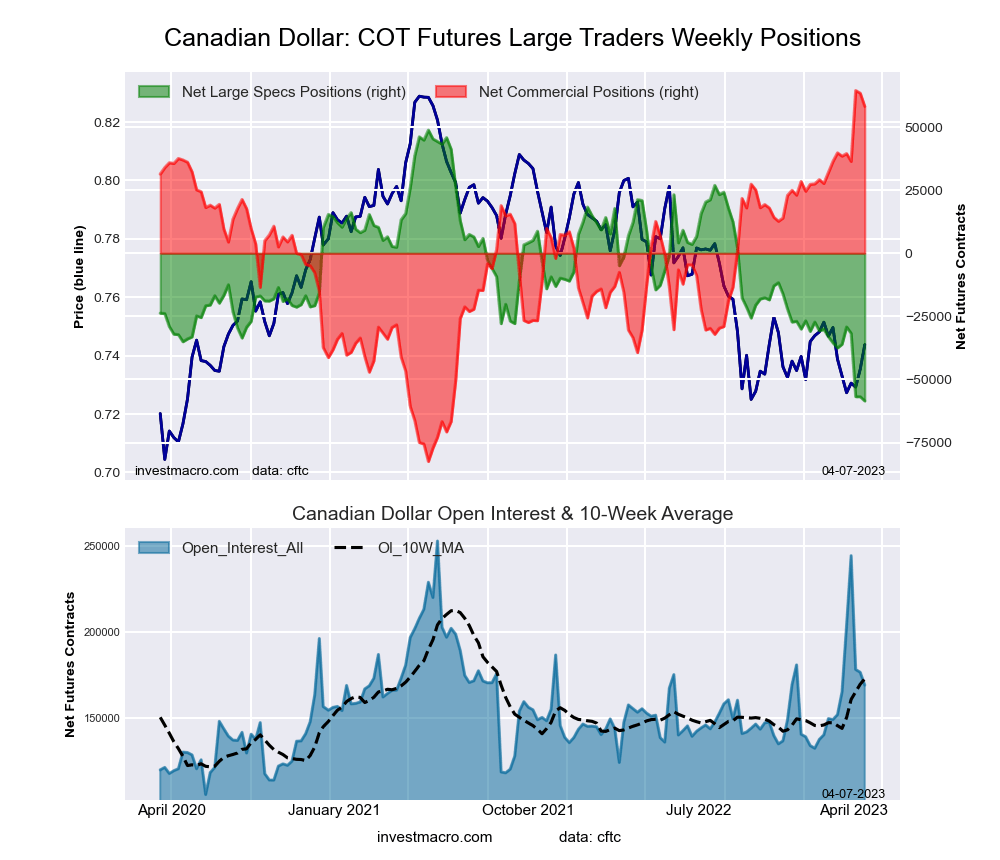
Canadian Dollar Futures:
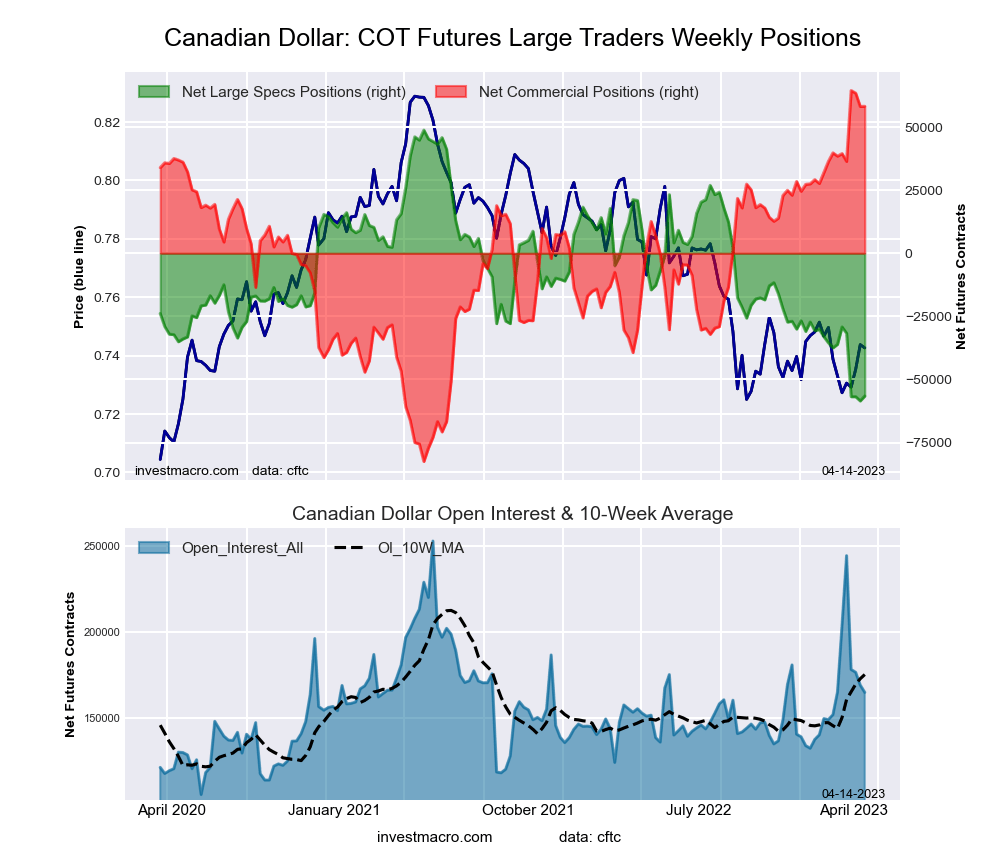 The Canadian Dollar large speculator standing this week totaled a net position of -56,579 contracts in the data reported through Tuesday. This was a weekly advance of 1,930 contracts from the previous week which had a total of -58,509 net contracts.
This week’s current strength score (the trader positioning range over the past three years, measured from 0 to 100) shows the speculators are currently Bearish-Extreme with a score of 1.8 percent. The commercials are Bullish-Extreme with a score of 95.8 percent and the small traders (not shown in chart) are Bearish-Extreme with a score of 19.2 percent.
| CANADIAN DOLLAR Statistics | SPECULATORS | COMMERCIALS | SMALL TRADERS |
| – Percent of Open Interest Longs: | 10.3 | 70.7 | 17.6 |
| – Percent of Open Interest Shorts: | 44.6 | 35.4 | 18.6 |
| – Net Position: | -56,579 | 58,205 | -1,626 |
| – Gross Longs: | 16,914 | 116,537 | 29,091 |
| – Gross Shorts: | 73,493 | 58,332 | 30,717 |
| – Long to Short Ratio: | 0.2 to 1 | 2.0 to 1 | 0.9 to 1 |
| NET POSITION TREND: | | | |
| – Strength Index Score (3 Year Range Pct): | 1.8 | 95.8 | 19.2 |
| – Strength Index Reading (3 Year Range): | Bearish-Extreme | Bullish-Extreme | Bearish-Extreme |
| NET POSITION MOVEMENT INDEX: | | | |
| – 6-Week Change in Strength Index: | -19.1 | 13.4 | 1.7 |
Australian Dollar Futures:
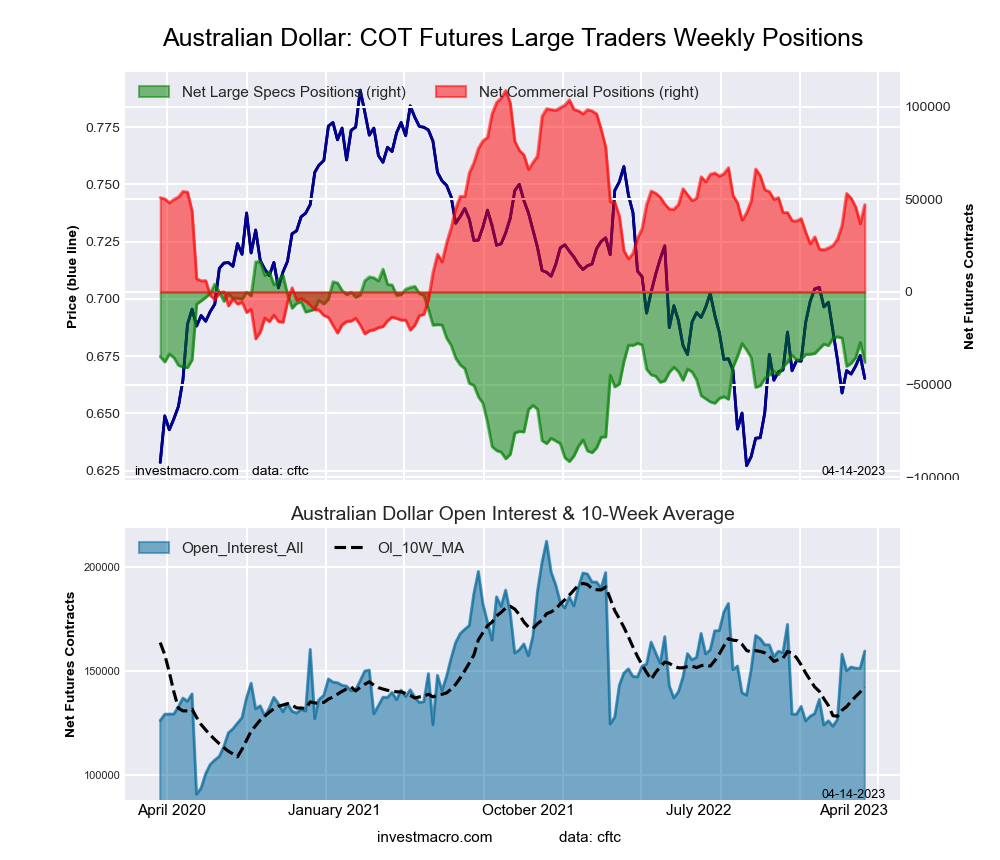 The Australian Dollar large speculator standing this week totaled a net position of -37,937 contracts in the data reported through Tuesday. This was a weekly lowering of -10,704 contracts from the previous week which had a total of -27,233 net contracts.
This week’s current strength score (the trader positioning range over the past three years, measured from 0 to 100) shows the speculators are currently Bearish with a score of 49.7 percent. The commercials are Bullish with a score of 54.0 percent and the small traders (not shown in chart) are Bearish with a score of 30.2 percent.
| AUSTRALIAN DOLLAR Statistics | SPECULATORS | COMMERCIALS | SMALL TRADERS |
| – Percent of Open Interest Longs: | 28.5 | 54.2 | 13.5 |
| – Percent of Open Interest Shorts: | 52.3 | 24.7 | 19.3 |
| – Net Position: | -37,937 | 47,070 | -9,133 |
| – Gross Longs: | 45,481 | 86,468 | 21,588 |
| – Gross Shorts: | 83,418 | 39,398 | 30,721 |
| – Long to Short Ratio: | 0.5 to 1 | 2.2 to 1 | 0.7 to 1 |
| NET POSITION TREND: | | | |
| – Strength Index Score (3 Year Range Pct): | 49.7 | 54.0 | 30.2 |
| – Strength Index Reading (3 Year Range): | Bearish | Bullish | Bearish |
| NET POSITION MOVEMENT INDEX: | | | |
| – 6-Week Change in Strength Index: | -12.8 | 13.8 | -11.5 |
New Zealand Dollar Futures:
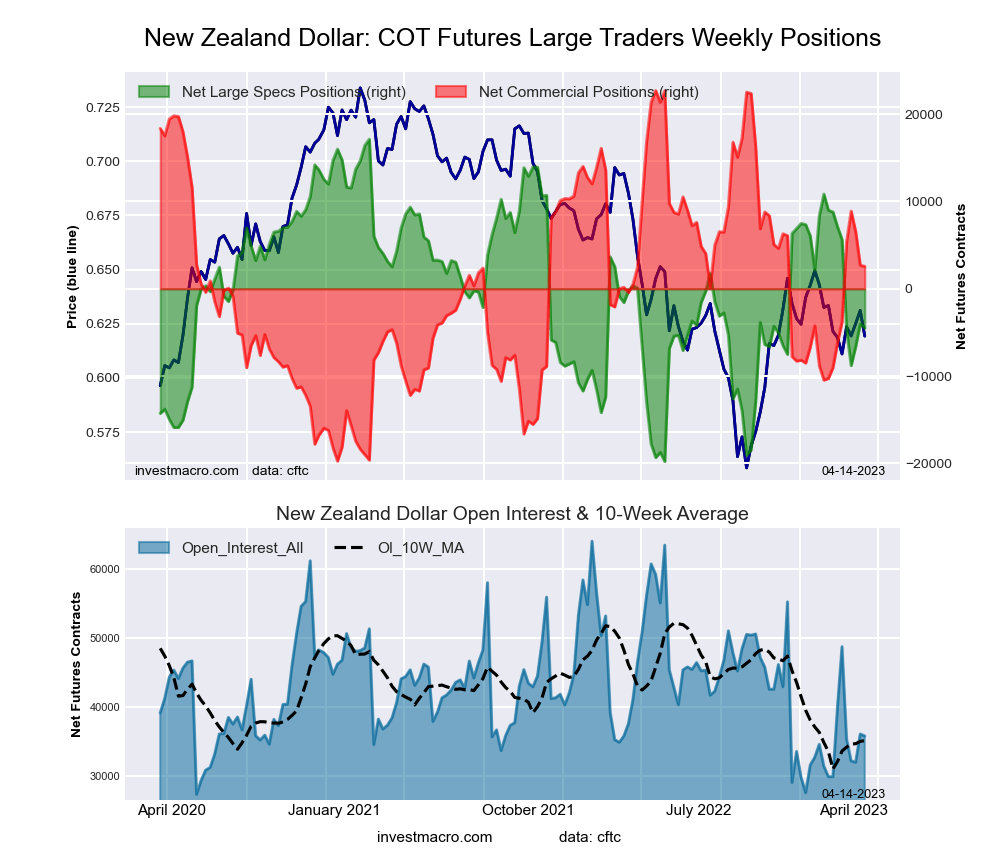 The New Zealand Dollar large speculator standing this week totaled a net position of -4,481 contracts in the data reported through Tuesday. This was a weekly fall of -450 contracts from the previous week which had a total of -4,031 net contracts.
This week’s current strength score (the trader positioning range over the past three years, measured from 0 to 100) shows the speculators are currently Bearish with a score of 41.4 percent. The commercials are Bullish with a score of 52.5 percent and the small traders (not shown in chart) are Bullish with a score of 73.6 percent.
| NEW ZEALAND DOLLAR Statistics | SPECULATORS | COMMERCIALS | SMALL TRADERS |
| – Percent of Open Interest Longs: | 36.6 | 49.6 | 13.4 |
| – Percent of Open Interest Shorts: | 49.1 | 42.4 | 8.1 |
| – Net Position: | -4,481 | 2,571 | 1,910 |
| – Gross Longs: | 13,097 | 17,758 | 4,811 |
| – Gross Shorts: | 17,578 | 15,187 | 2,901 |
| – Long to Short Ratio: | 0.7 to 1 | 1.2 to 1 | 1.7 to 1 |
| NET POSITION TREND: | | | |
| – Strength Index Score (3 Year Range Pct): | 41.4 | 52.5 | 73.6 |
| – Strength Index Reading (3 Year Range): | Bearish | Bullish | Bullish |
| NET POSITION MOVEMENT INDEX: | | | |
| – 6-Week Change in Strength Index: | -31.4 | 20.6 | 32.7 |
Mexican Peso Futures:
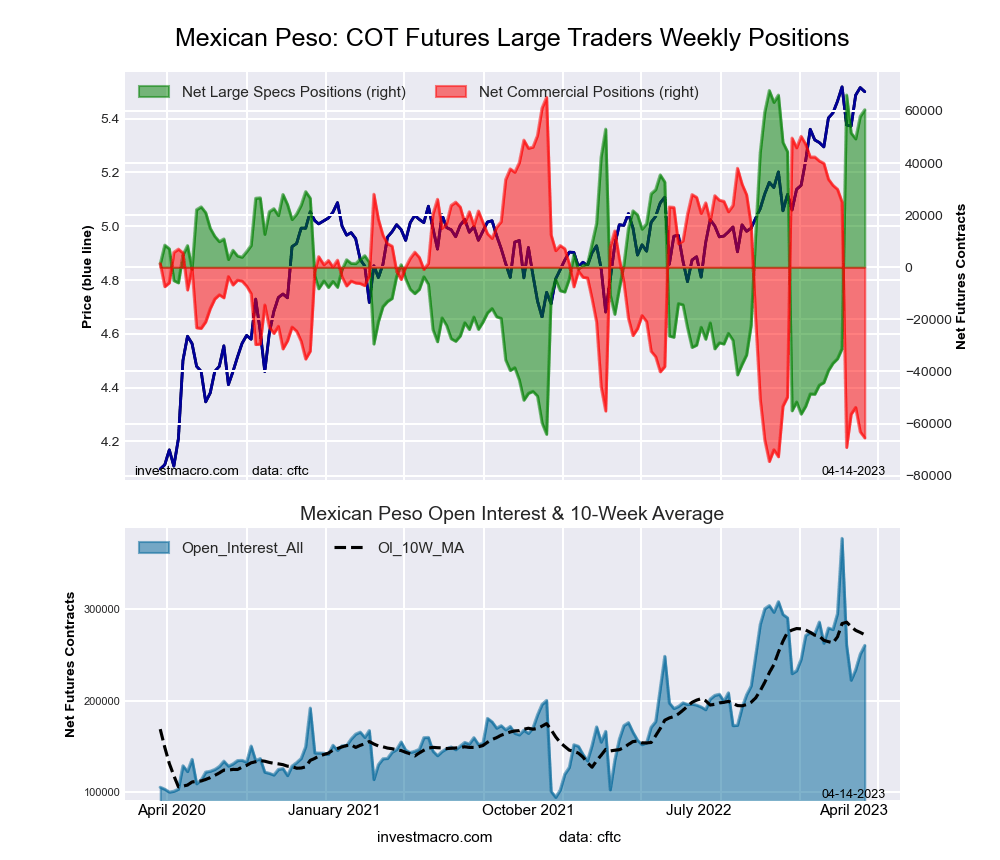 The Mexican Peso large speculator standing this week totaled a net position of 60,477 contracts in the data reported through Tuesday. This was a weekly gain of 2,564 contracts from the previous week which had a total of 57,913 net contracts.
This week’s current strength score (the trader positioning range over the past three years, measured from 0 to 100) shows the speculators are currently Bullish-Extreme with a score of 94.4 percent. The commercials are Bearish-Extreme with a score of 6.5 percent and the small traders (not shown in chart) are Bullish-Extreme with a score of 87.4 percent.
| MEXICAN PESO Statistics | SPECULATORS | COMMERCIALS | SMALL TRADERS |
| – Percent of Open Interest Longs: | 52.4 | 44.4 | 2.9 |
| – Percent of Open Interest Shorts: | 29.2 | 69.6 | 1.0 |
| – Net Position: | 60,477 | -65,515 | 5,038 |
| – Gross Longs: | 136,355 | 115,499 | 7,520 |
| – Gross Shorts: | 75,878 | 181,014 | 2,482 |
| – Long to Short Ratio: | 1.8 to 1 | 0.6 to 1 | 3.0 to 1 |
| NET POSITION TREND: | | | |
| – Strength Index Score (3 Year Range Pct): | 94.4 | 6.5 | 87.4 |
| – Strength Index Reading (3 Year Range): | Bullish-Extreme | Bearish-Extreme | Bullish-Extreme |
| NET POSITION MOVEMENT INDEX: | | | |
| – 6-Week Change in Strength Index: | 72.5 | -68.3 | -0.9 |
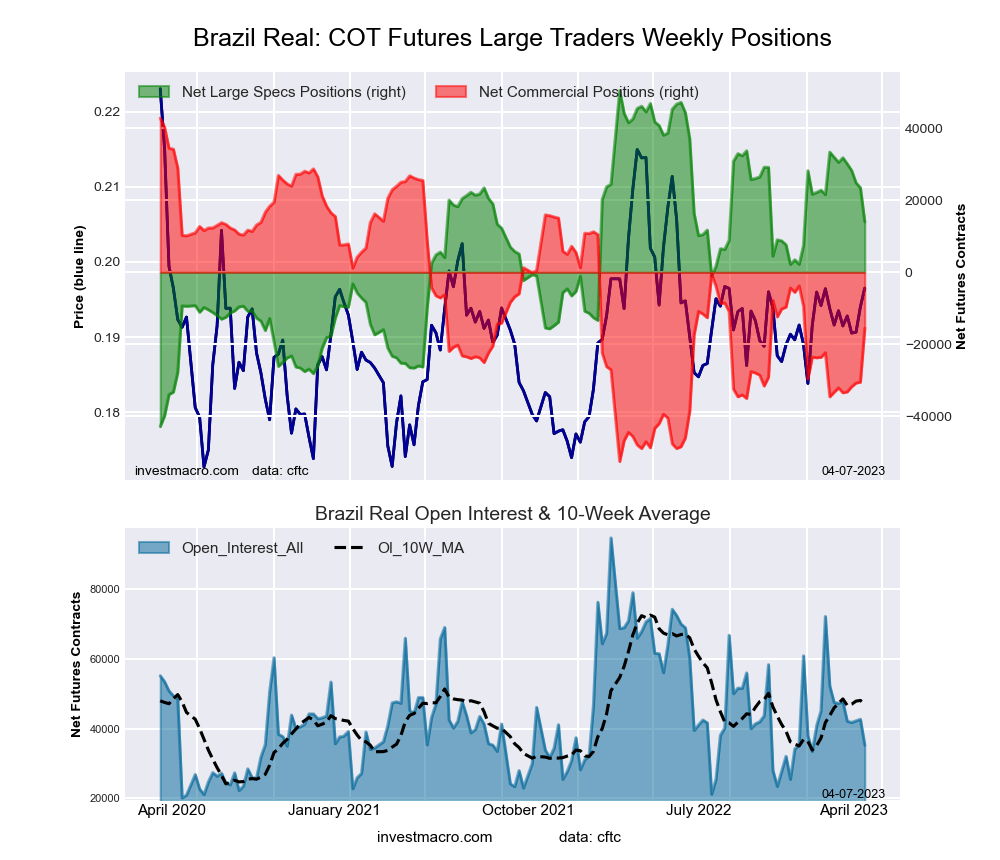
Brazilian Real Futures:
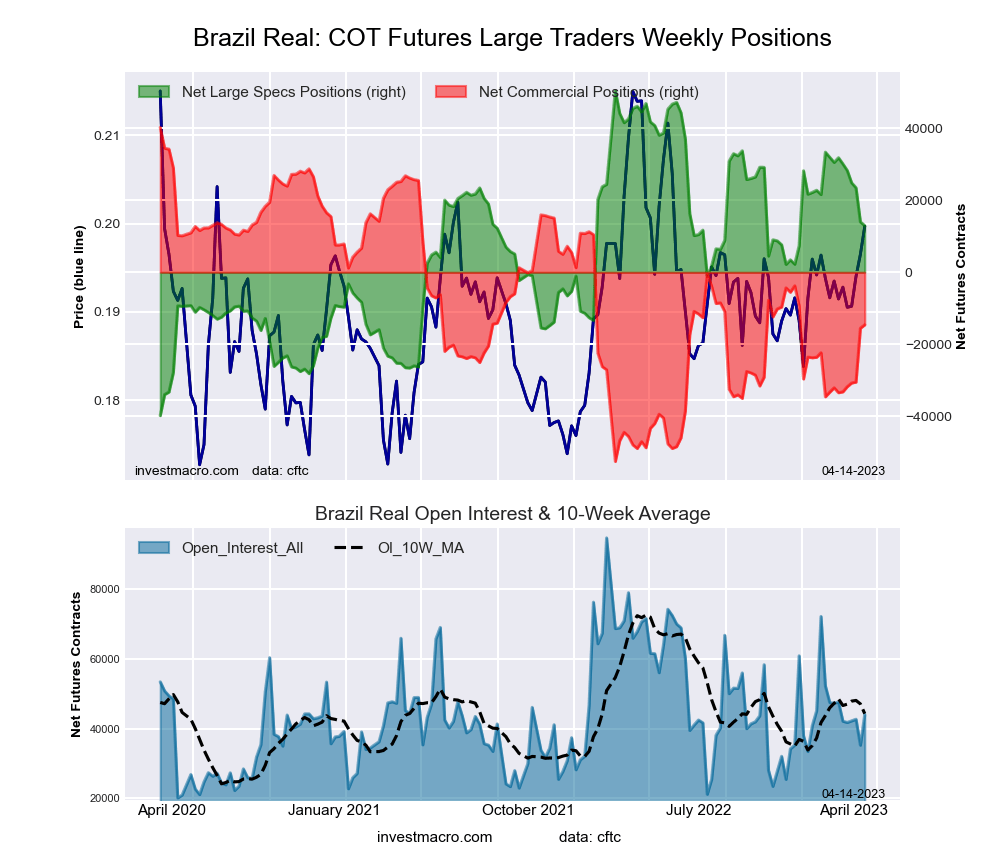 The Brazilian Real large speculator standing this week totaled a net position of 12,945 contracts in the data reported through Tuesday. This was a weekly lowering of -1,058 contracts from the previous week which had a total of 14,003 net contracts.
This week’s current strength score (the trader positioning range over the past three years, measured from 0 to 100) shows the speculators are currently Bullish with a score of 52.3 percent. The commercials are Bearish with a score of 46.7 percent and the small traders (not shown in chart) are Bullish with a score of 57.1 percent.
| BRAZIL REAL Statistics | SPECULATORS | COMMERCIALS | SMALL TRADERS |
| – Percent of Open Interest Longs: | 70.0 | 20.3 | 9.4 |
| – Percent of Open Interest Shorts: | 40.6 | 53.4 | 5.6 |
| – Net Position: | 12,945 | -14,593 | 1,648 |
| – Gross Longs: | 30,795 | 8,916 | 4,132 |
| – Gross Shorts: | 17,850 | 23,509 | 2,484 |
| – Long to Short Ratio: | 1.7 to 1 | 0.4 to 1 | 1.7 to 1 |
| NET POSITION TREND: | | | |
| – Strength Index Score (3 Year Range Pct): | 52.3 | 46.7 | 57.1 |
| – Strength Index Reading (3 Year Range): | Bullish | Bearish | Bullish |
| NET POSITION MOVEMENT INDEX: | | | |
| – 6-Week Change in Strength Index: | -24.0 | 23.2 | -0.0 |
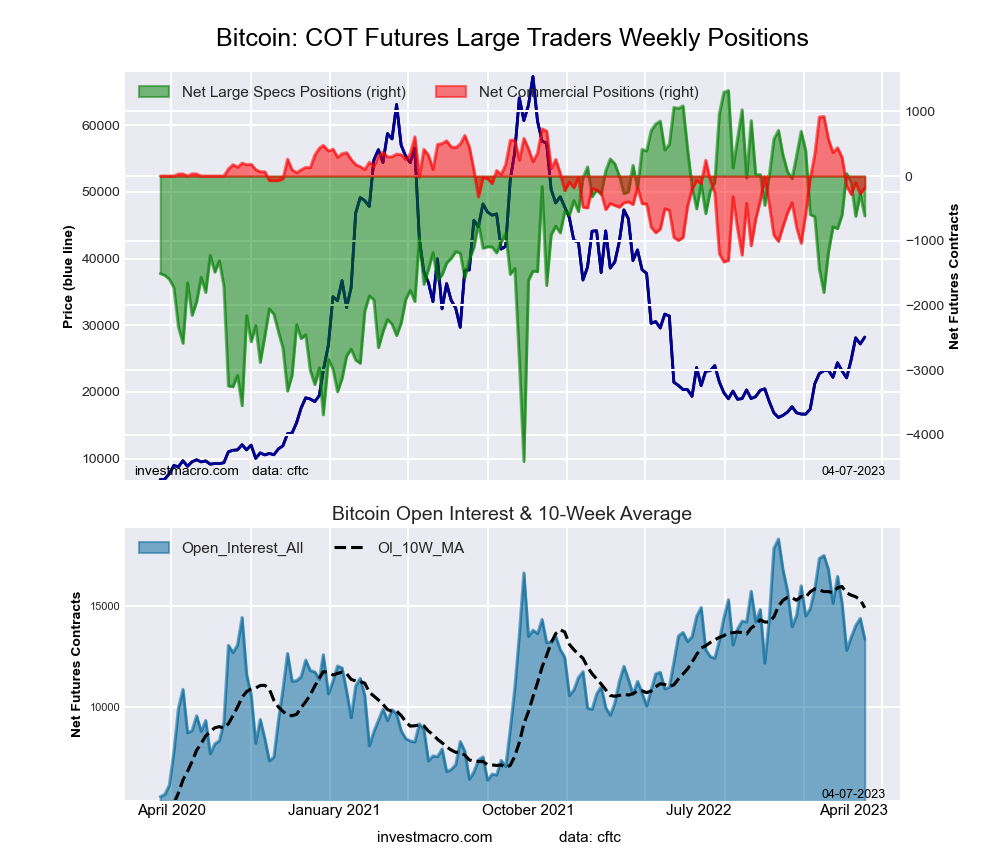
Bitcoin Futures:
 The Bitcoin large speculator standing this week totaled a net position of -1,122 contracts in the data reported through Tuesday. This was a weekly lowering of -507 contracts from the previous week which had a total of -615 net contracts.
This week’s current strength score (the trader positioning range over the past three years, measured from 0 to 100) shows the speculators are currently Bullish with a score of 57.4 percent. The commercials are Bullish with a score of 75.7 percent and the small traders (not shown in chart) are Bearish with a score of 30.0 percent.
| BITCOIN Statistics | SPECULATORS | COMMERCIALS | SMALL TRADERS |
| – Percent of Open Interest Longs: | 76.5 | 5.4 | 9.7 |
| – Percent of Open Interest Shorts: | 83.5 | 3.0 | 5.0 |
| – Net Position: | -1,122 | 373 | 749 |
| – Gross Longs: | 12,216 | 857 | 1,542 |
| – Gross Shorts: | 13,338 | 484 | 793 |
| – Long to Short Ratio: | 0.9 to 1 | 1.8 to 1 | 1.9 to 1 |
| NET POSITION TREND: | | | |
| – Strength Index Score (3 Year Range Pct): | 57.4 | 75.7 | 30.0 |
| – Strength Index Reading (3 Year Range): | Bullish | Bullish | Bearish |
| NET POSITION MOVEMENT INDEX: | | | |
| – 6-Week Change in Strength Index: | -9.1 | 3.9 | 9.9 |
Article By InvestMacro – Receive our weekly COT Newsletter
*COT Report: The COT data, released weekly to the public each Friday, is updated through the most recent Tuesday (data is 3 days old) and shows a quick view of how large speculators or non-commercials (for-profit traders) were positioned in the futures markets.
The CFTC categorizes trader positions according to commercial hedgers (traders who use futures contracts for hedging as part of the business), non-commercials (large traders who speculate to realize trading profits) and nonreportable traders (usually small traders/speculators) as well as their open interest (contracts open in the market at time of reporting). See CFTC criteria here.


