By InvestMacro
Here are the latest charts and statistics for the Commitment of Traders (COT) data published by the Commodities Futures Trading Commission (CFTC).
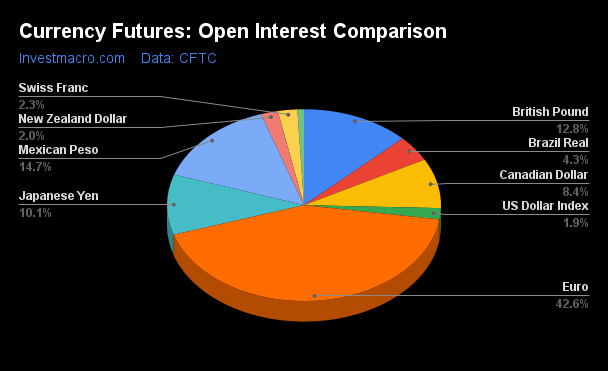
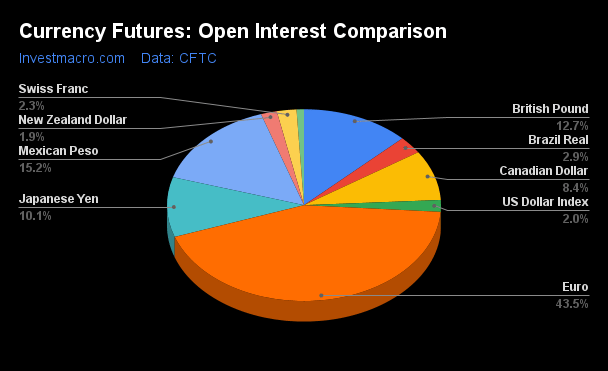
The latest COT data is updated through Tuesday April 25th and shows a quick view of how large market participants (for-profit speculators and commercial traders) were positioned in the futures markets. All currency positions are in direct relation to the US dollar where, for example, a bet for the euro is a bet that the euro will rise versus the dollar while a bet against the euro will be a bet that the euro will decline versus the dollar.
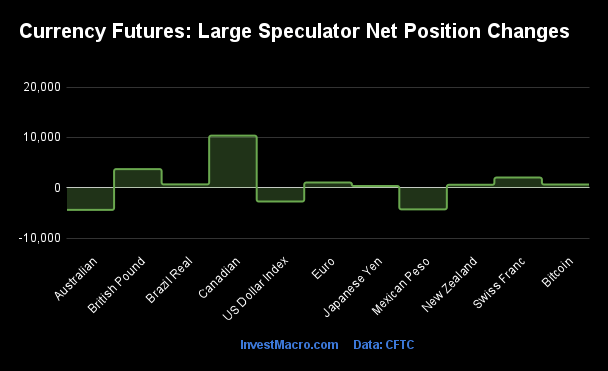
Weekly Speculator Changes led by EuroFX & British Pound
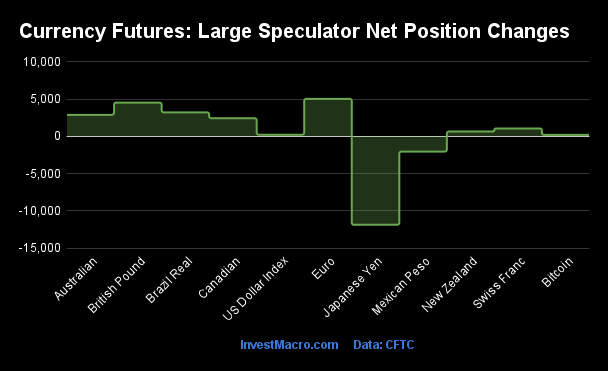
The COT currency market speculator bets were higher this week as nine out of the eleven currency markets we cover had higher positioning while the other two markets had lower speculator contracts.
Leading the gains for the currency markets was the EuroFX (5,039 contracts), British Pound (4,537 contracts), Brazilian Real (3,223 contracts), the Australian Dollar (2,894 contracts), the Canadian Dollar (2,442 contracts), the US Dollar Index (226 contracts), Swiss Franc (1,064 contracts), Bitcoin (196 contracts) and the New Zealand Dollar (652 contracts) also recording positive weeks.
The currencies seeing declines in speculator bets on the week were the Japanese Yen (-11,875 contracts) and the Mexican Peso (-2,043 contracts) seeing lower bets on the week.
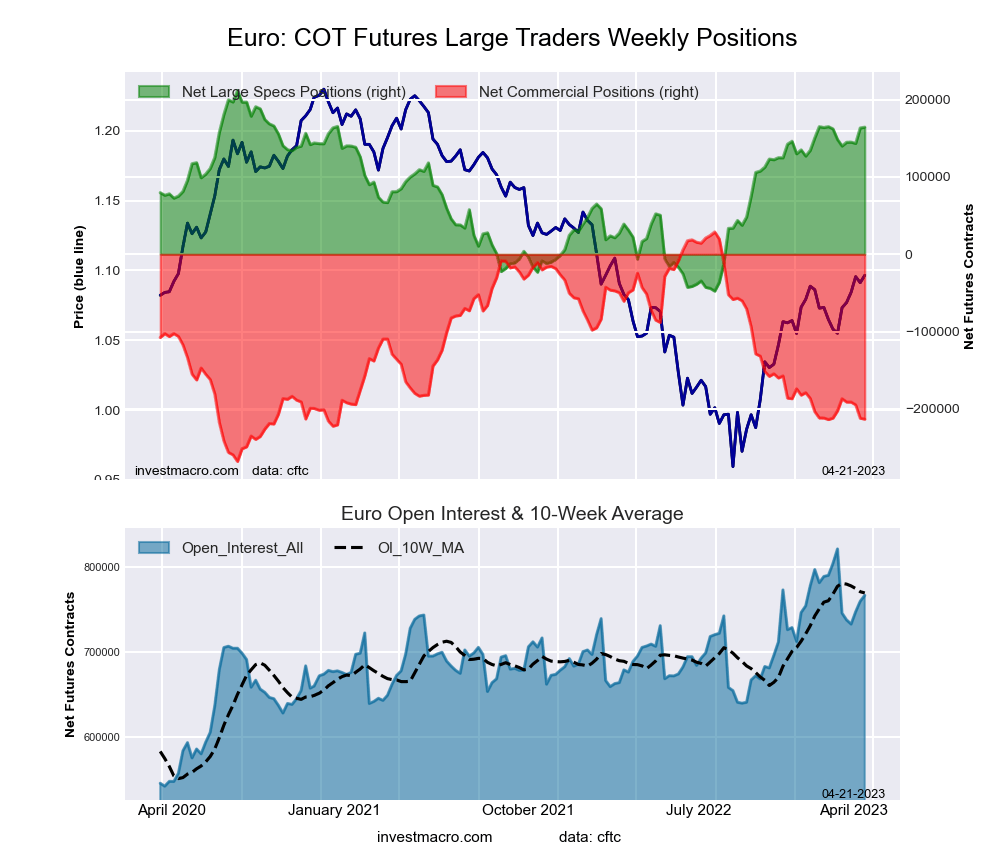
Euro Speculators boost their bullish bets to 133-week high
Highlighting the COT currency’s data this week is the rising bullishness of the speculator’s positioning in the Euro Currency. Euro speculator bets turned from bearish to bullish on September 20th of 2022 and have steadily increased in positive sentiment. The Euro positions have now been above the +100,000 contract threshold for 26 straight weeks, the best streak since 2021.
This week, the large speculative Euro positions went higher for a third consecutive week and for the fifth time in the past six weeks. Euro weekly positions have now increased by a total of +29,444 contracts over these past six weeks. This positive sentiment has pushed the overall bullish standing to the highest level in 133-weeks, dating back to October 6th of 2020.
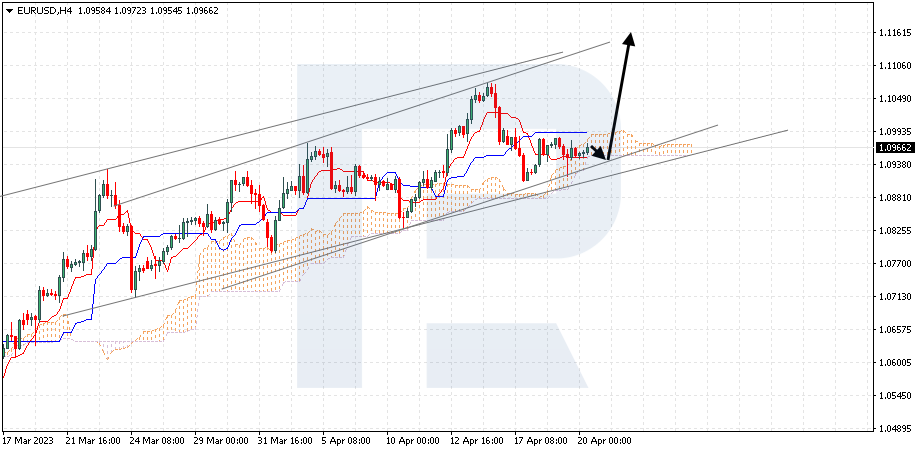
The Euro exchange rate against the US Dollar has also been on the rise and this week hit it’s highest level since March of 2022 above the 1.11 exchange level. Since late-February, the Euro has had higher weekly closes in seven out of the past nine weeks and is now higher by over 15 percent since it’s multi-decade low of 0.9592 in September.
| Apr-25-2023 | OI | OI-Index | Spec-Net | Spec-Index | Com-Net | COM-Index | Smalls-Net | Smalls-Index |
|---|
| USD Index | 34,441 | 33 | 10,739 | 43 | -12,711 | 56 | 1,972 | 38 |
| EUR | 772,882 | 83 | 169,400 | 84 | -224,437 | 15 | 55,037 | 67 |
| GBP | 231,666 | 56 | 5,839 | 74 | -10,530 | 27 | 4,691 | 67 |
| JPY | 184,041 | 37 | -68,744 | 27 | 72,625 | 71 | -3,881 | 46 |
| CHF | 41,736 | 41 | -3,656 | 45 | 2,701 | 49 | 955 | 61 |
| CAD | 151,786 | 31 | -43,791 | 14 | 45,878 | 87 | -2,087 | 18 |
| AUD | 178,757 | 72 | -39,462 | 48 | 53,746 | 59 | -14,284 | 18 |
| NZD | 36,603 | 25 | -3,252 | 45 | 3,928 | 56 | -676 | 44 |
| MXN | 267,276 | 61 | 54,128 | 90 | -58,607 | 11 | 4,479 | 84 |
| RUB | 20,930 | 4 | 7,543 | 31 | -7,150 | 69 | -393 | 24 |
| BRL | 78,748 | 78 | 16,819 | 57 | -16,343 | 45 | -476 | 40 |
| Bitcoin | 14,064 | 64 | -293 | 72 | -296 | 0 | 589 | 26 |
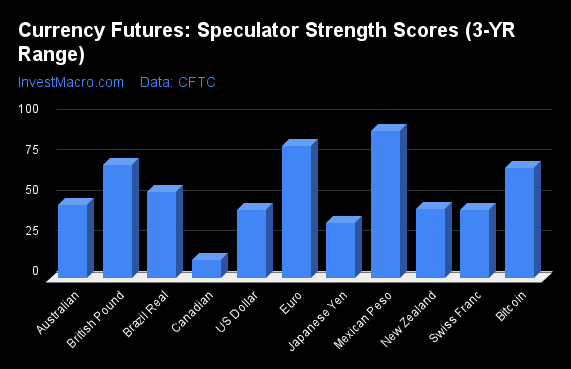
Strength Scores led by Mexican Peso & EuroFX
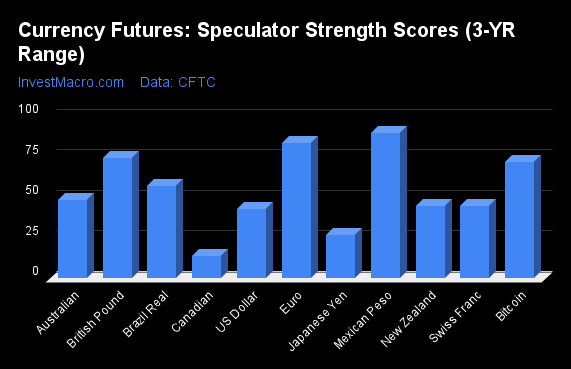
COT Strength Scores (a normalized measure of Speculator positions over a 3-Year range, from 0 to 100 where above 80 is Extreme-Bullish and below 20 is Extreme-Bearish) showed that the Mexican Peso (90 percent) and the EuroFX (84 percent) lead the currency markets this week. The British Pound (74 percent), Bitcoin (72 percent) and the Brazilian Real (57 percent) come in as the next highest in the weekly strength scores.
On the downside, the Canadian Dollar (14 percent) comes in at the lowest strength levels currently and is in Extreme-Bearish territory (below 20 percent). The next lowest strength scores are the Japanese Yen (27 percent), the US Dollar Index (43 percent) and the New Zealand Dollar (45 percent).
Strength Statistics:
US Dollar Index (42.8 percent) vs US Dollar Index previous week (42.5 percent)
EuroFX (83.7 percent) vs EuroFX previous week (81.7 percent)
British Pound Sterling (74.0 percent) vs British Pound Sterling previous week (70.1 percent)
Japanese Yen (26.5 percent) vs Japanese Yen previous week (33.9 percent)
Swiss Franc (44.9 percent) vs Swiss Franc previous week (42.1 percent)
Canadian Dollar (13.7 percent) vs Canadian Dollar previous week (11.4 percent)
Australian Dollar (48.2 percent) vs Australian Dollar previous week (45.6 percent)
New Zealand Dollar (44.8 percent) vs New Zealand Dollar previous week (43.0 percent)
Mexican Peso (89.6 percent) vs Mexican Peso previous week (91.1 percent)
Brazilian Real (57.2 percent) vs Brazilian Real previous week (53.1 percent)
Bitcoin (71.8 percent) vs Bitcoin previous week (68.4 percent)
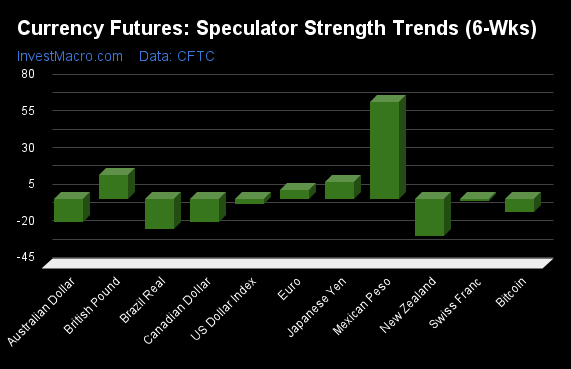
British Pound & Swiss Franc top the 6-Week Strength Trends
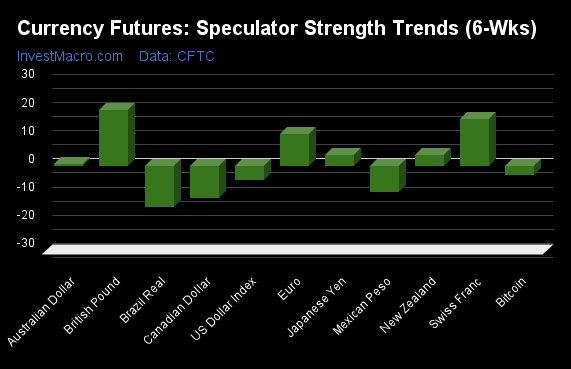
COT Strength Score Trends (or move index, calculates the 6-week changes in strength scores) showed that the British Pound (20 percent) and the Swiss Franc (17 percent) lead the past six weeks trends for the currencies. The EuroFX (11 percent), the Japanese Yen (4 percent) and the New Zealand Dollar (4 percent) are the next highest positive movers in the latest trends data.
The Brazilian Real (-15 percent) leads the downside trend scores currently with the Canadian Dollar (-11 percent), Mexican Peso (-9 percent) and the US Dollar Index (-5 percent) following next with lower trend scores.
Strength Trend Statistics:
US Dollar Index (-5.0 percent) vs US Dollar Index previous week (-3.4 percent)
EuroFX (11.3 percent) vs EuroFX previous week (6.1 percent)
British Pound Sterling (19.9 percent) vs British Pound Sterling previous week (16.1 percent)
Japanese Yen (3.7 percent) vs Japanese Yen previous week (11.4 percent)
Swiss Franc (16.7 percent) vs Swiss Franc previous week (-2.0 percent)
Canadian Dollar (-11.3 percent) vs Canadian Dollar previous week (-15.9 percent)
Australian Dollar (0.6 percent) vs Australian Dollar previous week (-16.3 percent)
New Zealand Dollar (4.0 percent) vs New Zealand Dollar previous week (-25.8 percent)
Mexican Peso (-9.1 percent) vs Mexican Peso previous week (66.2 percent)
Brazilian Real (-14.6 percent) vs Brazilian Real previous week (-21.0 percent)
Bitcoin (-3.3 percent) vs Bitcoin previous week (-9.2 percent)
Individual COT Forex Markets:
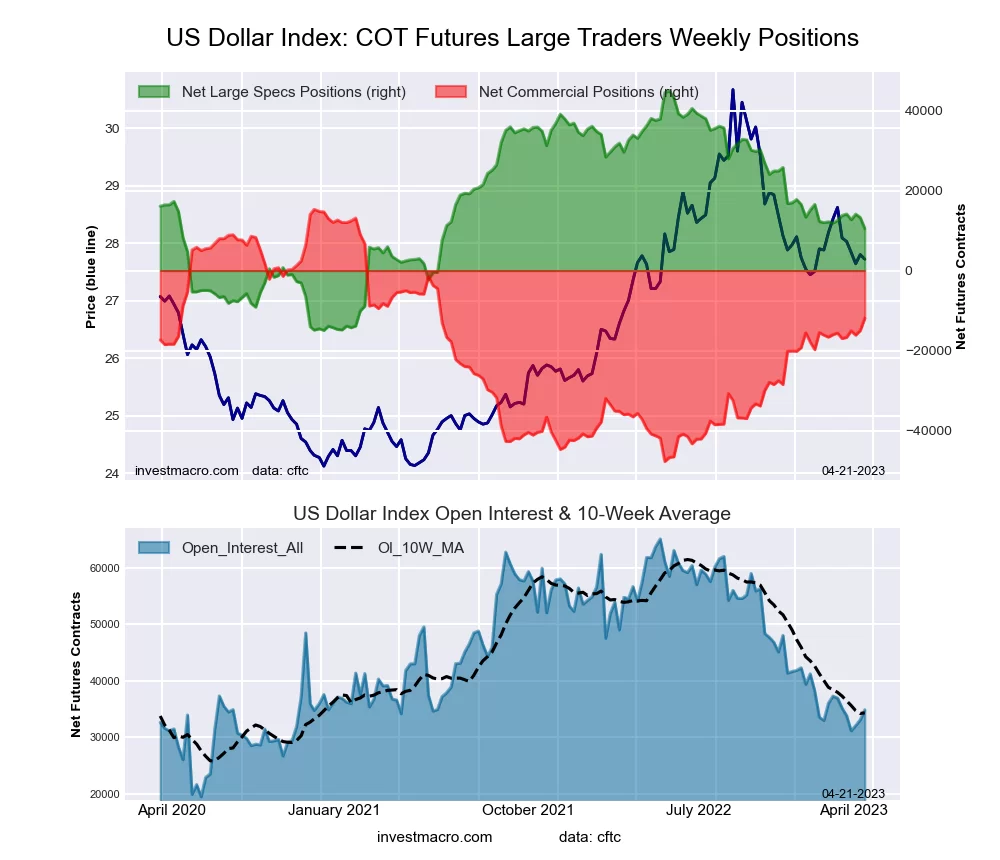
US Dollar Index Futures:
 The US Dollar Index large speculator standing this week came in at a net position of 10,739 contracts in the data reported through Tuesday. This was a weekly gain of 226 contracts from the previous week which had a total of 10,513 net contracts.
This week’s current strength score (the trader positioning range over the past three years, measured from 0 to 100) shows the speculators are currently Bearish with a score of 42.8 percent. The commercials are Bullish with a score of 55.6 percent and the small traders (not shown in chart) are Bearish with a score of 38.1 percent.
| US DOLLAR INDEX Statistics | SPECULATORS | COMMERCIALS | SMALL TRADERS |
| – Percent of Open Interest Longs: | 70.1 | 10.0 | 15.2 |
| – Percent of Open Interest Shorts: | 38.9 | 46.9 | 9.4 |
| – Net Position: | 10,739 | -12,711 | 1,972 |
| – Gross Longs: | 24,149 | 3,432 | 5,219 |
| – Gross Shorts: | 13,410 | 16,143 | 3,247 |
| – Long to Short Ratio: | 1.8 to 1 | 0.2 to 1 | 1.6 to 1 |
| NET POSITION TREND: | | | |
| – Strength Index Score (3 Year Range Pct): | 42.8 | 55.6 | 38.1 |
| – Strength Index Reading (3 Year Range): | Bearish | Bullish | Bearish |
| NET POSITION MOVEMENT INDEX: | | | |
| – 6-Week Change in Strength Index: | -5.0 | 6.8 | -13.9 |
Euro Currency Futures:
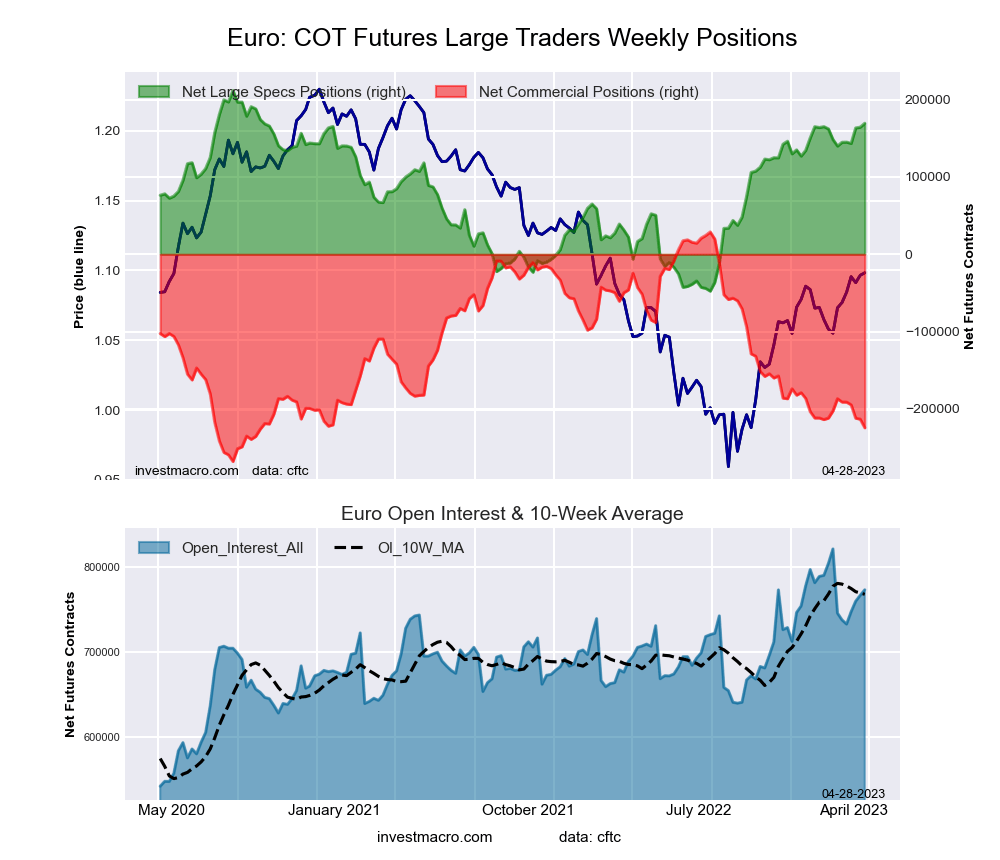 The Euro Currency large speculator standing this week came in at a net position of 169,400 contracts in the data reported through Tuesday. This was a weekly increase of 5,039 contracts from the previous week which had a total of 164,361 net contracts.
This week’s current strength score (the trader positioning range over the past three years, measured from 0 to 100) shows the speculators are currently Bullish-Extreme with a score of 83.7 percent. The commercials are Bearish-Extreme with a score of 14.7 percent and the small traders (not shown in chart) are Bullish with a score of 66.8 percent.
| EURO Currency Statistics | SPECULATORS | COMMERCIALS | SMALL TRADERS |
| – Percent of Open Interest Longs: | 31.5 | 54.2 | 12.3 |
| – Percent of Open Interest Shorts: | 9.6 | 83.2 | 5.1 |
| – Net Position: | 169,400 | -224,437 | 55,037 |
| – Gross Longs: | 243,516 | 418,842 | 94,777 |
| – Gross Shorts: | 74,116 | 643,279 | 39,740 |
| – Long to Short Ratio: | 3.3 to 1 | 0.7 to 1 | 2.4 to 1 |
| NET POSITION TREND: | | | |
| – Strength Index Score (3 Year Range Pct): | 83.7 | 14.7 | 66.8 |
| – Strength Index Reading (3 Year Range): | Bullish-Extreme | Bearish-Extreme | Bullish |
| NET POSITION MOVEMENT INDEX: | | | |
| – 6-Week Change in Strength Index: | 11.3 | -12.7 | 13.0 |
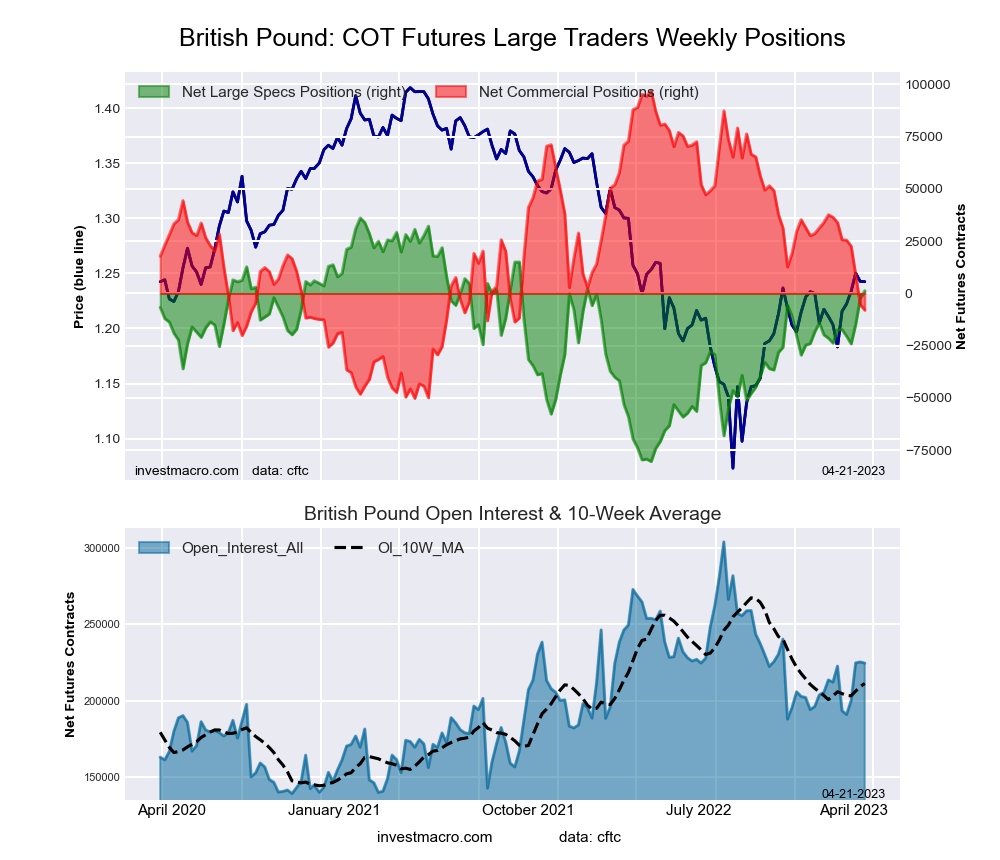
British Pound Sterling Futures:
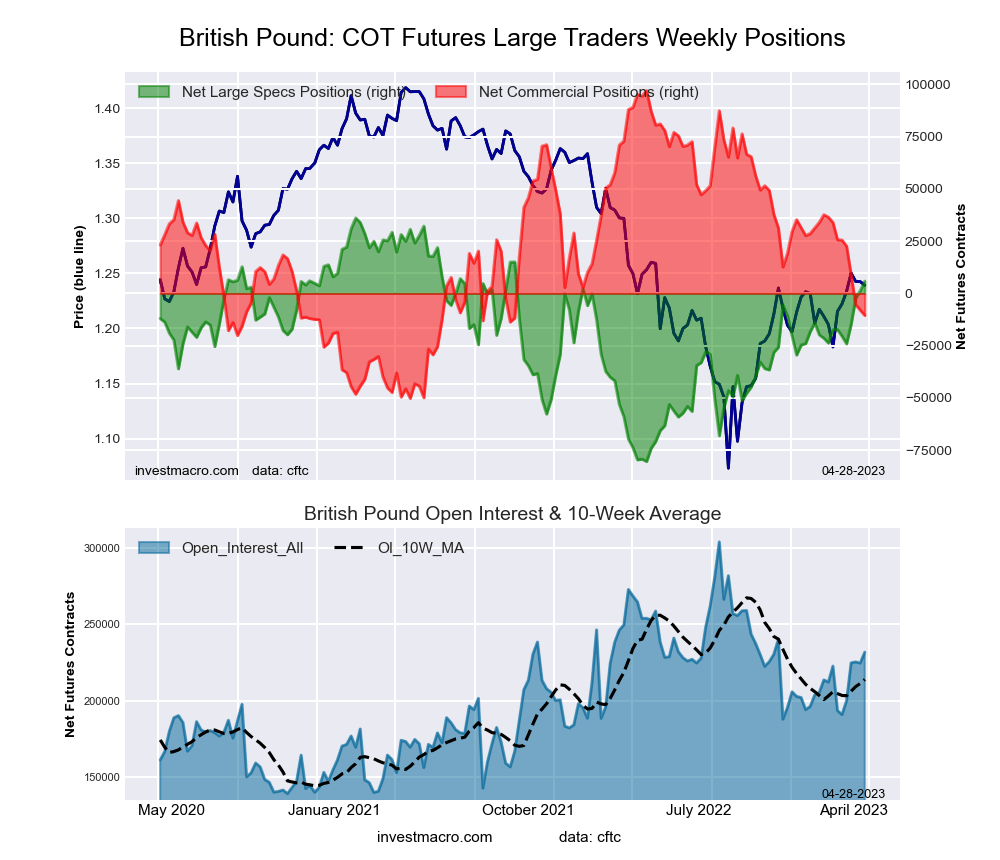 The British Pound Sterling large speculator standing this week came in at a net position of 5,839 contracts in the data reported through Tuesday. This was a weekly increase of 4,537 contracts from the previous week which had a total of 1,302 net contracts.
This week’s current strength score (the trader positioning range over the past three years, measured from 0 to 100) shows the speculators are currently Bullish with a score of 74.0 percent. The commercials are Bearish with a score of 26.9 percent and the small traders (not shown in chart) are Bullish with a score of 67.2 percent.
| BRITISH POUND Statistics | SPECULATORS | COMMERCIALS | SMALL TRADERS |
| – Percent of Open Interest Longs: | 25.6 | 55.0 | 13.5 |
| – Percent of Open Interest Shorts: | 23.1 | 59.5 | 11.5 |
| – Net Position: | 5,839 | -10,530 | 4,691 |
| – Gross Longs: | 59,405 | 127,306 | 31,336 |
| – Gross Shorts: | 53,566 | 137,836 | 26,645 |
| – Long to Short Ratio: | 1.1 to 1 | 0.9 to 1 | 1.2 to 1 |
| NET POSITION TREND: | | | |
| – Strength Index Score (3 Year Range Pct): | 74.0 | 26.9 | 67.2 |
| – Strength Index Reading (3 Year Range): | Bullish | Bearish | Bullish |
| NET POSITION MOVEMENT INDEX: | | | |
| – 6-Week Change in Strength Index: | 19.9 | -24.6 | 25.7 |
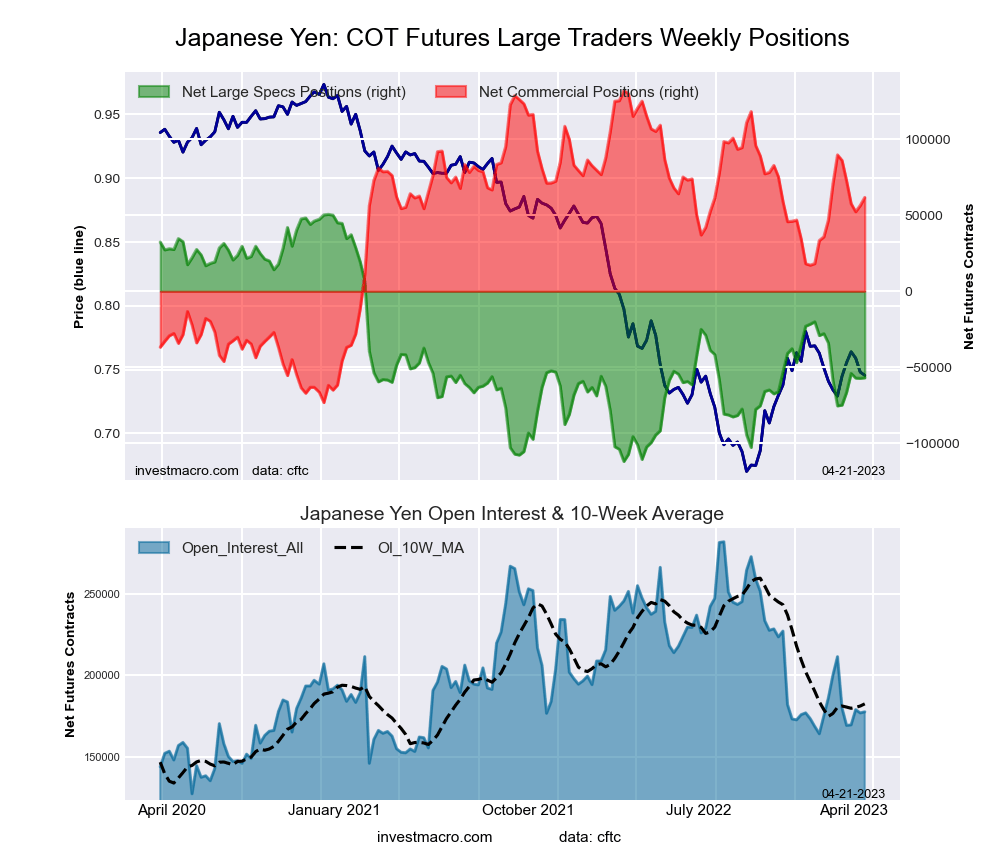
Japanese Yen Futures:
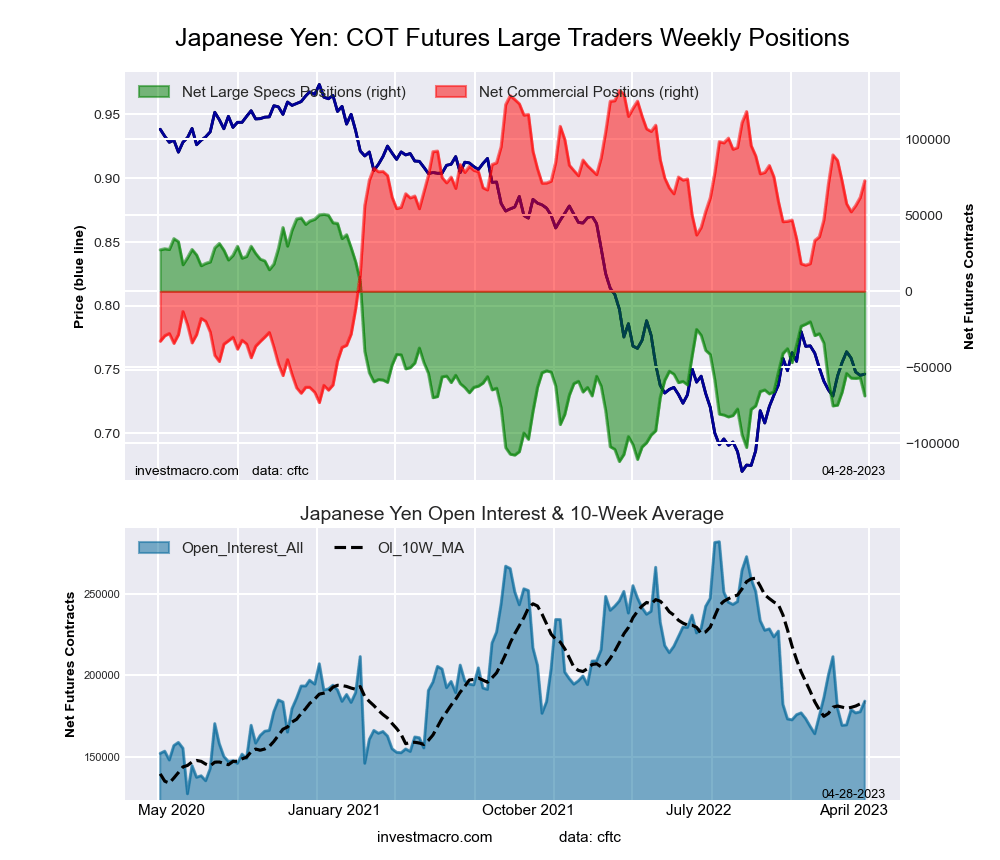 The Japanese Yen large speculator standing this week came in at a net position of -68,744 contracts in the data reported through Tuesday. This was a weekly fall of -11,875 contracts from the previous week which had a total of -56,869 net contracts.
This week’s current strength score (the trader positioning range over the past three years, measured from 0 to 100) shows the speculators are currently Bearish with a score of 26.5 percent. The commercials are Bullish with a score of 71.1 percent and the small traders (not shown in chart) are Bearish with a score of 45.6 percent.
| JAPANESE YEN Statistics | SPECULATORS | COMMERCIALS | SMALL TRADERS |
| – Percent of Open Interest Longs: | 7.4 | 73.5 | 16.5 |
| – Percent of Open Interest Shorts: | 44.8 | 34.1 | 18.6 |
| – Net Position: | -68,744 | 72,625 | -3,881 |
| – Gross Longs: | 13,680 | 135,330 | 30,358 |
| – Gross Shorts: | 82,424 | 62,705 | 34,239 |
| – Long to Short Ratio: | 0.2 to 1 | 2.2 to 1 | 0.9 to 1 |
| NET POSITION TREND: | | | |
| – Strength Index Score (3 Year Range Pct): | 26.5 | 71.1 | 45.6 |
| – Strength Index Reading (3 Year Range): | Bearish | Bullish | Bearish |
| NET POSITION MOVEMENT INDEX: | | | |
| – 6-Week Change in Strength Index: | 3.7 | -6.5 | 14.9 |
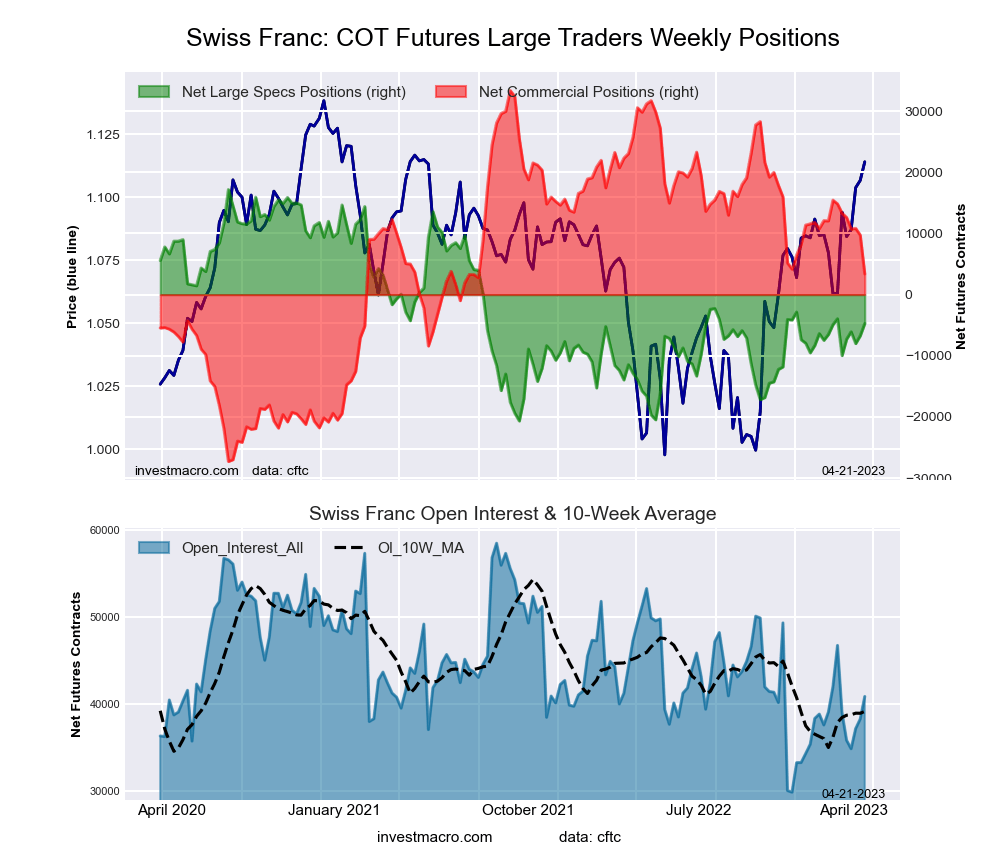
Swiss Franc Futures:
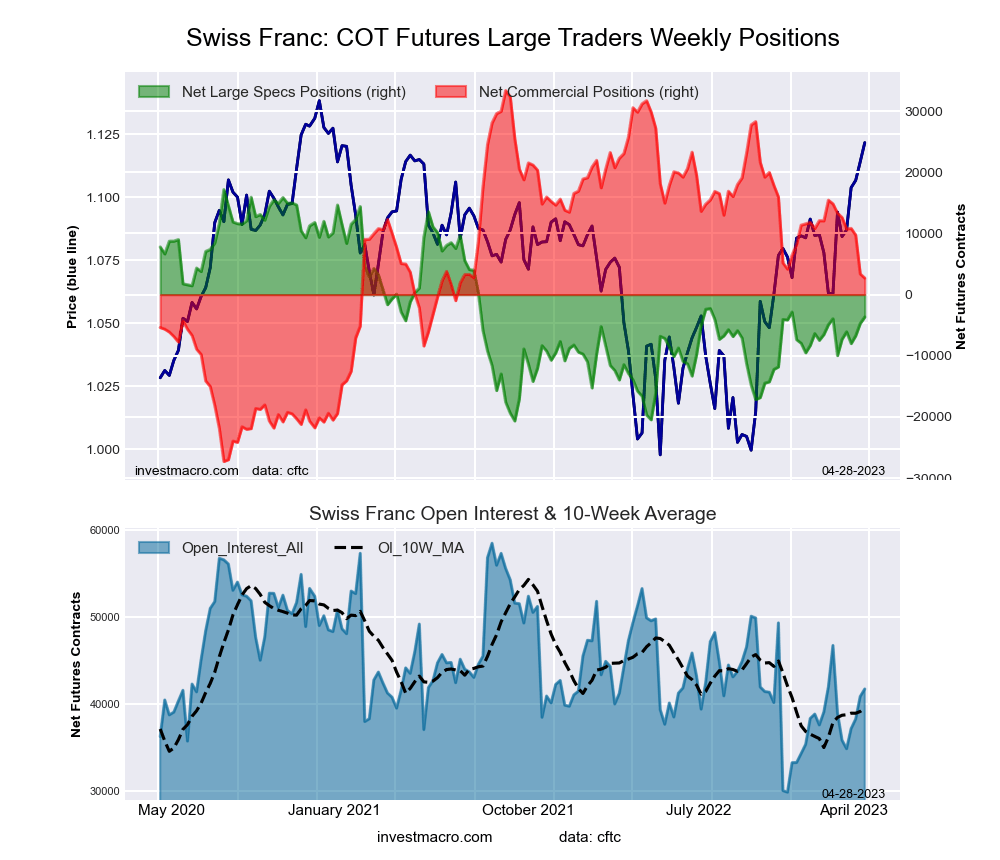 The Swiss Franc large speculator standing this week came in at a net position of -3,656 contracts in the data reported through Tuesday. This was a weekly rise of 1,064 contracts from the previous week which had a total of -4,720 net contracts.
This week’s current strength score (the trader positioning range over the past three years, measured from 0 to 100) shows the speculators are currently Bearish with a score of 44.9 percent. The commercials are Bearish with a score of 49.4 percent and the small traders (not shown in chart) are Bullish with a score of 60.8 percent.
| SWISS FRANC Statistics | SPECULATORS | COMMERCIALS | SMALL TRADERS |
| – Percent of Open Interest Longs: | 15.7 | 44.0 | 36.4 |
| – Percent of Open Interest Shorts: | 24.5 | 37.6 | 34.2 |
| – Net Position: | -3,656 | 2,701 | 955 |
| – Gross Longs: | 6,556 | 18,374 | 15,210 |
| – Gross Shorts: | 10,212 | 15,673 | 14,255 |
| – Long to Short Ratio: | 0.6 to 1 | 1.2 to 1 | 1.1 to 1 |
| NET POSITION TREND: | | | |
| – Strength Index Score (3 Year Range Pct): | 44.9 | 49.4 | 60.8 |
| – Strength Index Reading (3 Year Range): | Bearish | Bearish | Bullish |
| NET POSITION MOVEMENT INDEX: | | | |
| – 6-Week Change in Strength Index: | 16.7 | -17.5 | 14.6 |
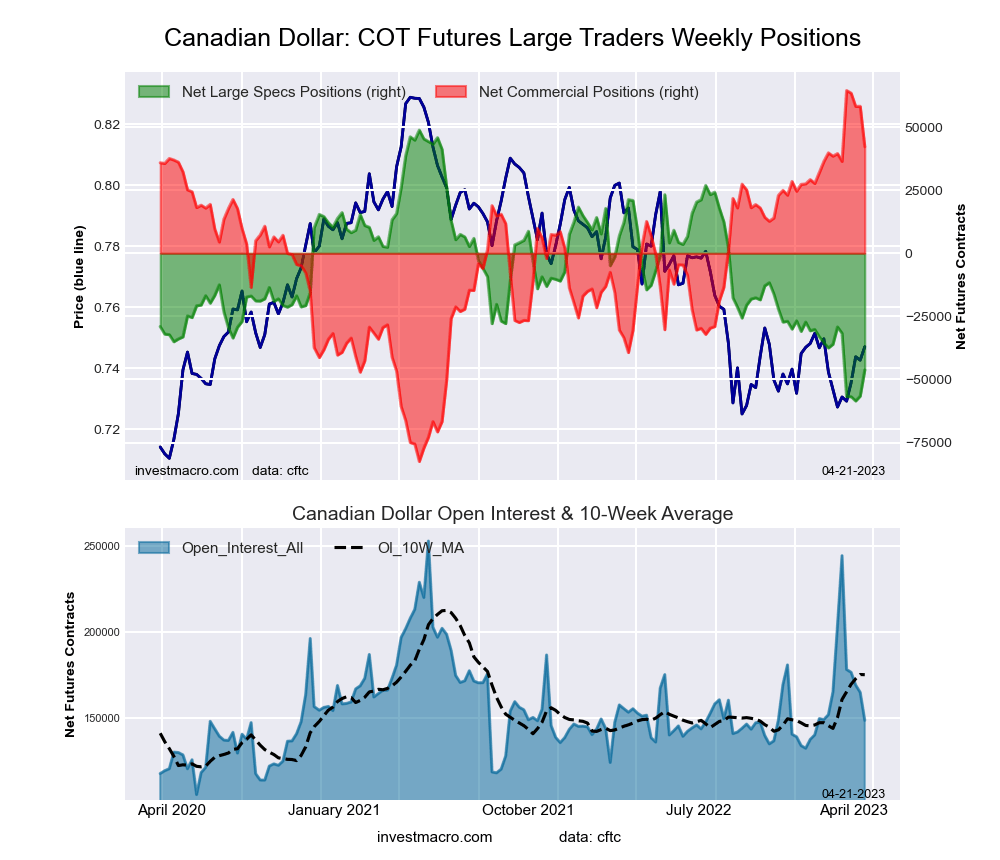
Canadian Dollar Futures:
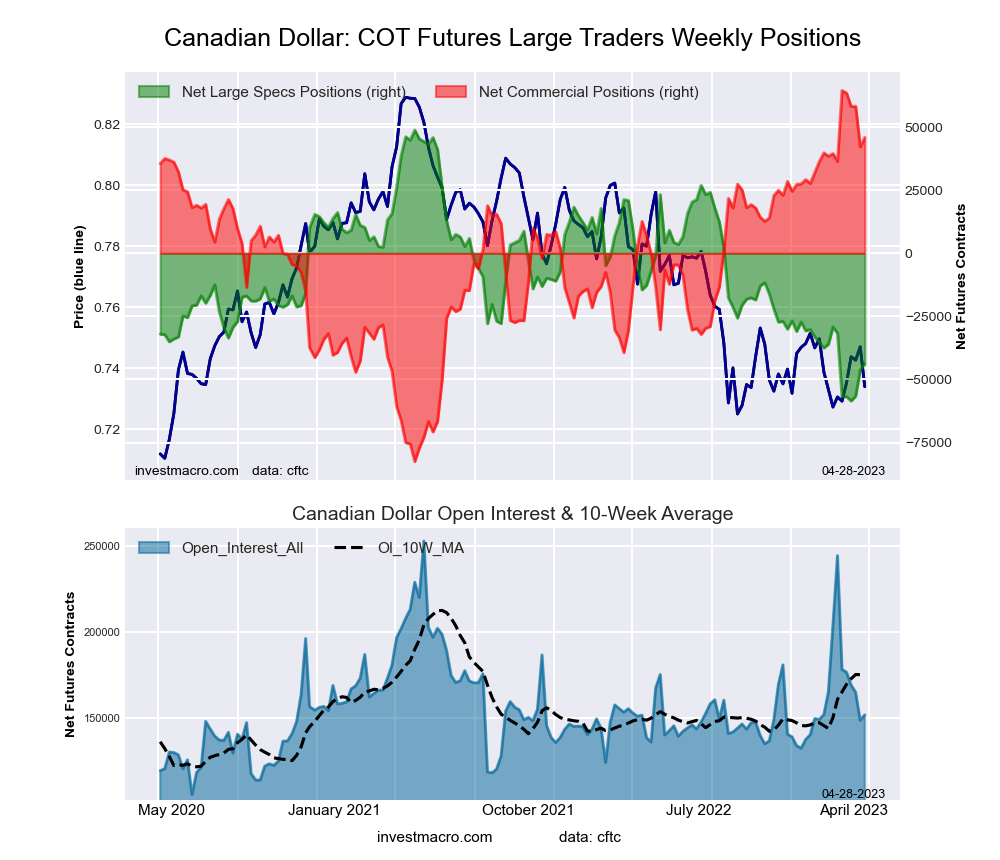 The Canadian Dollar large speculator standing this week came in at a net position of -43,791 contracts in the data reported through Tuesday. This was a weekly lift of 2,442 contracts from the previous week which had a total of -46,233 net contracts.
This week’s current strength score (the trader positioning range over the past three years, measured from 0 to 100) shows the speculators are currently Bearish-Extreme with a score of 13.7 percent. The commercials are Bullish-Extreme with a score of 87.4 percent and the small traders (not shown in chart) are Bearish-Extreme with a score of 18.2 percent.
| CANADIAN DOLLAR Statistics | SPECULATORS | COMMERCIALS | SMALL TRADERS |
| – Percent of Open Interest Longs: | 16.0 | 61.8 | 19.8 |
| – Percent of Open Interest Shorts: | 44.9 | 31.6 | 21.1 |
| – Net Position: | -43,791 | 45,878 | -2,087 |
| – Gross Longs: | 24,295 | 93,784 | 29,997 |
| – Gross Shorts: | 68,086 | 47,906 | 32,084 |
| – Long to Short Ratio: | 0.4 to 1 | 2.0 to 1 | 0.9 to 1 |
| NET POSITION TREND: | | | |
| – Strength Index Score (3 Year Range Pct): | 13.7 | 87.4 | 18.2 |
| – Strength Index Reading (3 Year Range): | Bearish-Extreme | Bullish-Extreme | Bearish-Extreme |
| NET POSITION MOVEMENT INDEX: | | | |
| – 6-Week Change in Strength Index: | -11.3 | 6.5 | 5.7 |
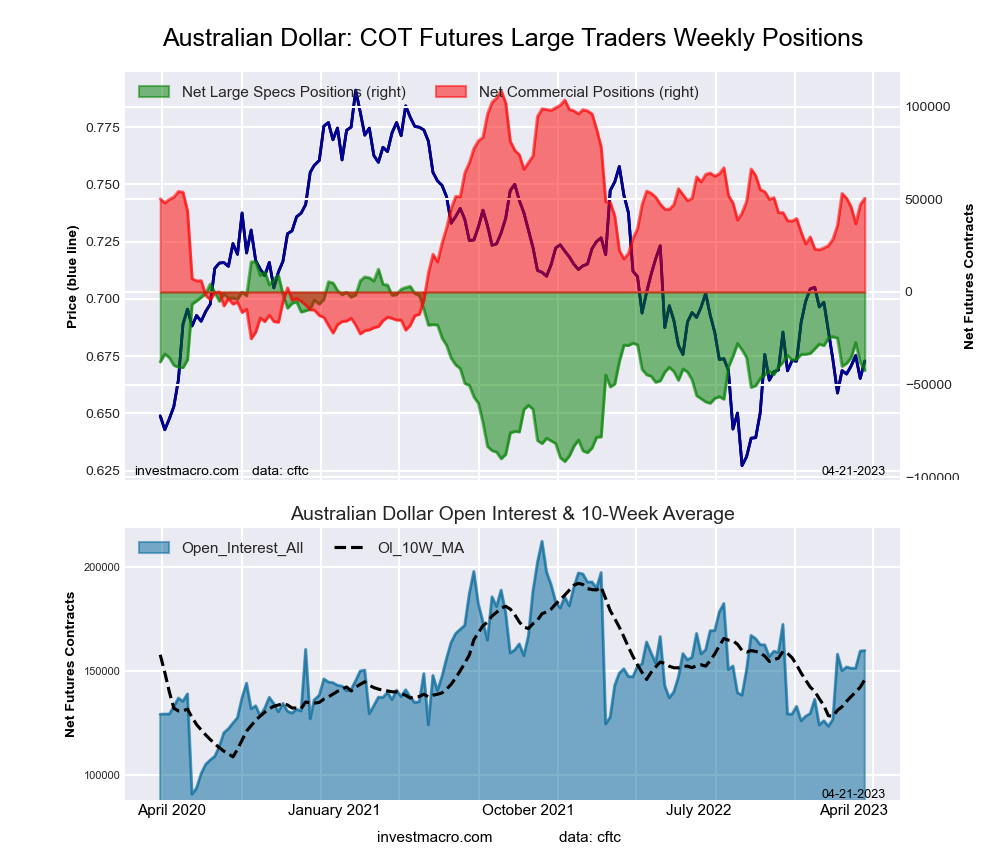
Australian Dollar Futures:
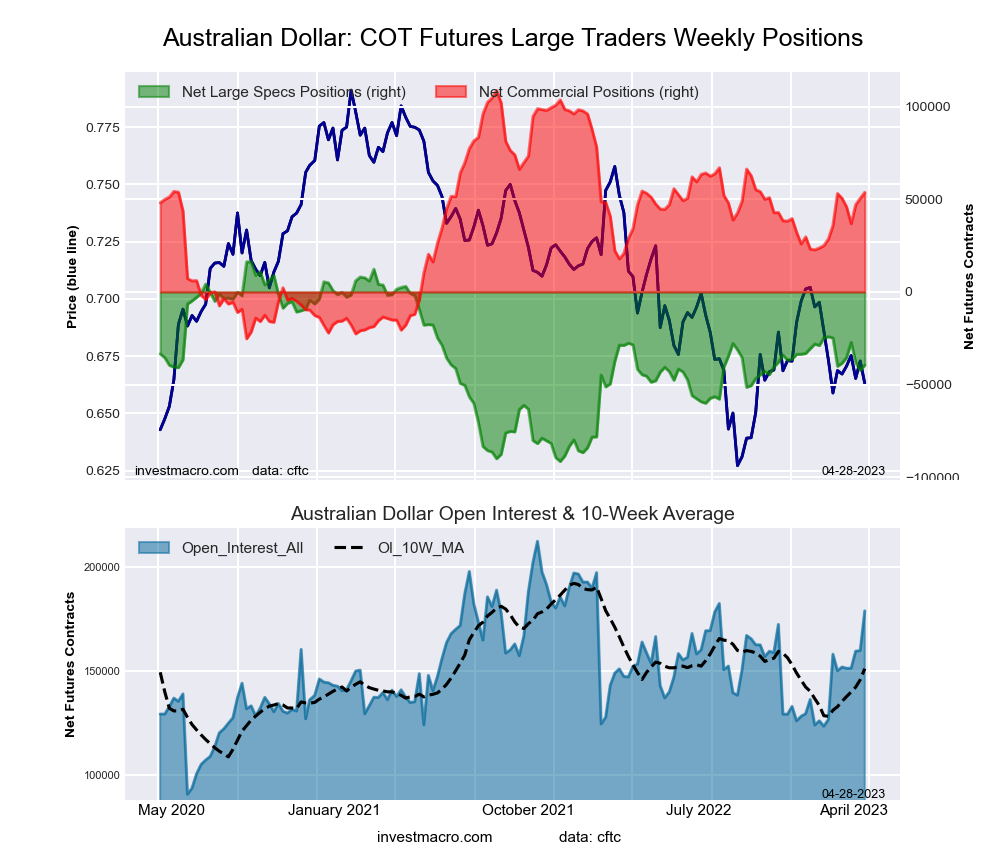 The Australian Dollar large speculator standing this week came in at a net position of -39,462 contracts in the data reported through Tuesday. This was a weekly rise of 2,894 contracts from the previous week which had a total of -42,356 net contracts.
This week’s current strength score (the trader positioning range over the past three years, measured from 0 to 100) shows the speculators are currently Bearish with a score of 48.2 percent. The commercials are Bullish with a score of 59.0 percent and the small traders (not shown in chart) are Bearish-Extreme with a score of 17.6 percent.
| AUSTRALIAN DOLLAR Statistics | SPECULATORS | COMMERCIALS | SMALL TRADERS |
| – Percent of Open Interest Longs: | 30.3 | 55.3 | 10.6 |
| – Percent of Open Interest Shorts: | 52.4 | 25.3 | 18.6 |
| – Net Position: | -39,462 | 53,746 | -14,284 |
| – Gross Longs: | 54,241 | 98,900 | 18,987 |
| – Gross Shorts: | 93,703 | 45,154 | 33,271 |
| – Long to Short Ratio: | 0.6 to 1 | 2.2 to 1 | 0.6 to 1 |
| NET POSITION TREND: | | | |
| – Strength Index Score (3 Year Range Pct): | 48.2 | 59.0 | 17.6 |
| – Strength Index Reading (3 Year Range): | Bearish | Bullish | Bearish-Extreme |
| NET POSITION MOVEMENT INDEX: | | | |
| – 6-Week Change in Strength Index: | 0.6 | 0.5 | -3.0 |
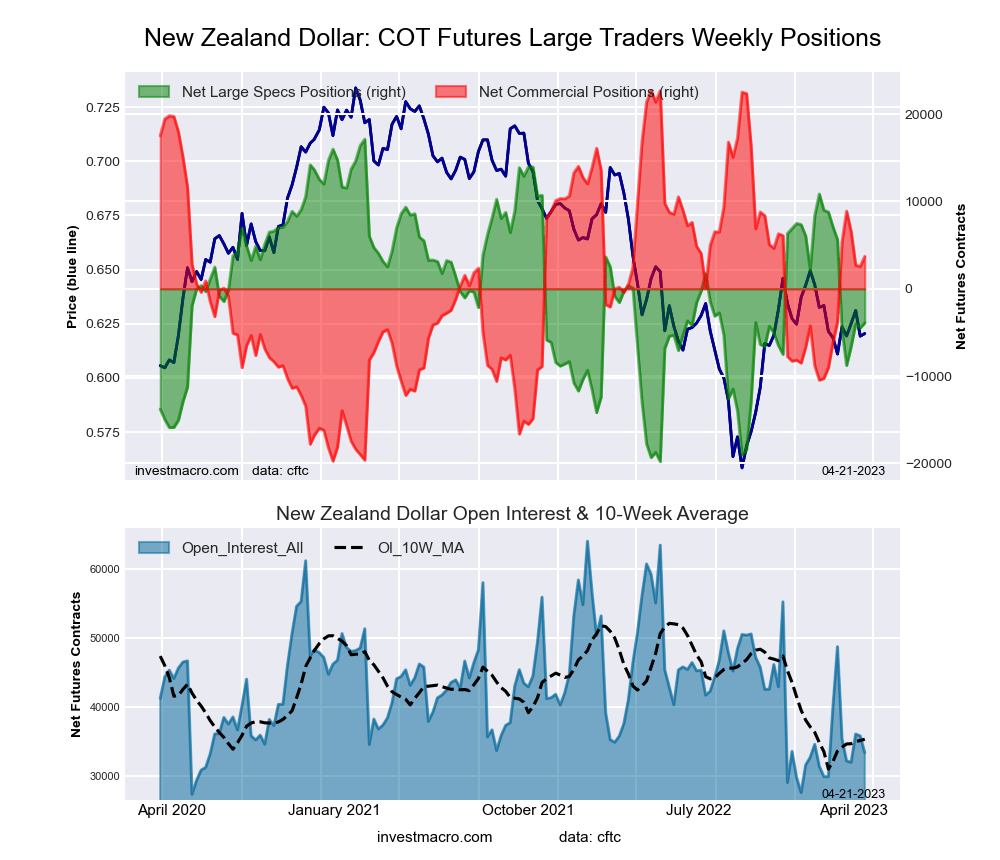
New Zealand Dollar Futures:
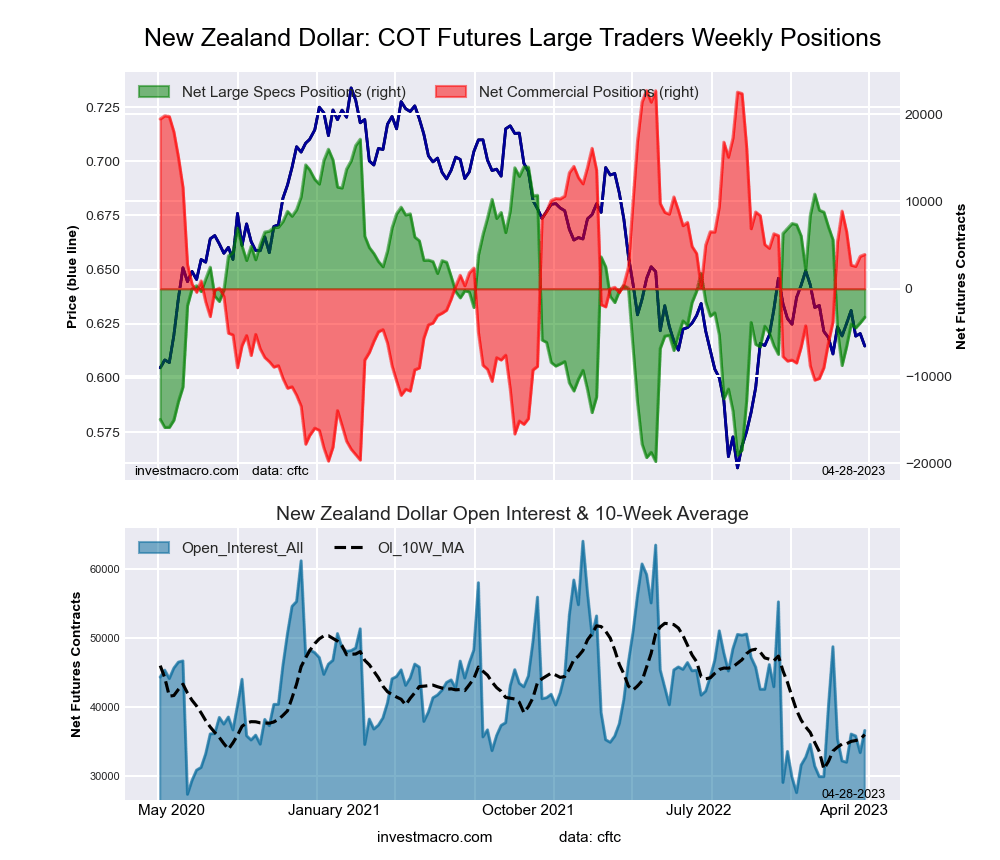 The New Zealand Dollar large speculator standing this week came in at a net position of -3,252 contracts in the data reported through Tuesday. This was a weekly lift of 652 contracts from the previous week which had a total of -3,904 net contracts.
This week’s current strength score (the trader positioning range over the past three years, measured from 0 to 100) shows the speculators are currently Bearish with a score of 44.8 percent. The commercials are Bullish with a score of 55.7 percent and the small traders (not shown in chart) are Bearish with a score of 43.9 percent.
| NEW ZEALAND DOLLAR Statistics | SPECULATORS | COMMERCIALS | SMALL TRADERS |
| – Percent of Open Interest Longs: | 35.7 | 52.8 | 9.5 |
| – Percent of Open Interest Shorts: | 44.6 | 42.1 | 11.3 |
| – Net Position: | -3,252 | 3,928 | -676 |
| – Gross Longs: | 13,070 | 19,334 | 3,465 |
| – Gross Shorts: | 16,322 | 15,406 | 4,141 |
| – Long to Short Ratio: | 0.8 to 1 | 1.3 to 1 | 0.8 to 1 |
| NET POSITION TREND: | | | |
| – Strength Index Score (3 Year Range Pct): | 44.8 | 55.7 | 43.9 |
| – Strength Index Reading (3 Year Range): | Bearish | Bullish | Bearish |
| NET POSITION MOVEMENT INDEX: | | | |
| – 6-Week Change in Strength Index: | 4.0 | -3.4 | -0.5 |
Mexican Peso Futures:
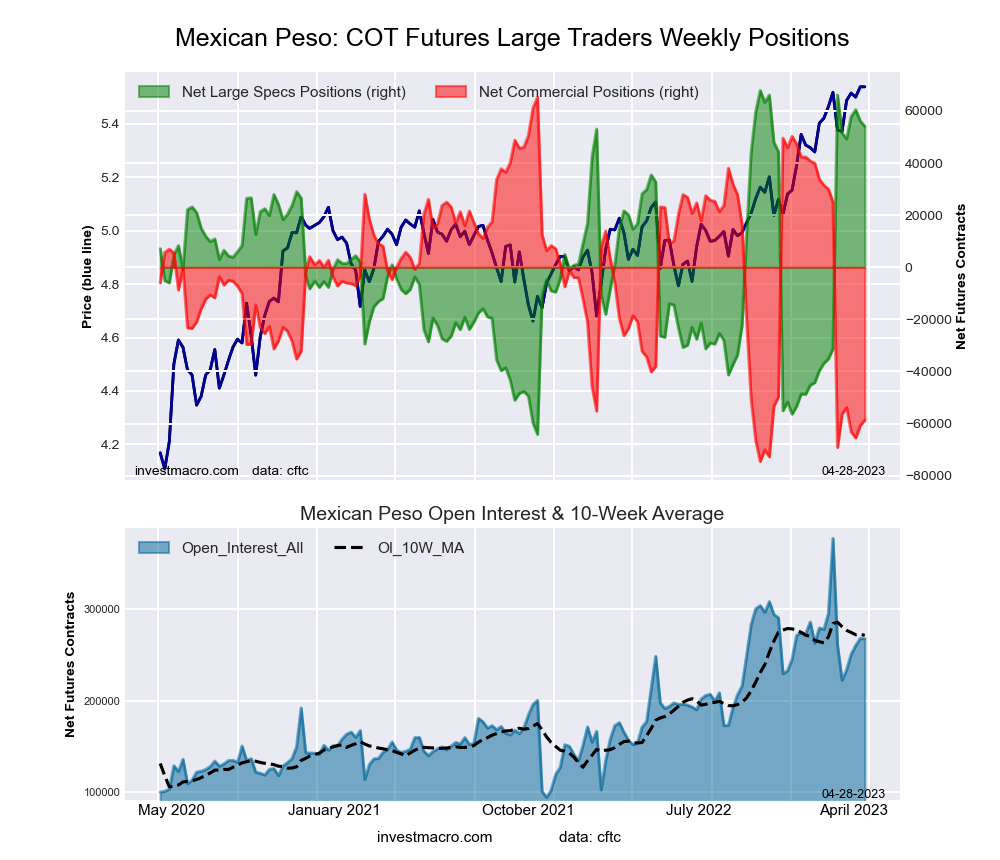 The Mexican Peso large speculator standing this week came in at a net position of 54,128 contracts in the data reported through Tuesday. This was a weekly decline of -2,043 contracts from the previous week which had a total of 56,171 net contracts.
This week’s current strength score (the trader positioning range over the past three years, measured from 0 to 100) shows the speculators are currently Bullish-Extreme with a score of 89.6 percent. The commercials are Bearish-Extreme with a score of 11.4 percent and the small traders (not shown in chart) are Bullish-Extreme with a score of 84.1 percent.
| MEXICAN PESO Statistics | SPECULATORS | COMMERCIALS | SMALL TRADERS |
| – Percent of Open Interest Longs: | 49.8 | 47.2 | 2.8 |
| – Percent of Open Interest Shorts: | 29.5 | 69.1 | 1.1 |
| – Net Position: | 54,128 | -58,607 | 4,479 |
| – Gross Longs: | 133,098 | 126,071 | 7,451 |
| – Gross Shorts: | 78,970 | 184,678 | 2,972 |
| – Long to Short Ratio: | 1.7 to 1 | 0.7 to 1 | 2.5 to 1 |
| NET POSITION TREND: | | | |
| – Strength Index Score (3 Year Range Pct): | 89.6 | 11.4 | 84.1 |
| – Strength Index Reading (3 Year Range): | Bullish-Extreme | Bearish-Extreme | Bullish-Extreme |
| NET POSITION MOVEMENT INDEX: | | | |
| – 6-Week Change in Strength Index: | -9.1 | 7.6 | 8.2 |
Brazilian Real Futures:
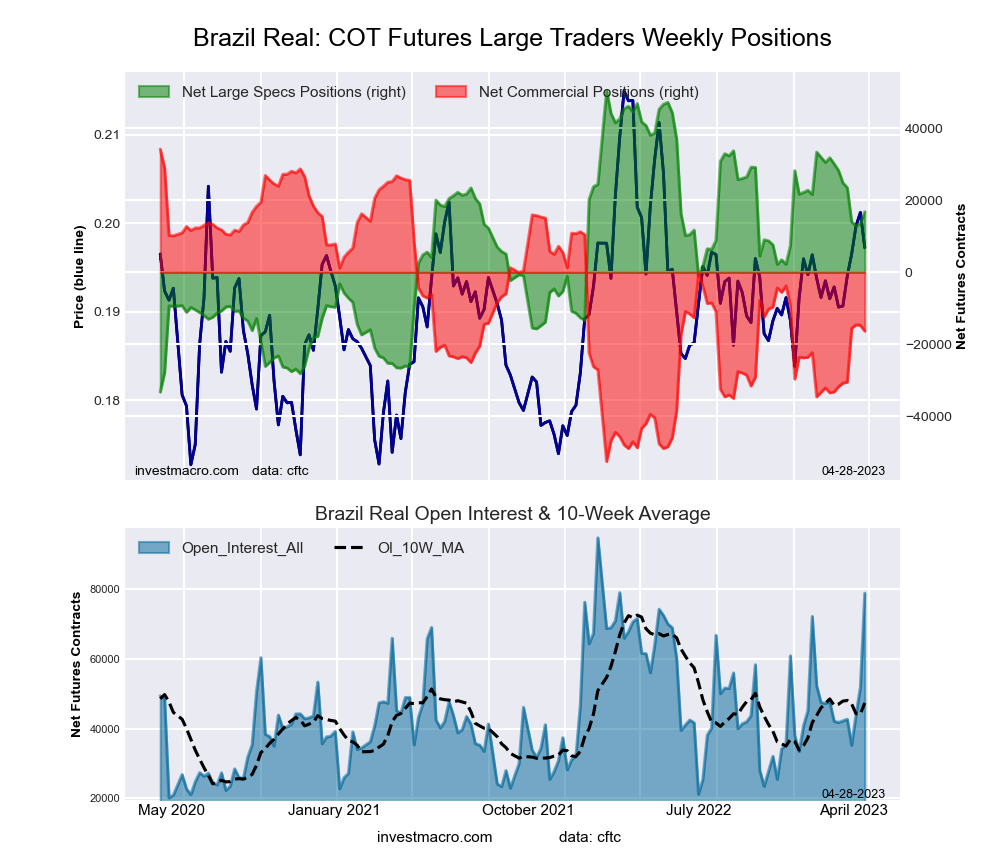 The Brazilian Real large speculator standing this week came in at a net position of 16,819 contracts in the data reported through Tuesday. This was a weekly rise of 3,223 contracts from the previous week which had a total of 13,596 net contracts.
This week’s current strength score (the trader positioning range over the past three years, measured from 0 to 100) shows the speculators are currently Bullish with a score of 57.2 percent. The commercials are Bearish with a score of 44.6 percent and the small traders (not shown in chart) are Bearish with a score of 40.2 percent.
| BRAZIL REAL Statistics | SPECULATORS | COMMERCIALS | SMALL TRADERS |
| – Percent of Open Interest Longs: | 50.4 | 44.4 | 5.0 |
| – Percent of Open Interest Shorts: | 29.0 | 65.2 | 5.6 |
| – Net Position: | 16,819 | -16,343 | -476 |
| – Gross Longs: | 39,668 | 34,986 | 3,942 |
| – Gross Shorts: | 22,849 | 51,329 | 4,418 |
| – Long to Short Ratio: | 1.7 to 1 | 0.7 to 1 | 0.9 to 1 |
| NET POSITION TREND: | | | |
| – Strength Index Score (3 Year Range Pct): | 57.2 | 44.6 | 40.2 |
| – Strength Index Reading (3 Year Range): | Bullish | Bearish | Bearish |
| NET POSITION MOVEMENT INDEX: | | | |
| – 6-Week Change in Strength Index: | -14.6 | 19.0 | -31.8 |
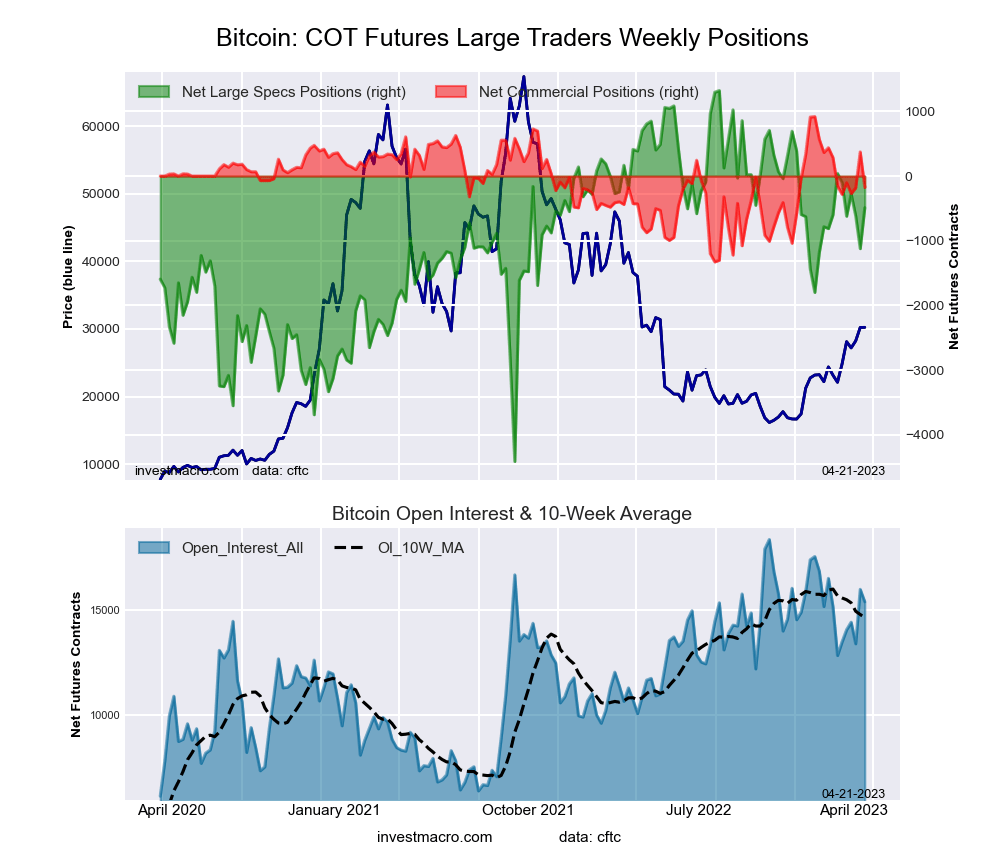
Bitcoin Futures:
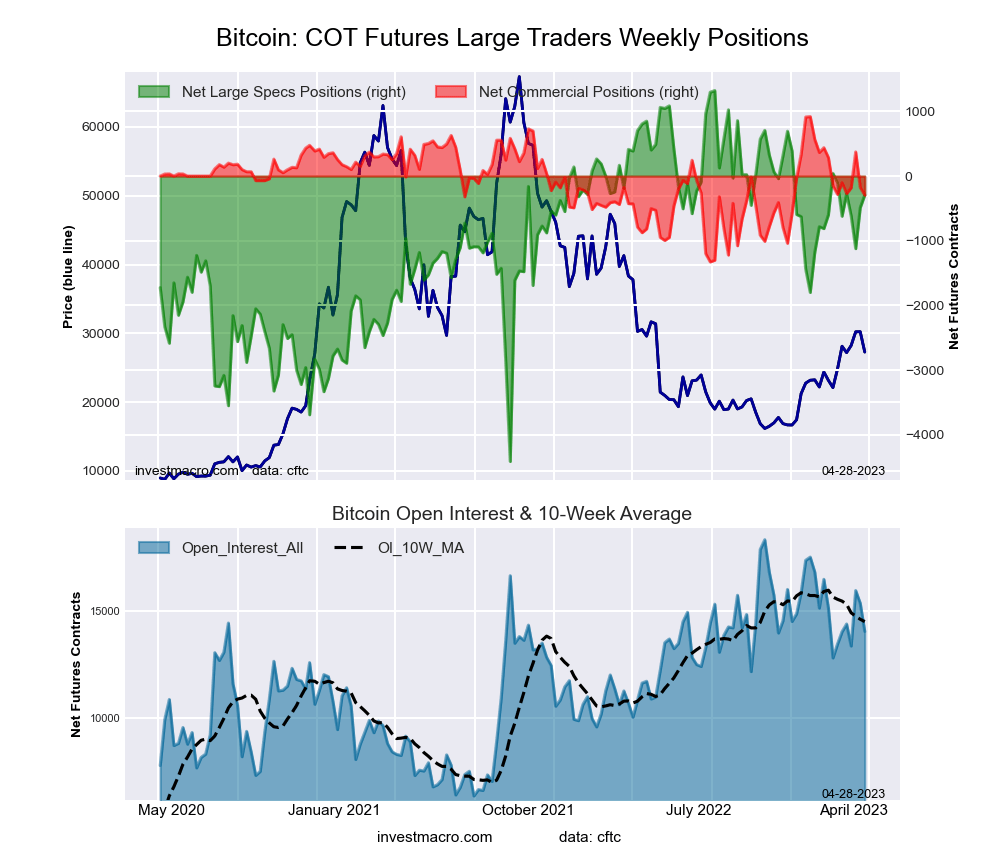 The Bitcoin large speculator standing this week came in at a net position of -293 contracts in the data reported through Tuesday. This was a weekly rise of 196 contracts from the previous week which had a total of -489 net contracts.
This week’s current strength score (the trader positioning range over the past three years, measured from 0 to 100) shows the speculators are currently Bullish with a score of 71.8 percent. The commercials are Bearish with a score of 45.9 percent and the small traders (not shown in chart) are Bearish with a score of 26.3 percent.
| BITCOIN Statistics | SPECULATORS | COMMERCIALS | SMALL TRADERS |
| – Percent of Open Interest Longs: | 68.0 | 2.9 | 9.7 |
| – Percent of Open Interest Shorts: | 70.1 | 5.0 | 5.5 |
| – Net Position: | -293 | -296 | 589 |
| – Gross Longs: | 9,566 | 410 | 1,364 |
| – Gross Shorts: | 9,859 | 706 | 775 |
| – Long to Short Ratio: | 1.0 to 1 | 0.6 to 1 | 1.8 to 1 |
| NET POSITION TREND: | | | |
| – Strength Index Score (3 Year Range Pct): | 71.8 | 45.9 | 26.3 |
| – Strength Index Reading (3 Year Range): | Bullish | Bearish | Bearish |
| NET POSITION MOVEMENT INDEX: | | | |
| – 6-Week Change in Strength Index: | -3.3 | -0.6 | 4.6 |
Article By InvestMacro – Receive our weekly COT Newsletter
*COT Report: The COT data, released weekly to the public each Friday, is updated through the most recent Tuesday (data is 3 days old) and shows a quick view of how large speculators or non-commercials (for-profit traders) were positioned in the futures markets.
The CFTC categorizes trader positions according to commercial hedgers (traders who use futures contracts for hedging as part of the business), non-commercials (large traders who speculate to realize trading profits) and nonreportable traders (usually small traders/speculators) as well as their open interest (contracts open in the market at time of reporting). See CFTC criteria here.


