By InvestMacro
Here are the latest charts and statistics for the Commitment of Traders (COT) data published by the Commodities Futures Trading Commission (CFTC).
The latest COT data is updated through Tuesday June 23rd and shows a quick view of how large market participants (for-profit speculators and commercial traders) were positioned in the futures markets. All currency positions are in direct relation to the US dollar where, for example, a bet for the euro is a bet that the euro will rise versus the dollar while a bet against the euro will be a bet that the euro will decline versus the dollar.
Weekly Speculator Changes led by Japanese Yen & Brazilian Real
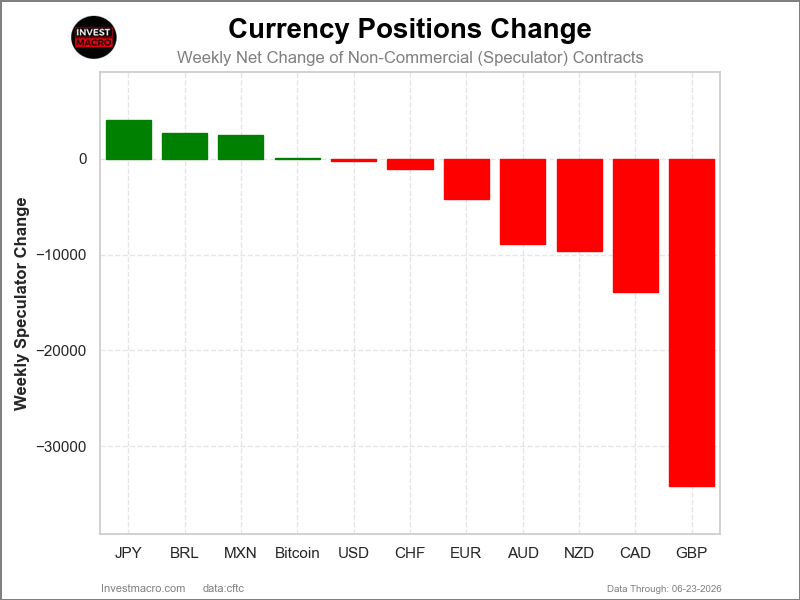
The COT currency market speculator bets were lower this week as four out of the eleven currency markets we cover had higher positioning while the other seven markets had lower speculator contracts.
Leading the gains for the currency markets was the Japanese Yen (4,028 contracts) with the Brazilian Real (2,685 contracts), the Mexican Peso (2,436 contracts) and Bitcoin (49 contracts) also showing positive weeks.
The currencies seeing declines in speculator bets on the week were the British Pound (-34,134 contracts), the Canadian Dollar (-13,891 contracts), the New Zealand Dollar (-9,683 contracts), Australian Dollar (-8,887 contracts), the EuroFX (-4,195 contracts), the Swiss Franc (-1,036 contracts) and with the US Dollar Index (-269 contracts) also registering lower bets on the week.
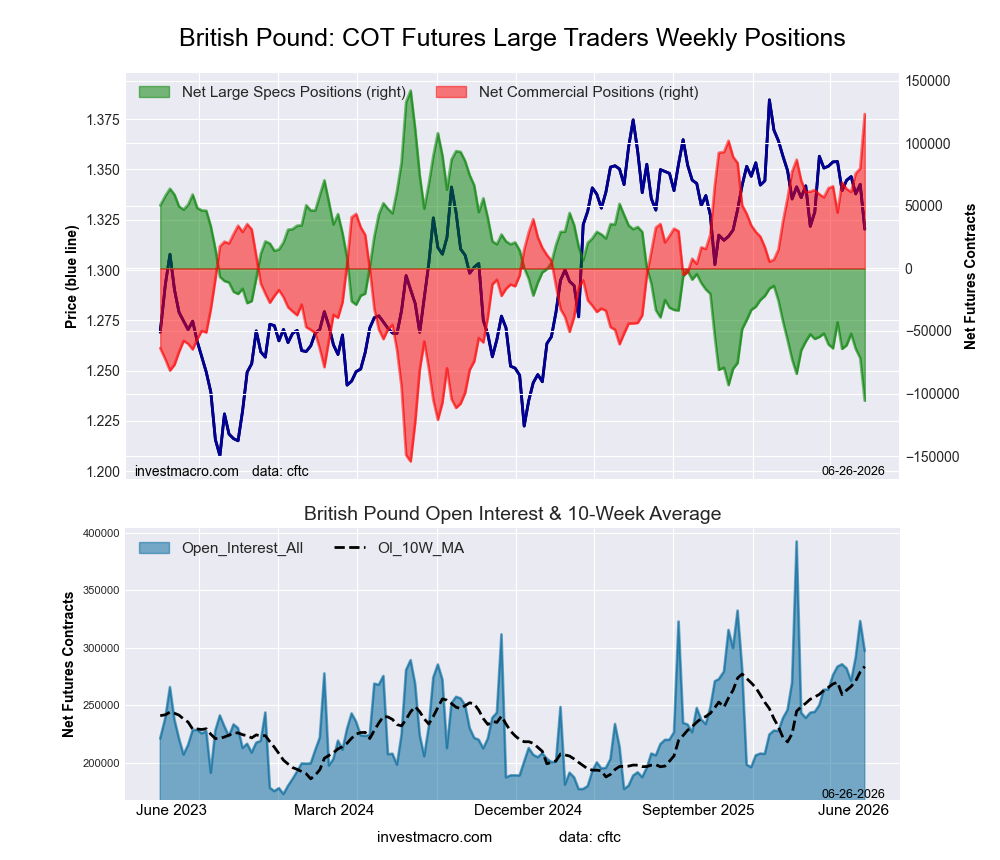
Currency Speculators continue to sharply raise British Pound Sterling bearish bets
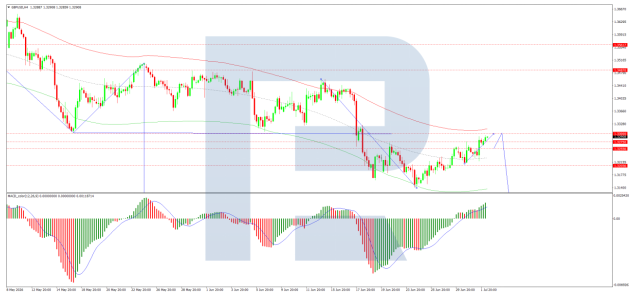
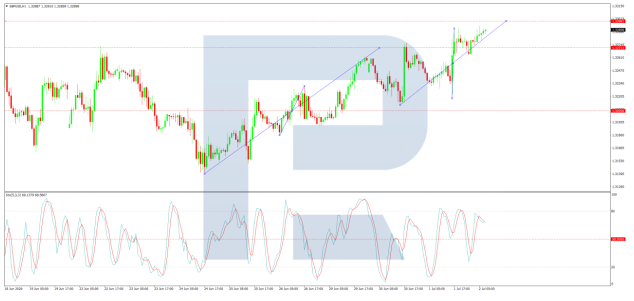
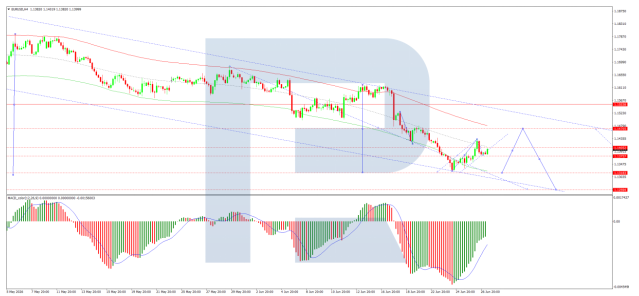
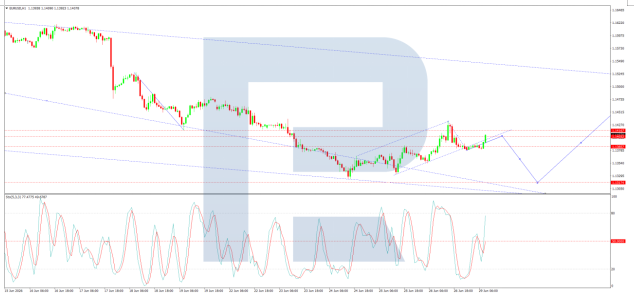
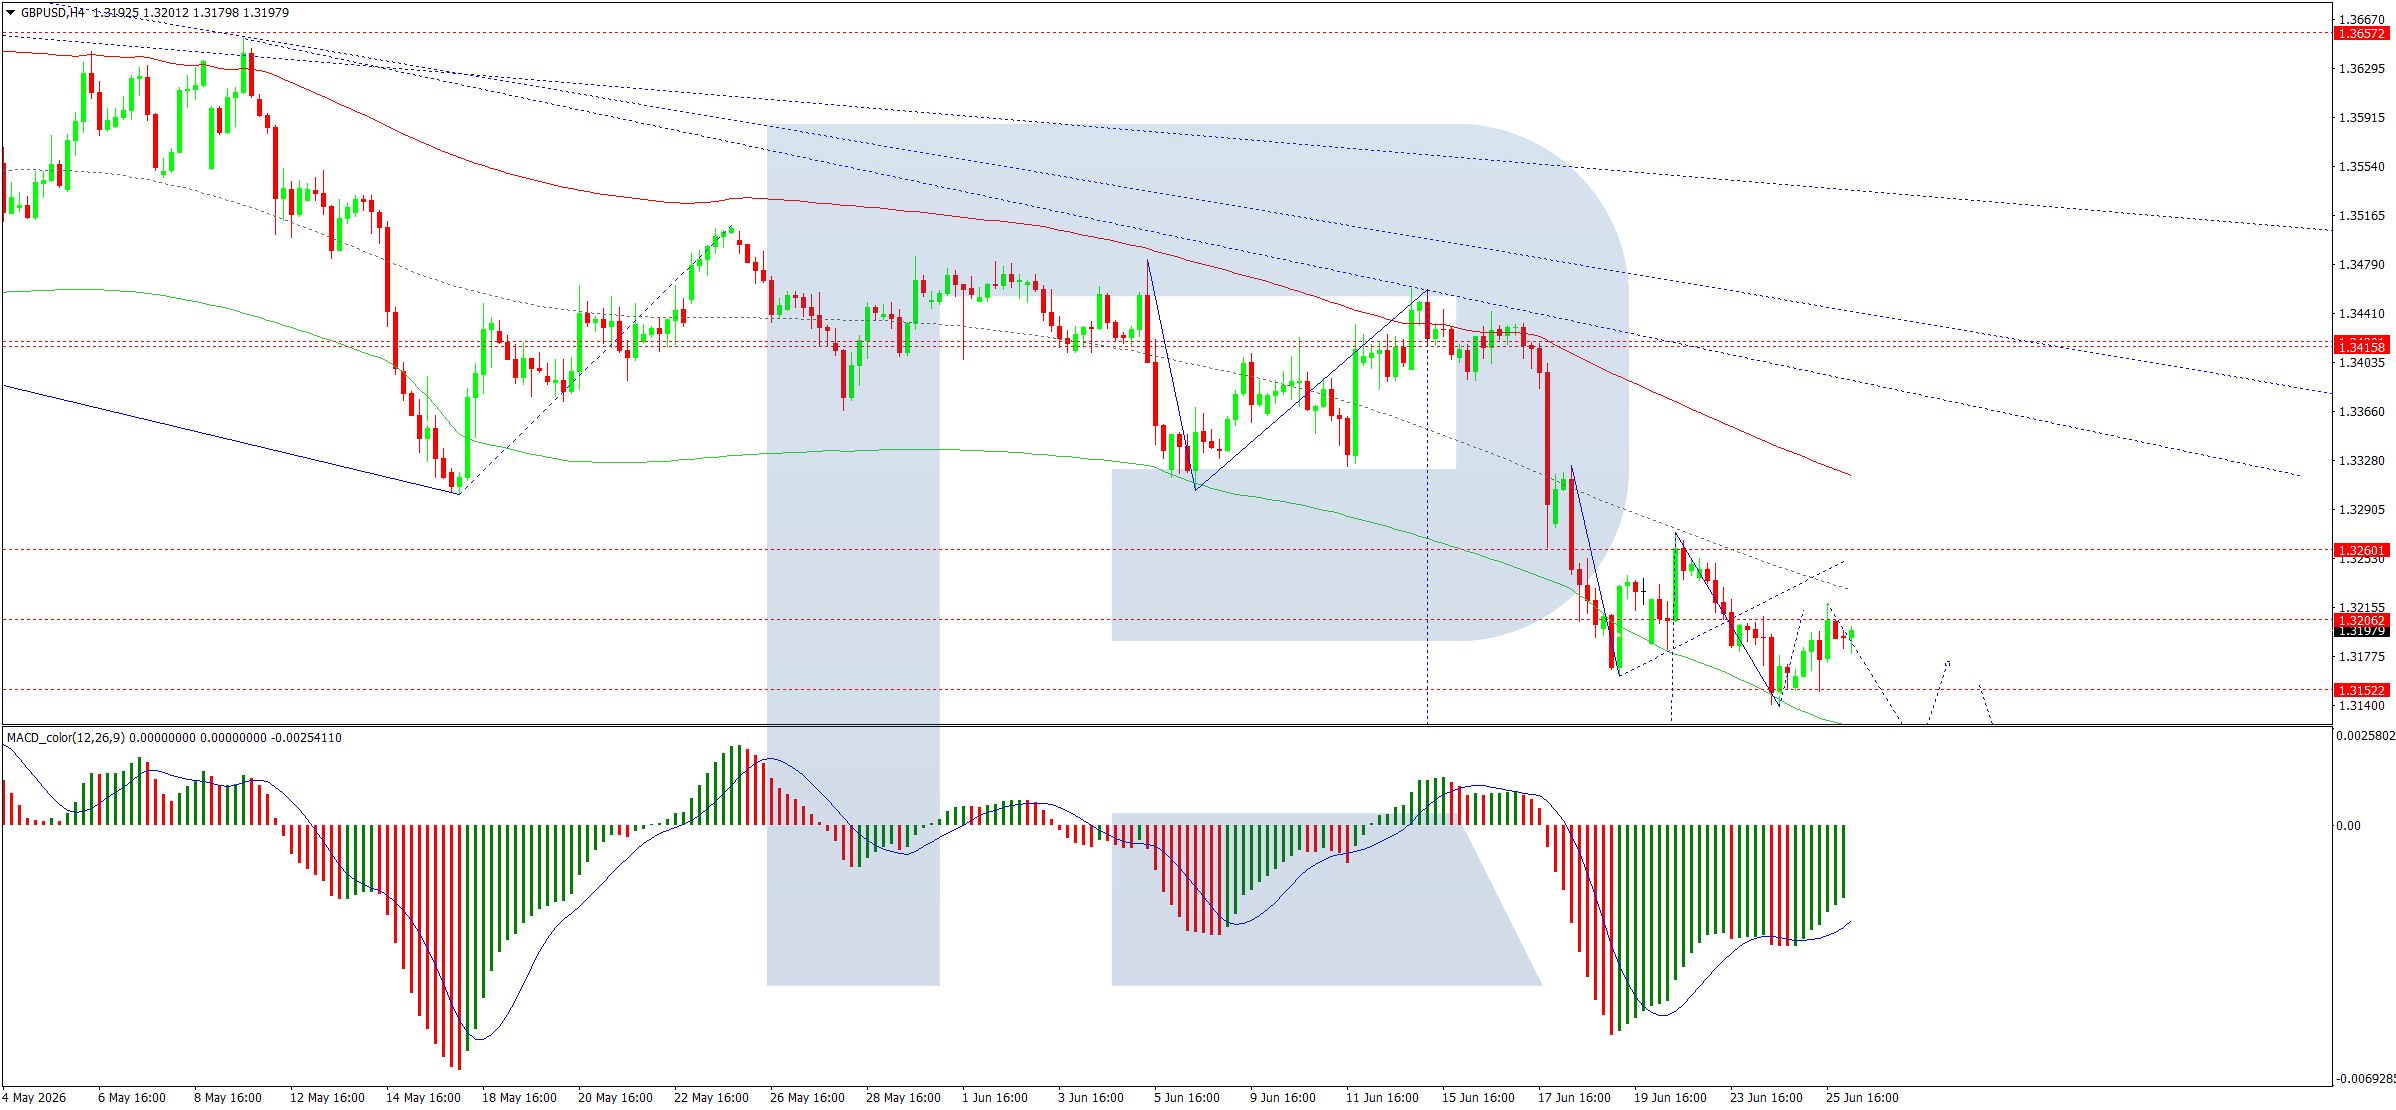
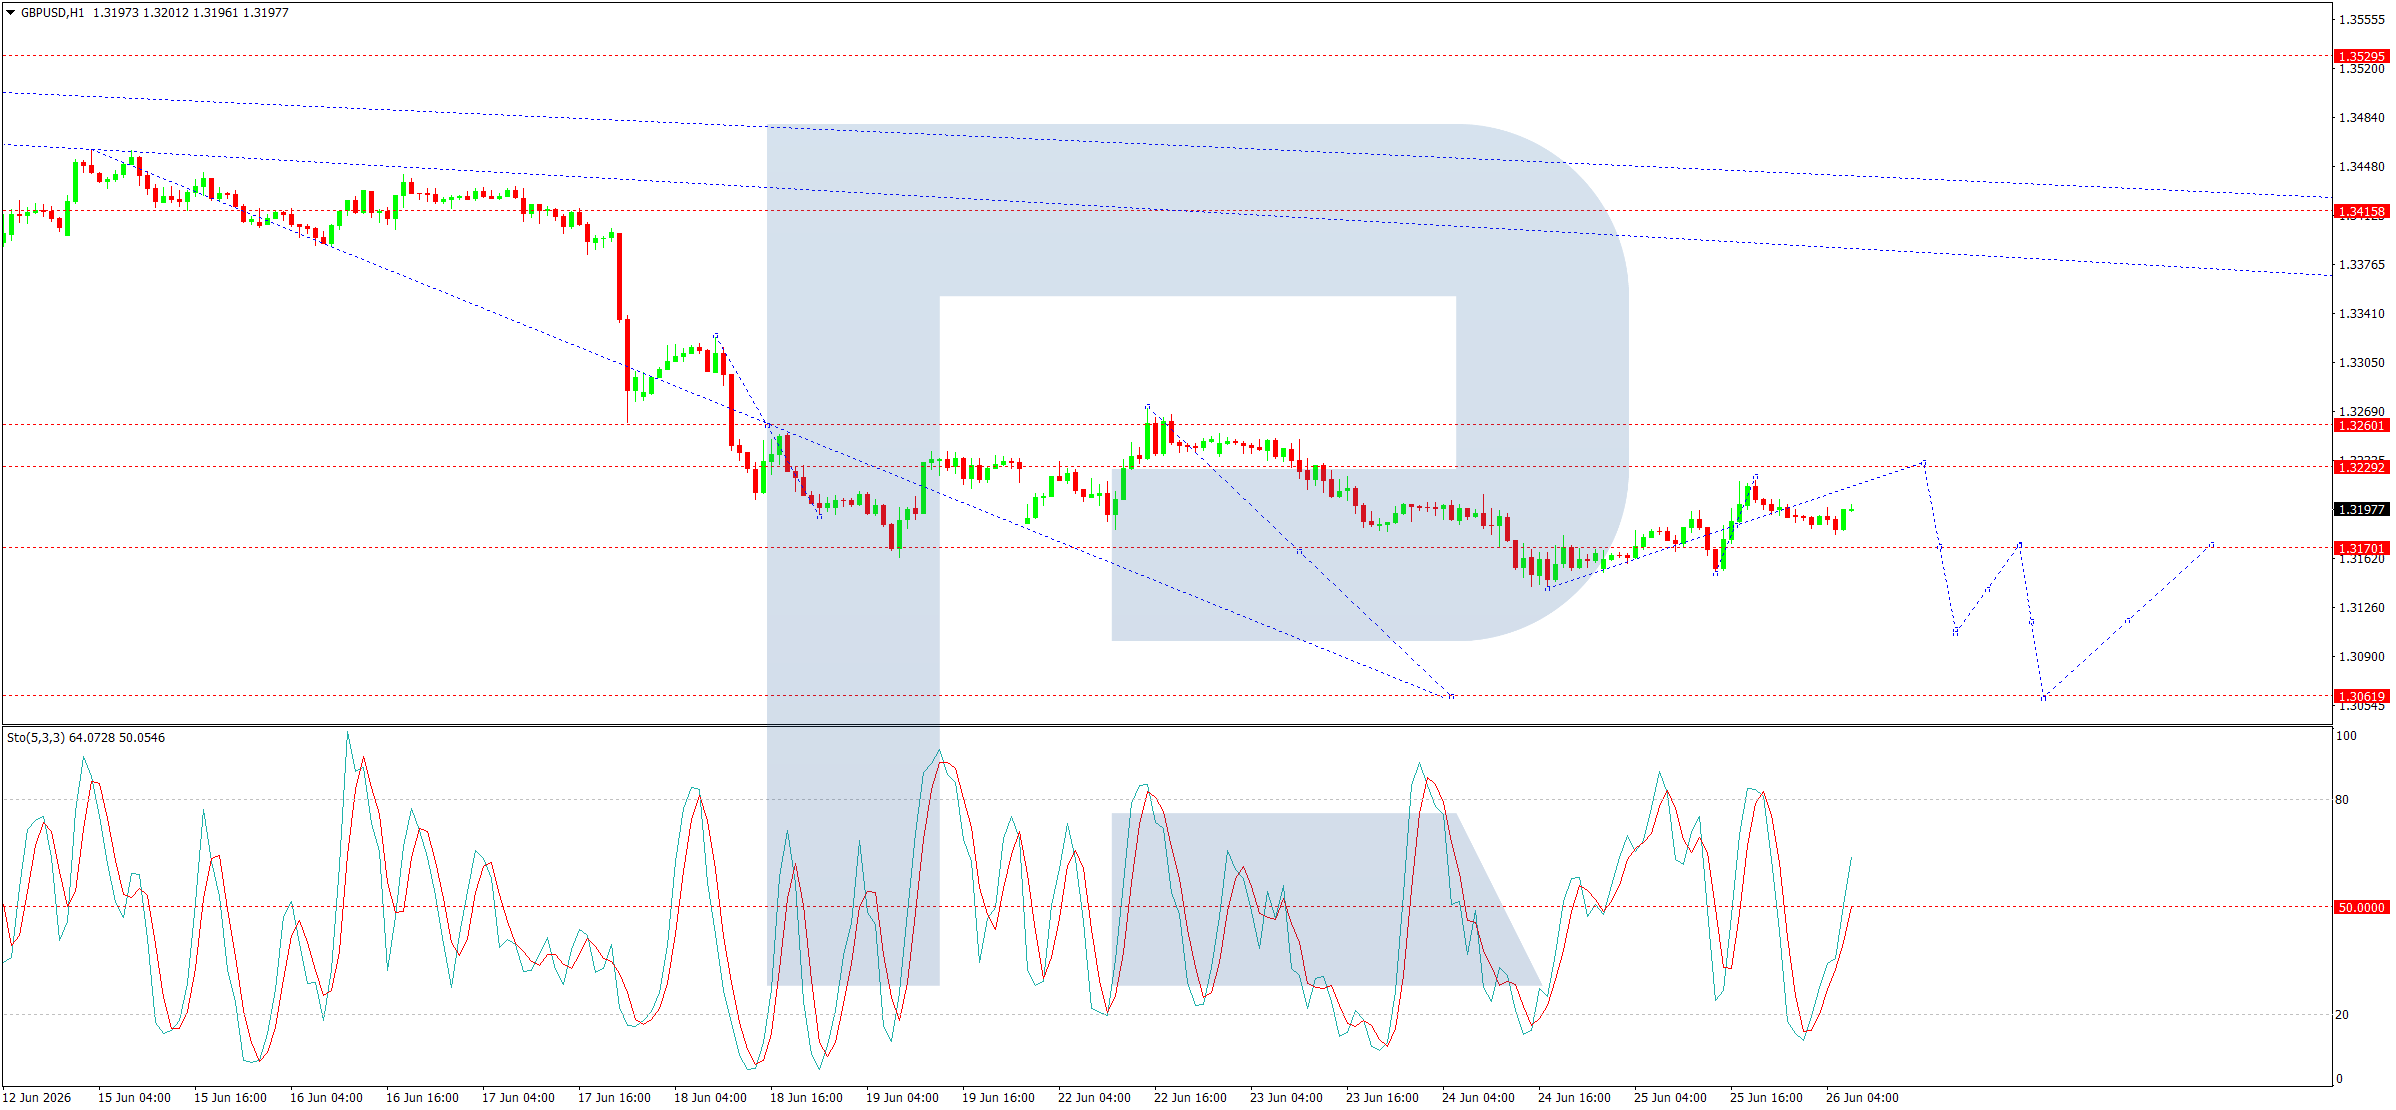
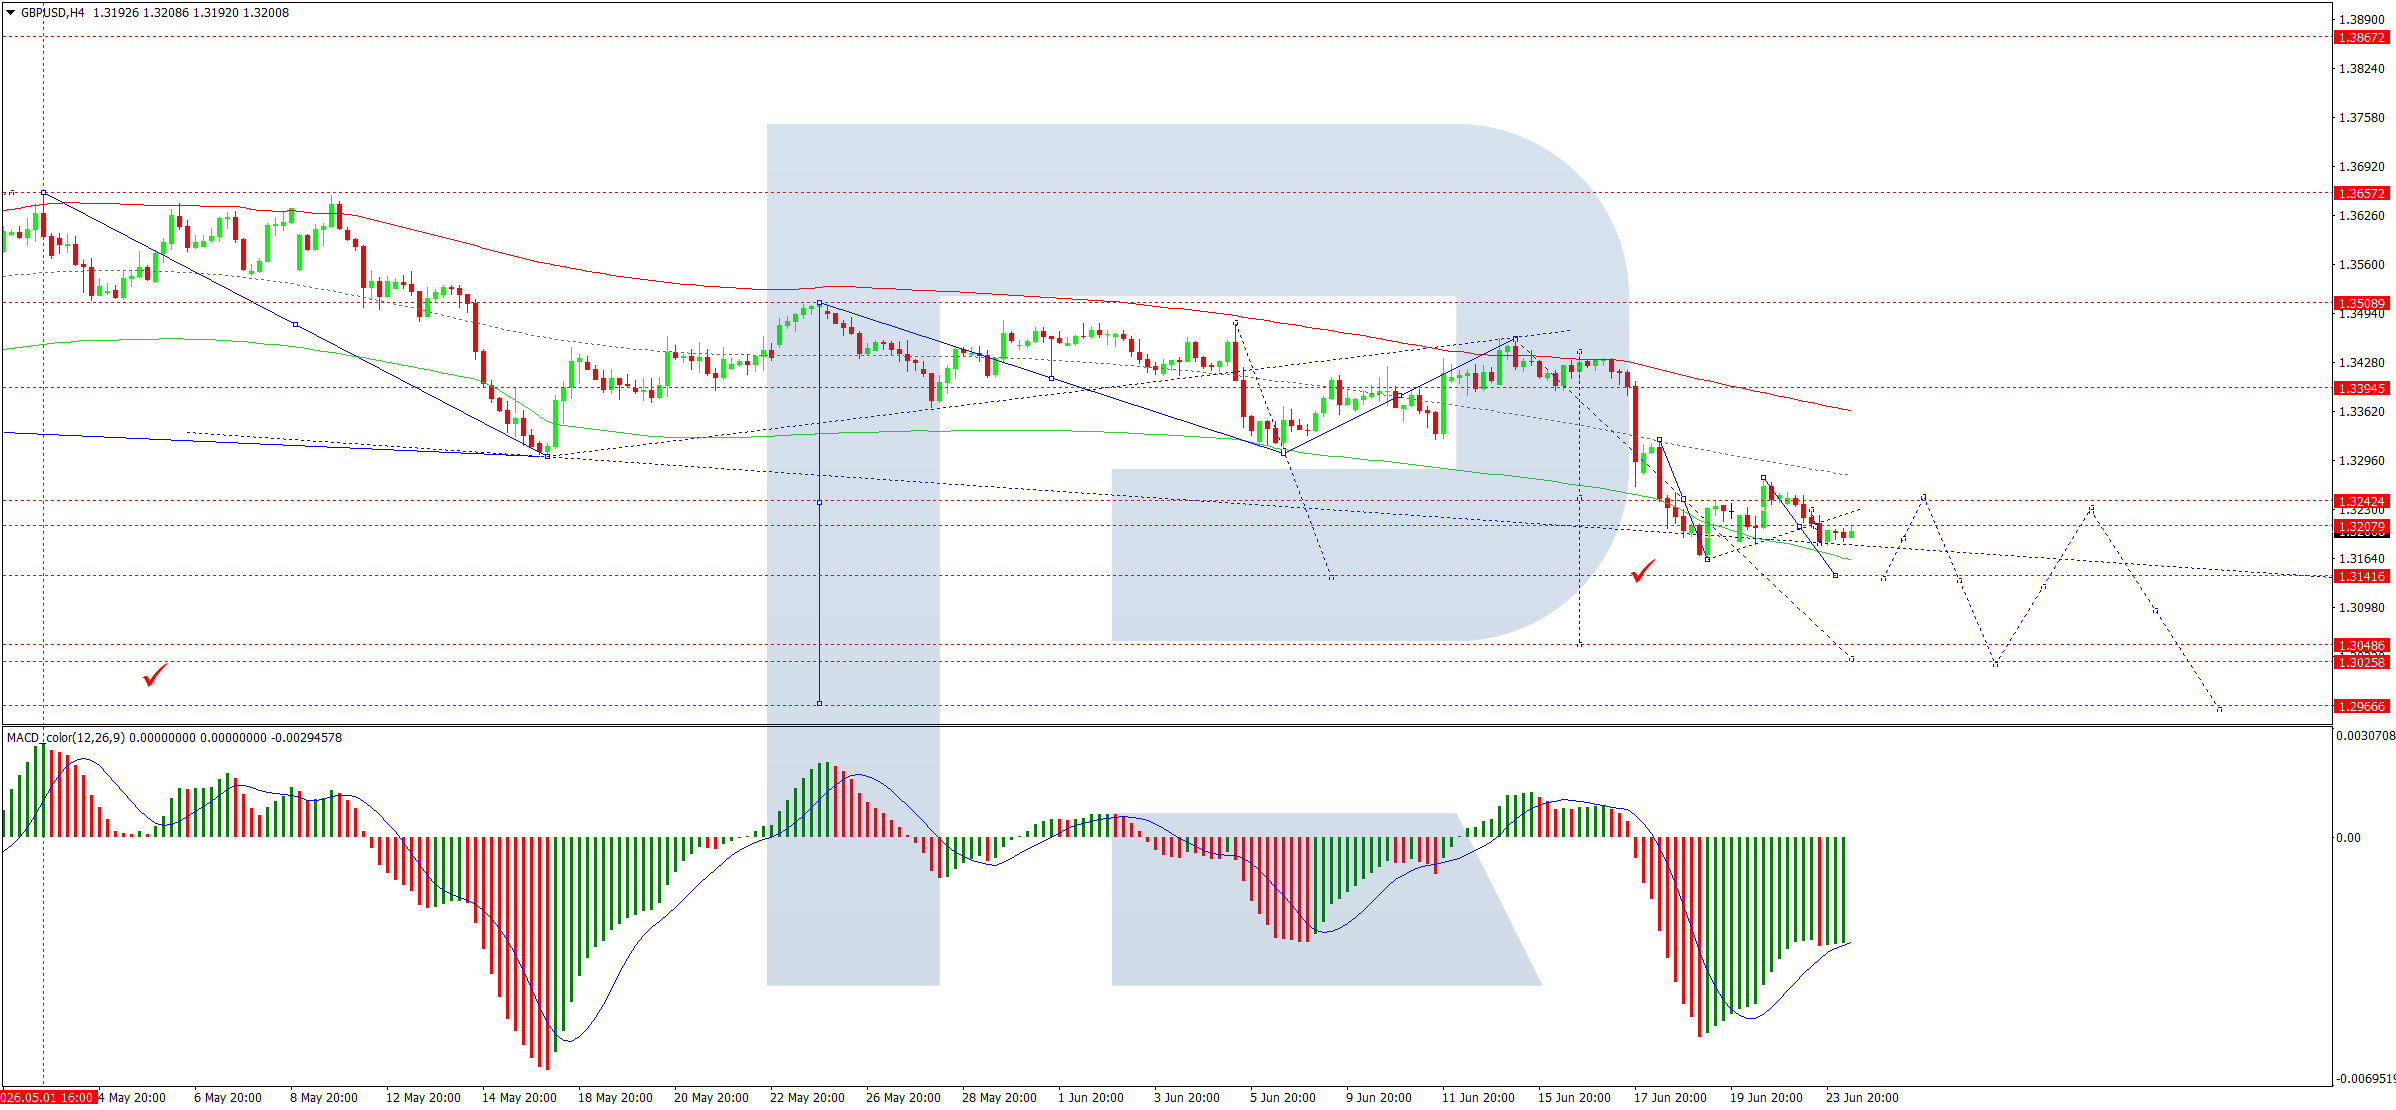
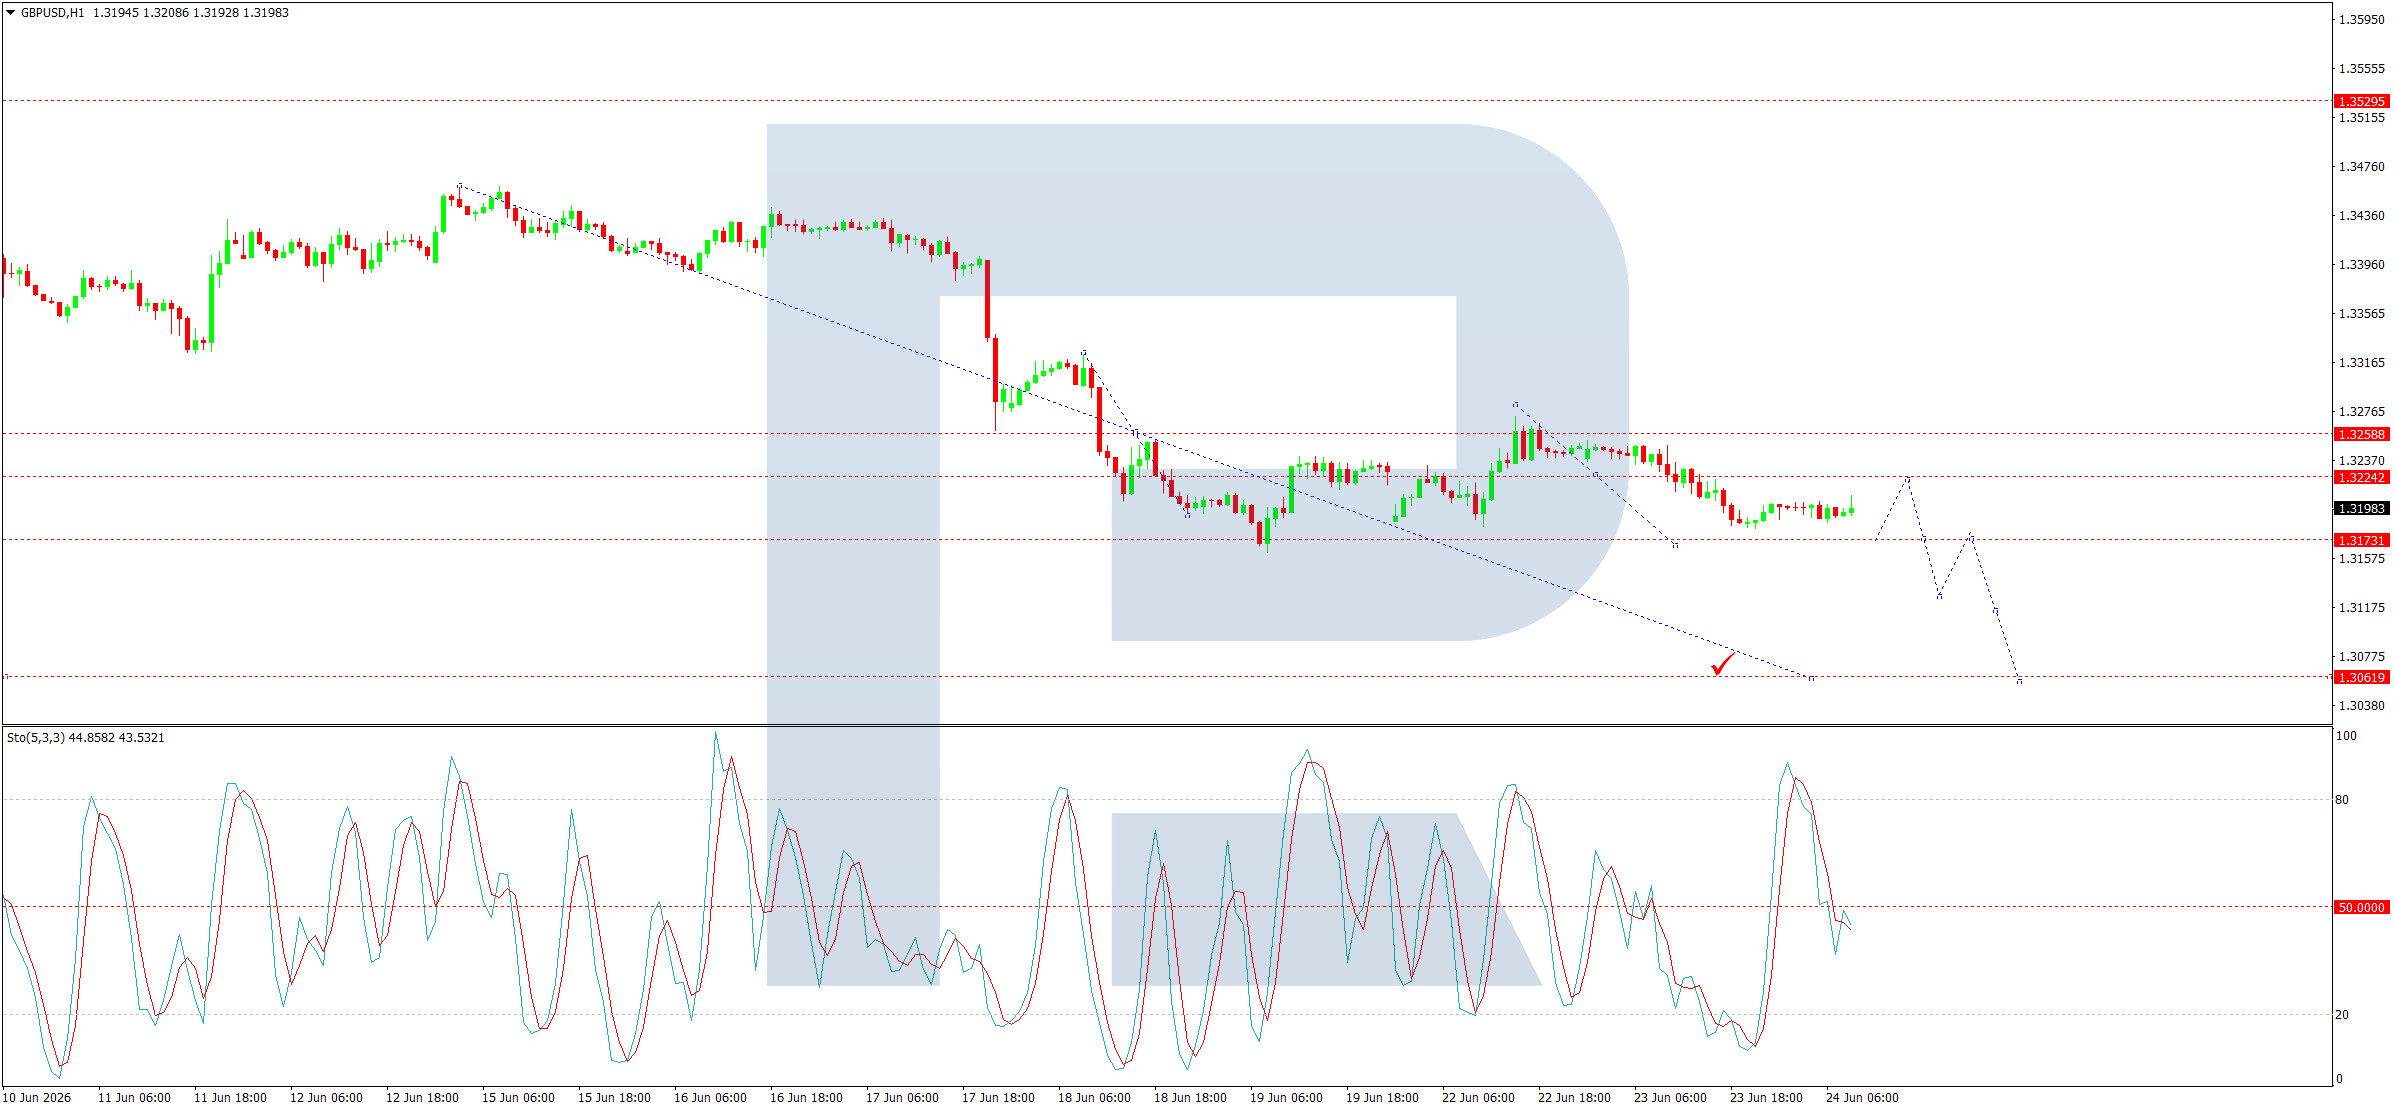
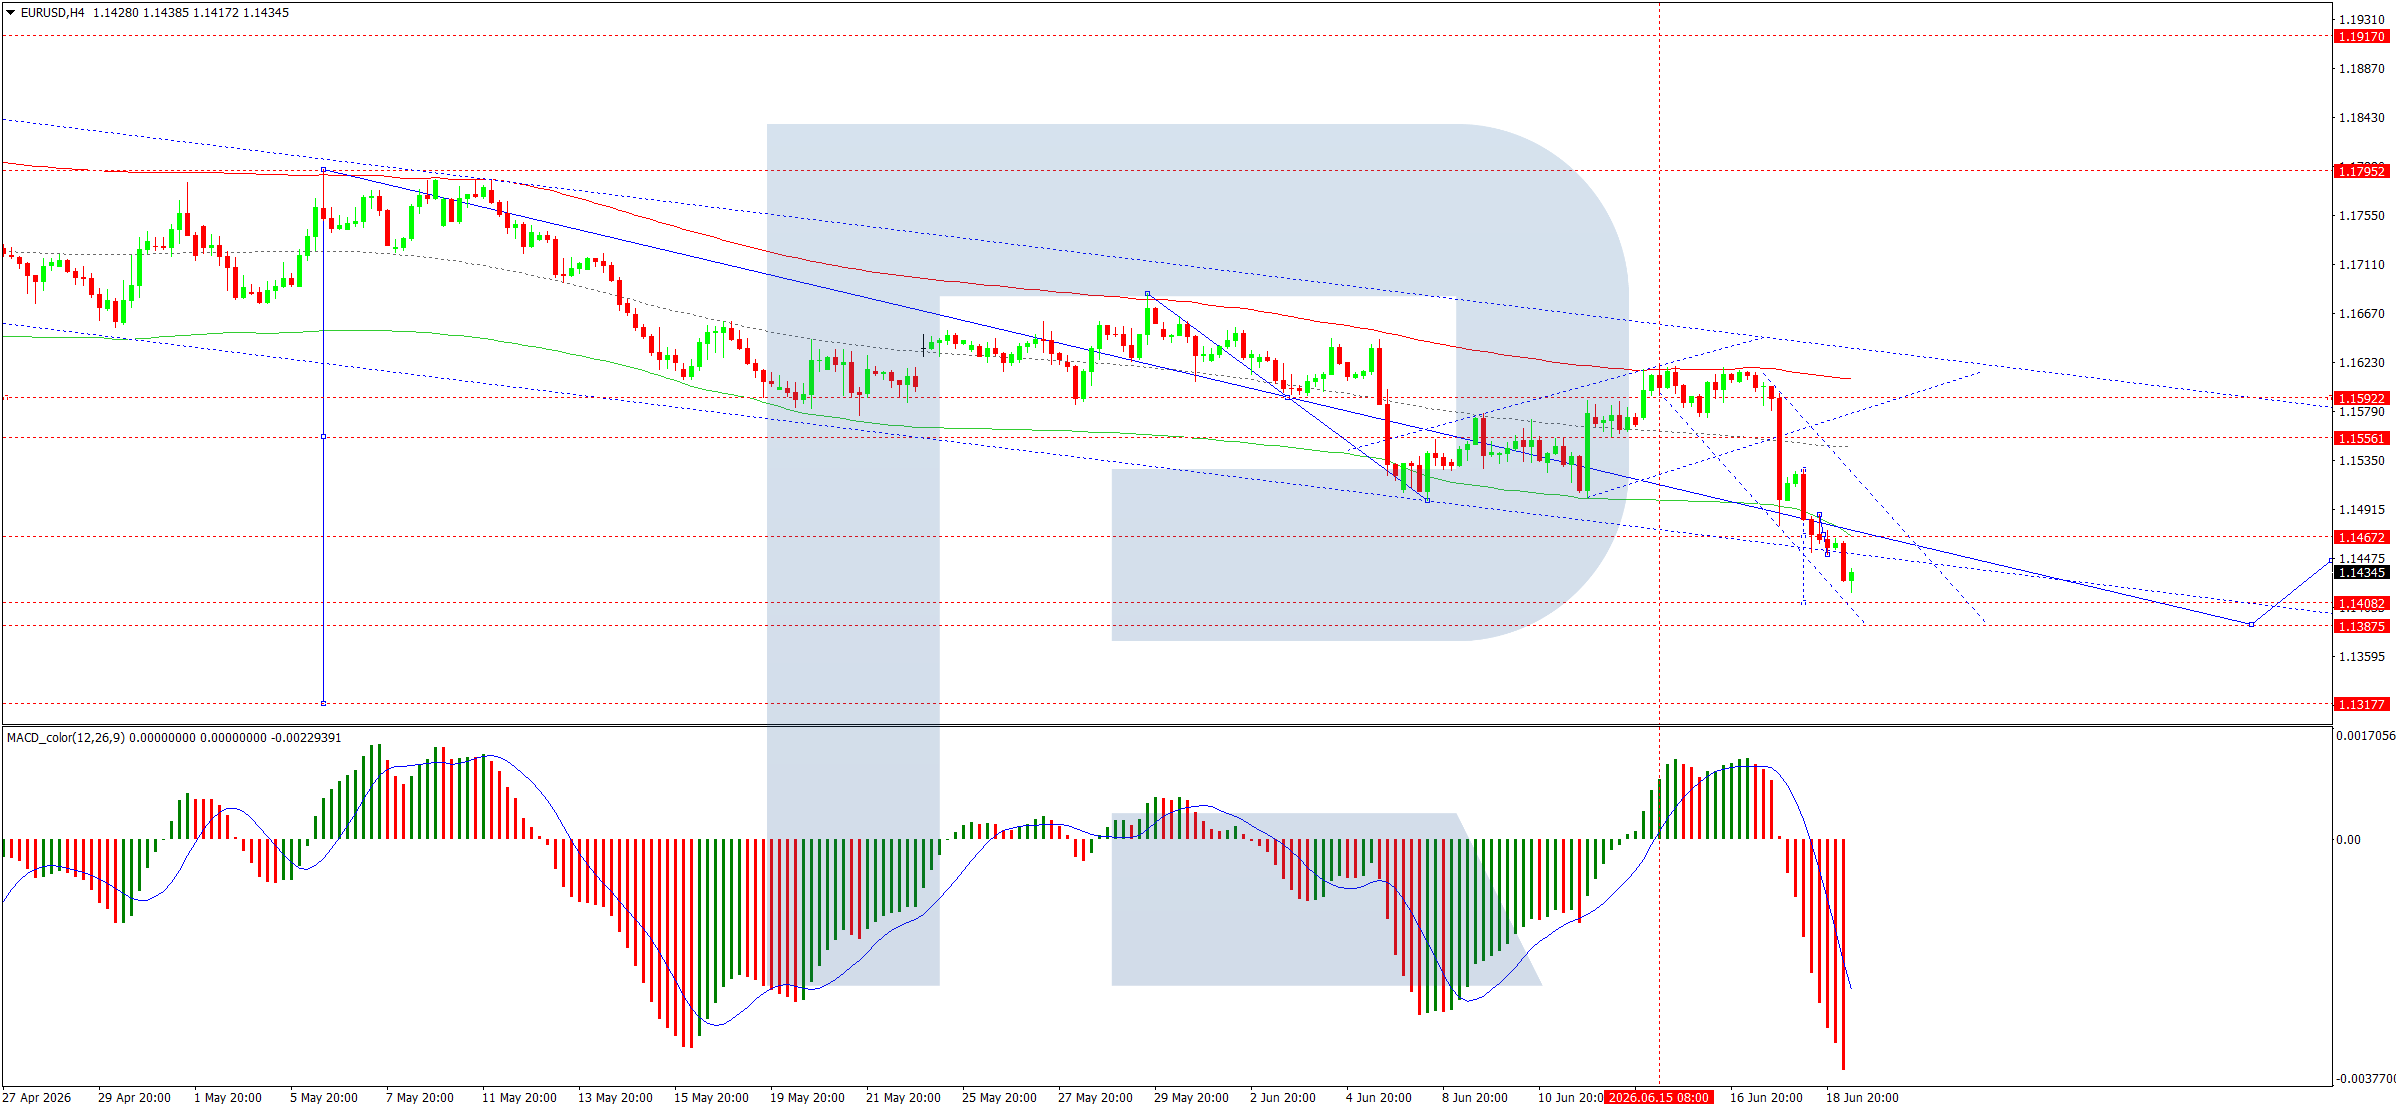
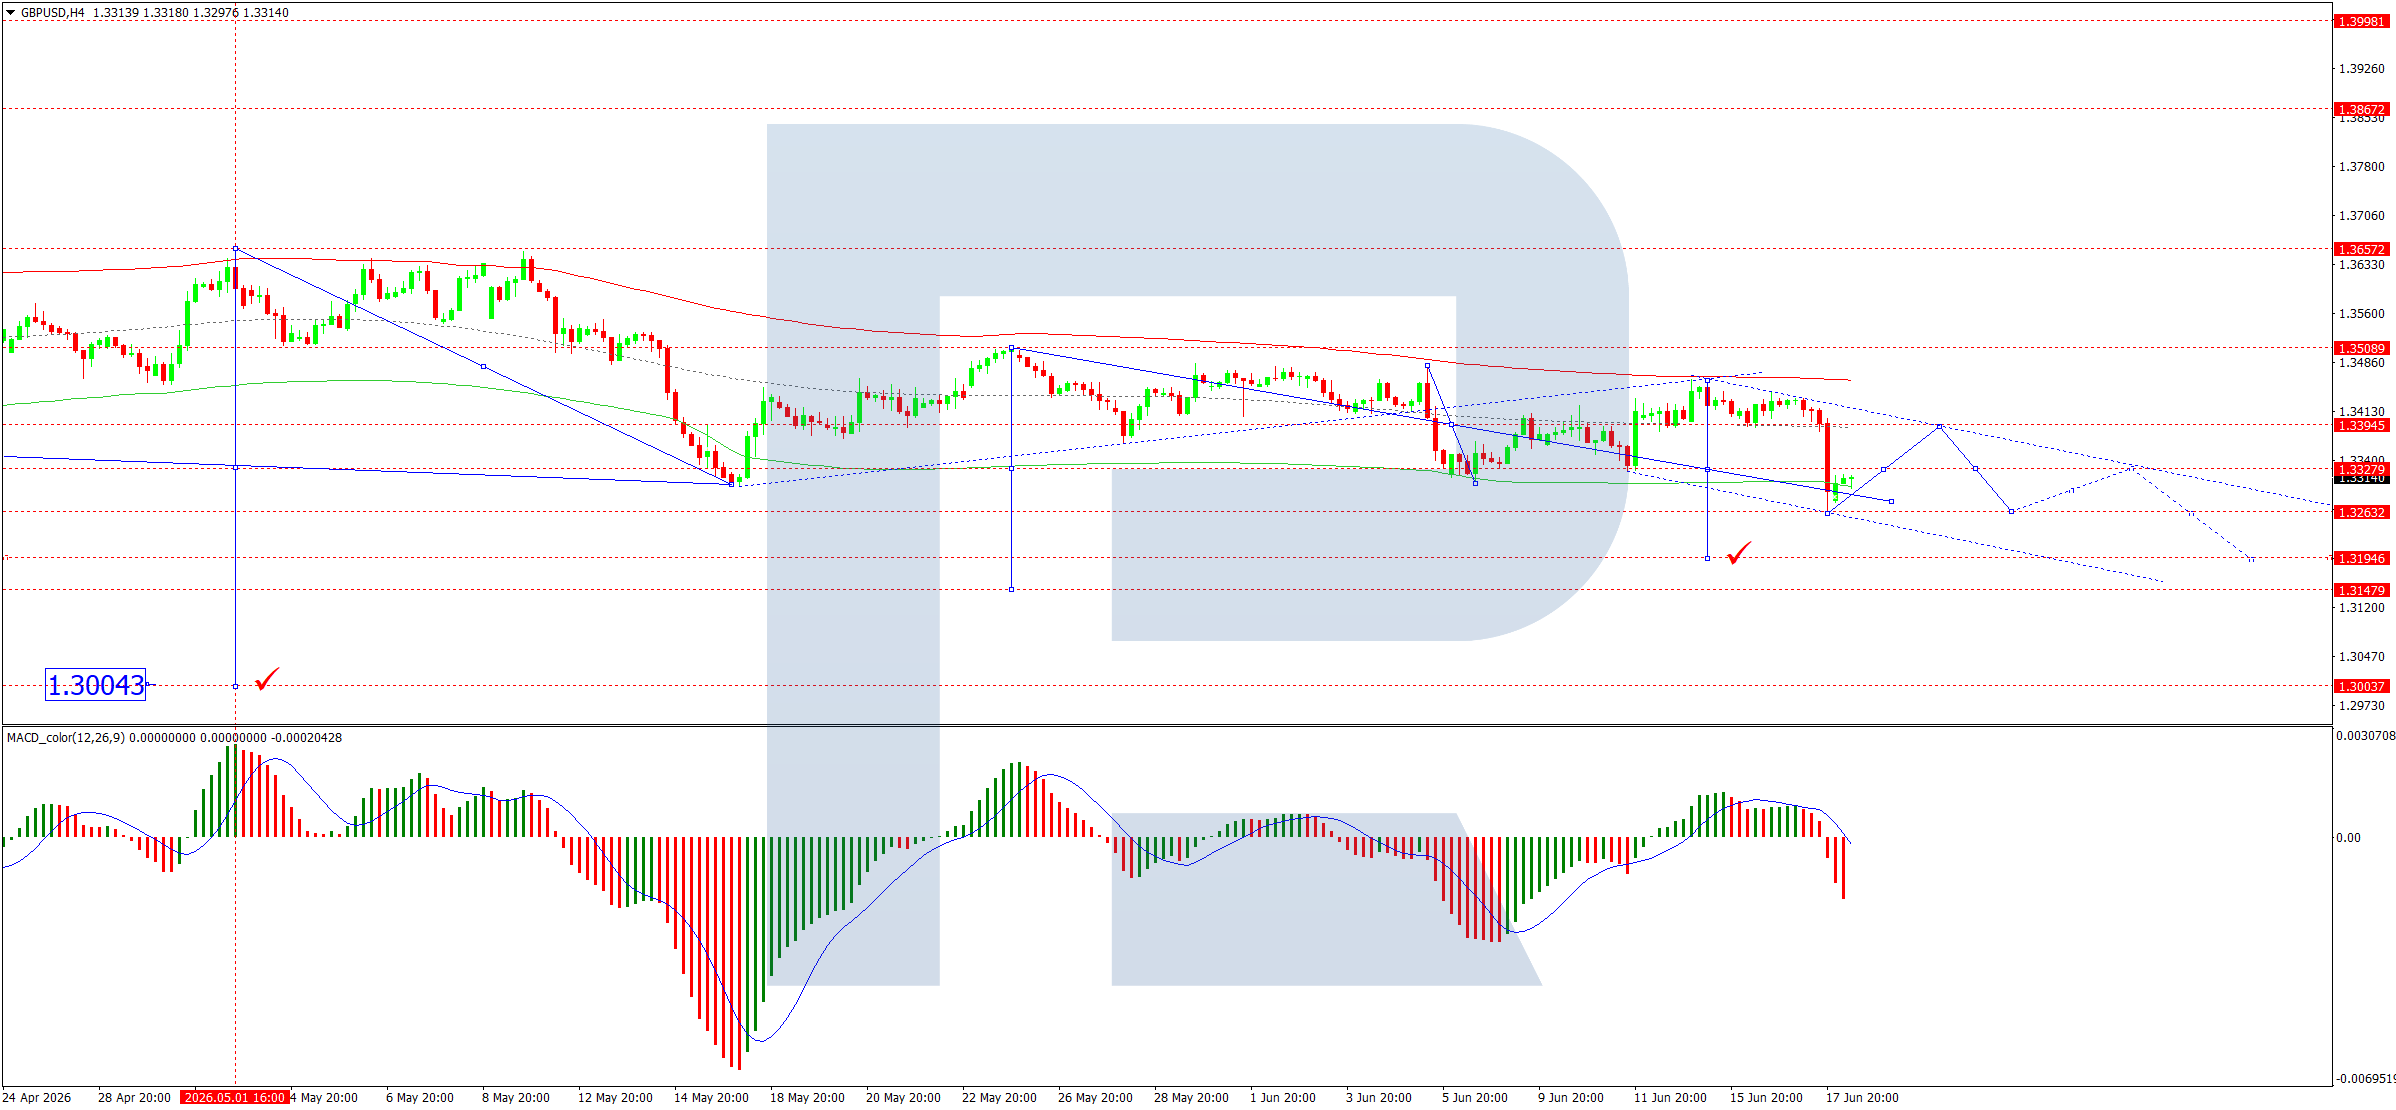
Highlighting this week’s currencies speculative data is the British Pound Sterling‘s sharp weakness that has pushed the current speculative position to the fourth most bearish level on record. Speculators dropped their British Pound Sterling bets this week by -34,134 contracts, marking the third consecutive week of speculator decreases — and the speculative position has now fallen by over -53,500 contracts in just these past three weeks. This weakness has brought the overall speculator standing to a total of -105,719 standing net contracts. This marks the fourth most bearish level on record and is only less bearish than the levels that were reached for the speculators’ standing in March and April of 2017. The British Pound Sterling speculator bets have now been in bearish territory for 48 consecutive weeks, dating back to July 29th of 2025. In the Forex trading market, the British Pound Sterling dipped for a second consecutive week and is now trading at the bottom of its sideways trading channel near the 1.3200 threshold. The Pound Sterling has been in this sideways trading channel for approximately a year, with the high levels being capped around 1.3800, while the bottom has seen support at 1.3150.
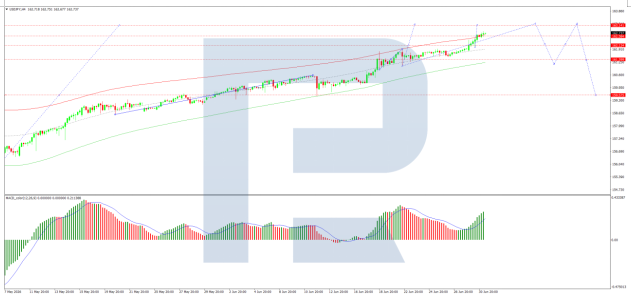
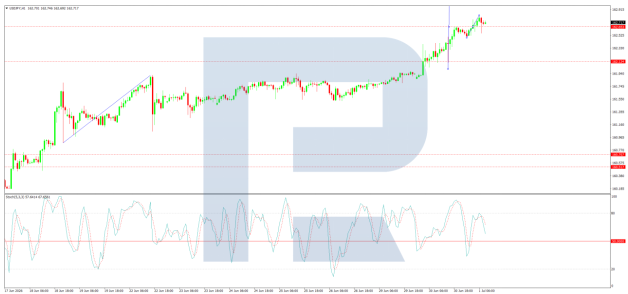
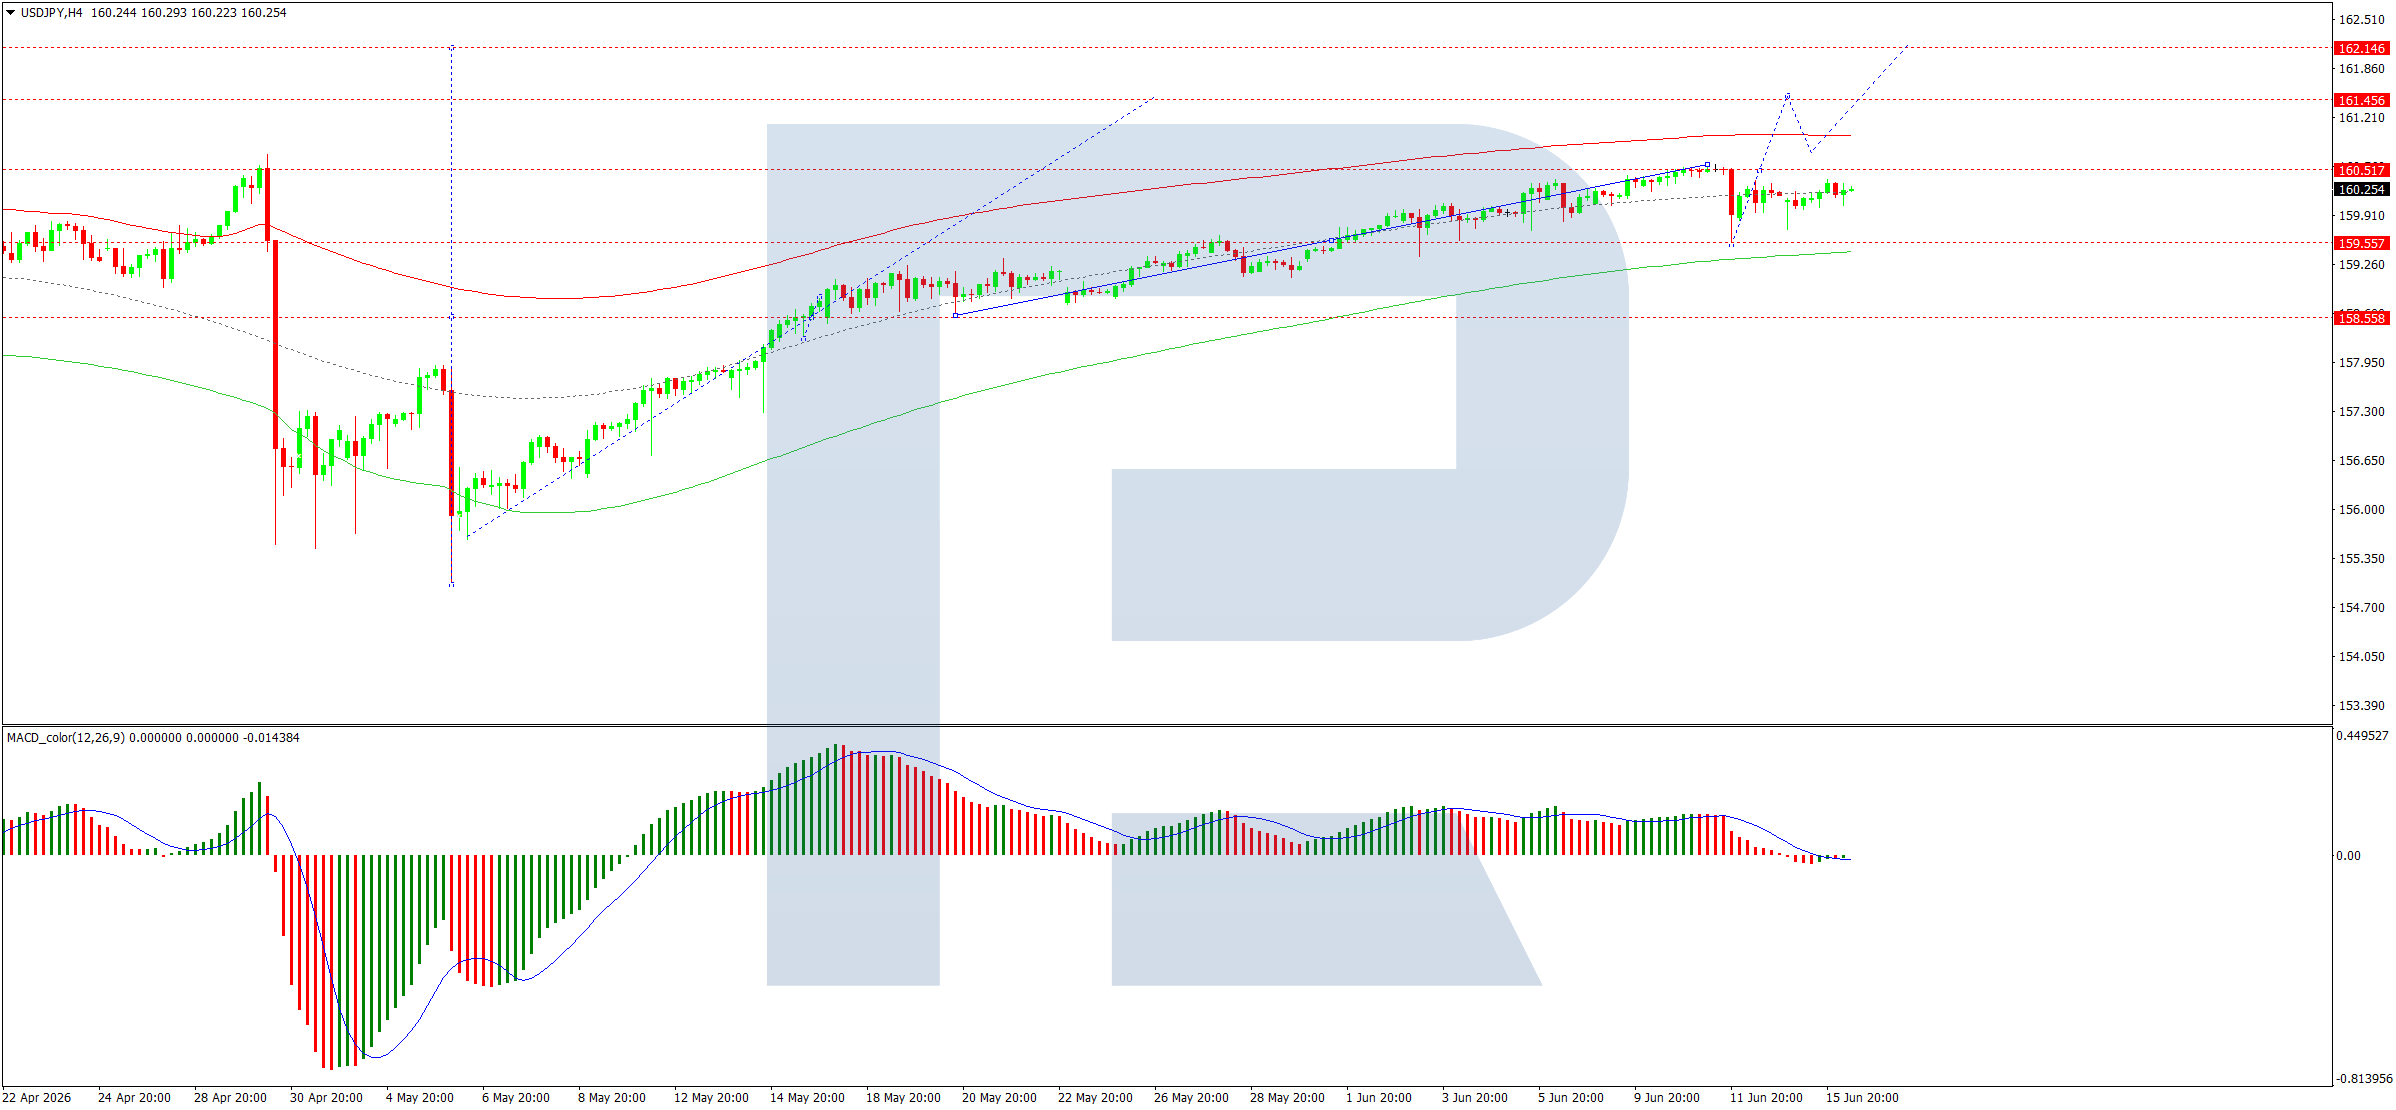
The Canadian Dollar speculator position continues to deteriorate and has now fallen for seven consecutive weeks. This seven-week period has added a total of -132,133 net contracts to the bearish level. This has brought the overall net position to a total of -146,792 contracts in the third consecutive week that has seen the net position with contracts higher than -100,000. The Canadian net speculative position has been in bearish territory for 14 consecutive weeks, following a reprieve from negative bets that spanned from February 3rd to March 17th. That saw positive positions for the Canadian Dollar. This coincided with higher Oil prices, which is a major factor in Canadian exports. Currently, in the Currency markets, the Canadian Dollar has been falling rapidly and has fallen in five out of the previous seven weeks. The Canadian Dollar has broken through its previously ascending triangle pattern that had seen an upward trend line coinciding with the 200-week moving average. This week, the Canadian Dollar fell to its most bearish level since April of 2025 and tested support at 0.7050.
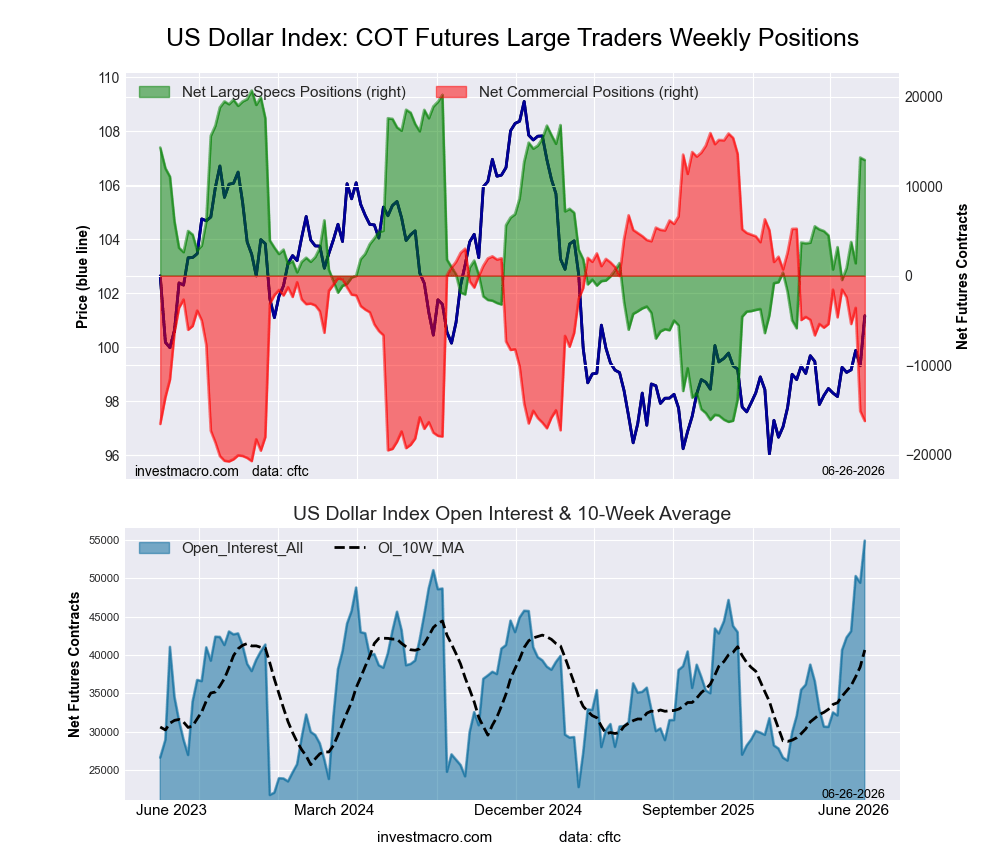
Next up, a currency on the rise has been the US Dollar Index (DX). The Dollar Index saw a dip this week but has risen to multi-month highs in its weekly net speculator standing over the past few weeks. This week, the US Dollar Index saw a dip by a small -269 net contract bets following last week’s strong jump by +11,813 contracts. The standing US Dollar Index net position has now been over +12,000 contracts for a second consecutive week and is at the highest levels since March of 2025. Overall, the US Dollar Index net position standing has now been in bullish or positive territory for 14 out of the past 15 weeks, including the past five weeks in a row. The Dollar Index in the currency trading markets has just recently broken out of its sideways trading band that had sustained for approximately a year. The 100.00 level had provided strong resistance to the currency, but in the last two weeks, the Dollar Index has broken out above and closed this week at 101.12. This marks the highest close since April of 2025. The next level of resistance above for further bullish action is around the 102.50 level, while we could see support for the Dollar Index at the 100.00–100.50 area.
US Dollar Index leads Currency price performances
The Currencies’ price performance this week was led by the US Dollar Index, which rose by 0.43% over the past five days. The Canadian Dollar was virtually unchanged on the week, followed by the Japanese Yen, which edged down slightly by -0.11%.
Next up, the Swiss Franc also slid by a minuscule amount with a -0.13% decline, followed by the British Pound Sterling, which dipped by -0.16%, and the Brazilian Real, which also was lower by -0.16%. The Euro declined by -0.60% on the week, while the Mexican Peso was down by -0.94%.
The Currencies that fell by over 1% this week were the Australian Dollar, with a dip of -1.51%, followed by the New Zealand Dollar, which fell by -1.55% over the past five days.
The biggest decliner on the week was Bitcoin, which dropped by -5.71%.
Currencies Data:
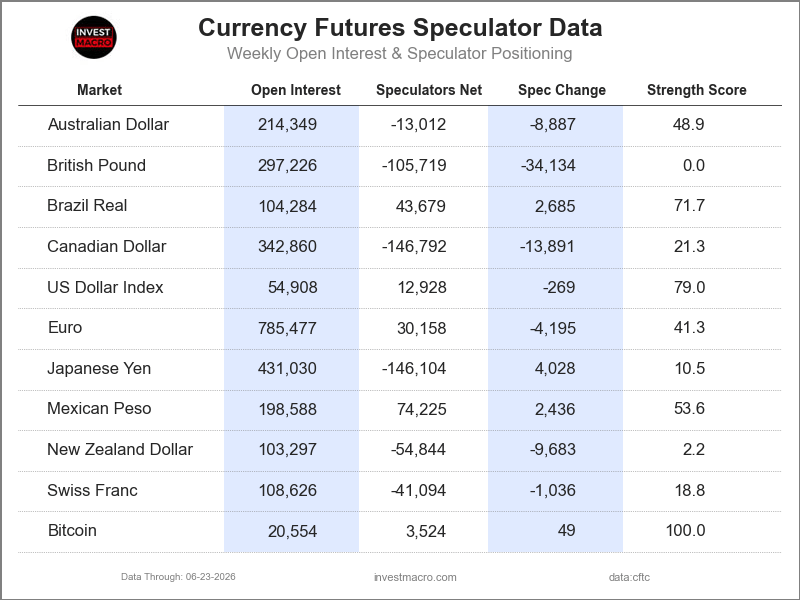
Legend: Open Interest | Speculators Current Net Position | Weekly Specs Change | Specs Strength Score compared to last 3-Years (0-100 range)
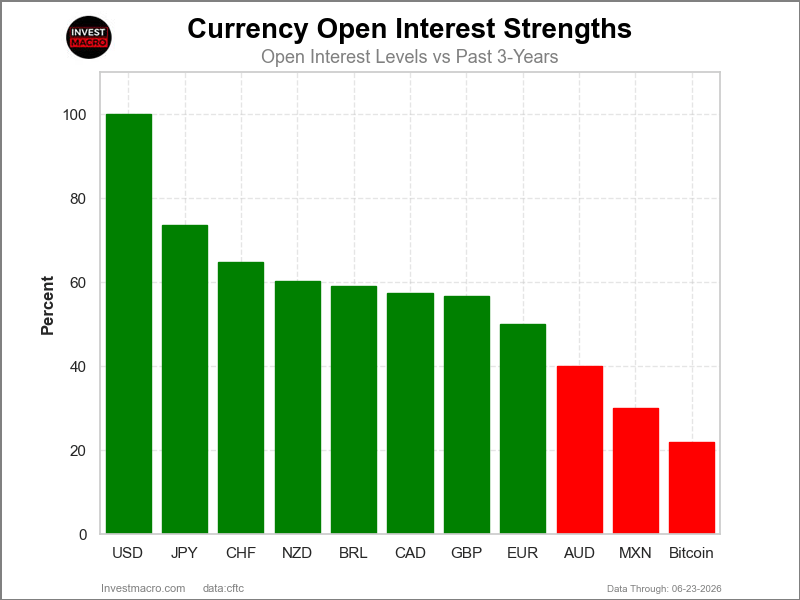
Strength Scores led by Bitcoin & US Dollar Index
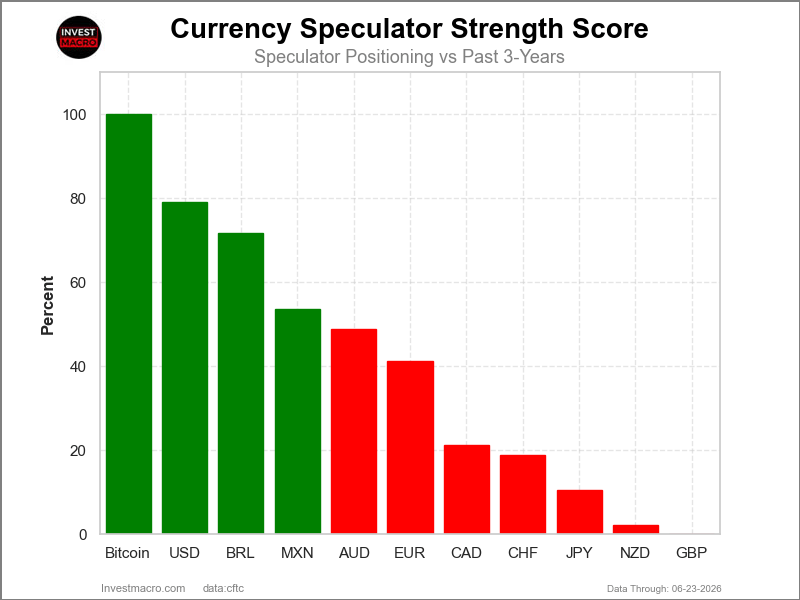
COT Strength Scores (a normalized measure of Speculator positions over a 3-Year range, from 0 to 100 where above 80 is Extreme-Bullish and below 20 is Extreme-Bearish) showed that Bitcoin (100 percent) and the US Dollar Index (79 percent) lead the currency markets this week. The Brazilian Real (72 percent) and the Mexican Peso (54 percent) come in as the next highest in the weekly strength scores.
On the downside, the British Pound (0 percent), the New Zealand Dollar (2 percent), the Japanese Yen (10 percent) and the Swiss Franc (19 percent) come in at the lowest strength levels currently and are in Extreme-Bearish territory (below 20 percent).
3-Year Strength Statistics:
US Dollar Index (79.0 percent) vs US Dollar Index previous week (79.8 percent)
EuroFX (41.3 percent) vs EuroFX previous week (43.0 percent)
British Pound Sterling (0.0 percent) vs British Pound Sterling previous week (13.8 percent)
Japanese Yen (10.5 percent) vs Japanese Yen previous week (9.4 percent)
Swiss Franc (18.8 percent) vs Swiss Franc previous week (21.0 percent)
Canadian Dollar (21.3 percent) vs Canadian Dollar previous week (27.3 percent)
Australian Dollar (48.9 percent) vs Australian Dollar previous week (53.5 percent)
New Zealand Dollar (2.2 percent) vs New Zealand Dollar previous week (13.3 percent)
Mexican Peso (53.6 percent) vs Mexican Peso previous week (51.9 percent)
Brazilian Real (71.7 percent) vs Brazilian Real previous week (69.8 percent)
Bitcoin (100.0 percent) vs Bitcoin previous week (99.2 percent)
Bitcoin & US Dollar Index top the 6-Week Strength Trends
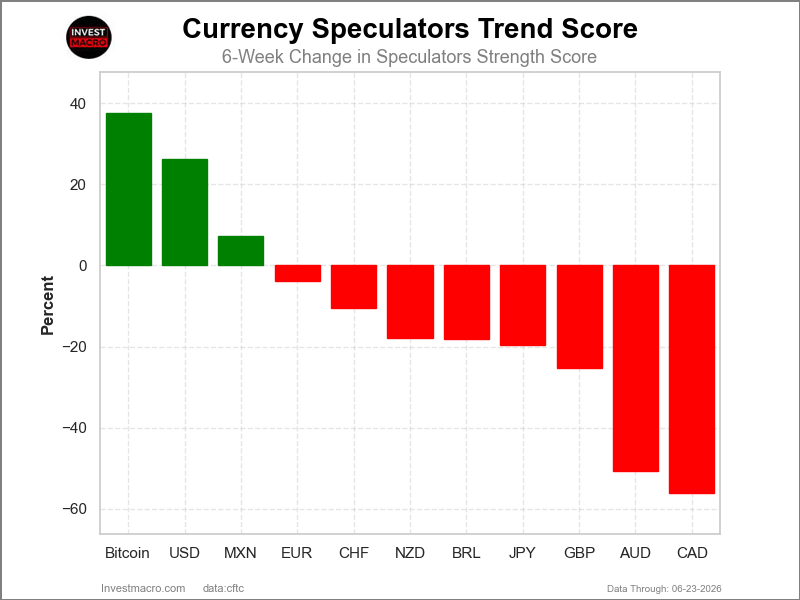
COT Strength Score Trends (or move index, calculates the 6-week changes in strength scores) showed that Bitcoin (38 percent) and the US Dollar Index (26 percent) lead the past six weeks trends for the currencies. The Mexican Peso (7 percent) is the next highest positive movers in the 3-Year trends data.
The Canadian Dollar (-56 percent) leads the downside trend scores currently with the Australian Dollar (-51 percent), British Pound (-25 percent) and the Japanese Yen (-20 percent) following next with lower trend scores.
3-Year Strength Trends:
US Dollar Index (26.3 percent) vs US Dollar Index previous week (33.8 percent)
EuroFX (-3.9 percent) vs EuroFX previous week (0.8 percent)
British Pound Sterling (-25.3 percent) vs British Pound Sterling previous week (-3.1 percent)
Japanese Yen (-19.5 percent) vs Japanese Yen previous week (-24.3 percent)
Swiss Franc (-10.6 percent) vs Swiss Franc previous week (-11.9 percent)
Canadian Dollar (-56.2 percent) vs Canadian Dollar previous week (-50.9 percent)
Australian Dollar (-50.7 percent) vs Australian Dollar previous week (-42.9 percent)
New Zealand Dollar (-17.9 percent) vs New Zealand Dollar previous week (3.5 percent)
Mexican Peso (7.2 percent) vs Mexican Peso previous week (6.8 percent)
Brazilian Real (-18.1 percent) vs Brazilian Real previous week (-18.8 percent)
Bitcoin (37.7 percent) vs Bitcoin previous week (33.8 percent)
Individual COT Forex Markets:
US Dollar Index Futures:
 Positioning Notes:
- US Dollar Index large speculator standing this week resulted in a net position of 12,928 contracts in the data reported through Tuesday.
- Weekly Speculator position decrease of -269 contracts from the previous week which had a total of 13,197 net contracts.
- This week’s current strength score (range over the past 3 years, measured from 0 to 100) shows the speculators are currently Bullish with a score of 79.0 percent.
- The Commercials are Bearish-Extreme with a score of 12.3 percent.
- The Small Traders (not shown in chart) are Bullish-Extreme with a score of 100.0 percent.
Price Trend-Following Model: Strong Uptrend
Our weekly trend-following model classifies the current market price position as: Strong Uptrend.
| US DOLLAR INDEX Statistics | SPECULATORS | COMMERCIALS | SMALL TRADERS |
| – Percent of Open Interest Longs: | 62.4 | 25.6 | 9.1 |
| – Percent of Open Interest Shorts: | 38.9 | 55.2 | 3.1 |
| – Net Position: | 12,928 | -16,246 | 3,318 |
| – Gross Longs: | 34,278 | 14,069 | 5,010 |
| – Gross Shorts: | 21,350 | 30,315 | 1,692 |
| – Long to Short Ratio: | 1.6 to 1 | 0.5 to 1 | 3.0 to 1 |
| NET POSITION TREND: | | | |
| – Strength Index Score (3 Year Range Pct): | 79.0 | 12.3 | 100.0 |
| – Strength Index Reading (3 Year Range): | Bullish | Bearish-Extreme | Bullish-Extreme |
| NET POSITION MOVEMENT INDEX: | | | |
| – 6-Week Change in Strength Index: | 26.3 | -31.6 | 33.3 |
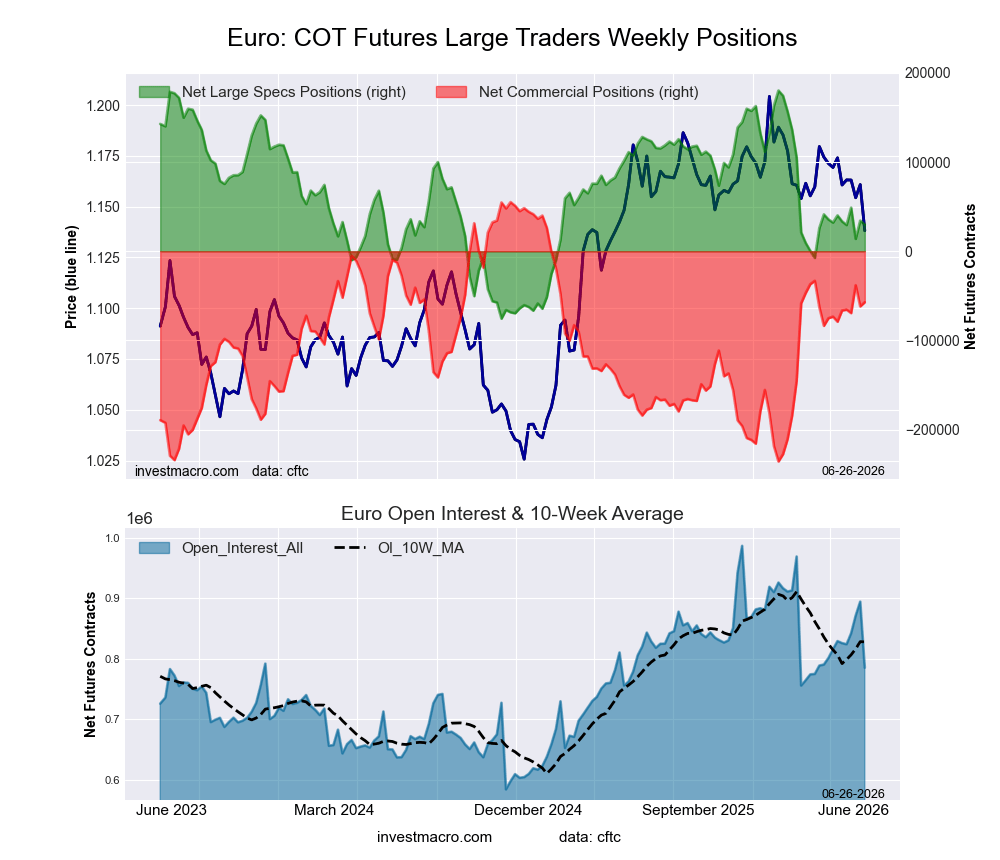
Euro Currency Futures:
 Positioning Notes:
- Euro Currency large speculator standing this week resulted in a net position of 30,158 contracts in the data reported through Tuesday.
- Weekly Speculator position decrease of -4,195 contracts from the previous week which had a total of 34,353 net contracts.
- This week’s current strength score (range over the past 3 years, measured from 0 to 100) shows the speculators are currently Bearish with a score of 41.3 percent.
- The Commercials are Bullish with a score of 61.4 percent.
- The Small Traders (not shown in chart) are Bearish with a score of 31.6 percent.
Price Trend-Following Model: Strong Downtrend
Our weekly trend-following model classifies the current market price position as: Strong Downtrend.
| EURO Currency Statistics | SPECULATORS | COMMERCIALS | SMALL TRADERS |
| – Percent of Open Interest Longs: | 31.5 | 55.0 | 10.4 |
| – Percent of Open Interest Shorts: | 27.6 | 62.3 | 6.9 |
| – Net Position: | 30,158 | -57,183 | 27,025 |
| – Gross Longs: | 247,332 | 431,837 | 81,337 |
| – Gross Shorts: | 217,174 | 489,020 | 54,312 |
| – Long to Short Ratio: | 1.1 to 1 | 0.9 to 1 | 1.5 to 1 |
| NET POSITION TREND: | | | |
| – Strength Index Score (3 Year Range Pct): | 41.3 | 61.4 | 31.6 |
| – Strength Index Reading (3 Year Range): | Bearish | Bullish | Bearish |
| NET POSITION MOVEMENT INDEX: | | | |
| – 6-Week Change in Strength Index: | -3.9 | 7.5 | -25.0 |
British Pound Sterling Futures:
 Positioning Notes:
- British Pound Sterling large speculator standing this week resulted in a net position of -105,719 contracts in the data reported through Tuesday.
- Weekly Speculator position decrease of -34,134 contracts from the previous week which had a total of -71,585 net contracts.
- This week’s current strength score (range over the past 3 years, measured from 0 to 100) shows the speculators are currently Bearish-Extreme with a score of 0.0 percent.
- The Commercials are Bullish-Extreme with a score of 100.0 percent.
- The Small Traders (not shown in chart) are Bearish-Extreme with a score of 7.2 percent.
Price Trend-Following Model: Strong Downtrend
Our weekly trend-following model classifies the current market price position as: Strong Downtrend.
| BRITISH POUND Statistics | SPECULATORS | COMMERCIALS | SMALL TRADERS |
| – Percent of Open Interest Longs: | 13.7 | 78.2 | 6.4 |
| – Percent of Open Interest Shorts: | 49.3 | 36.7 | 12.4 |
| – Net Position: | -105,719 | 123,431 | -17,712 |
| – Gross Longs: | 40,772 | 232,430 | 19,092 |
| – Gross Shorts: | 146,491 | 108,999 | 36,804 |
| – Long to Short Ratio: | 0.3 to 1 | 2.1 to 1 | 0.5 to 1 |
| NET POSITION TREND: | | | |
| – Strength Index Score (3 Year Range Pct): | 0.0 | 100.0 | 7.2 |
| – Strength Index Reading (3 Year Range): | Bearish-Extreme | Bullish-Extreme | Bearish-Extreme |
| NET POSITION MOVEMENT INDEX: | | | |
| – 6-Week Change in Strength Index: | -25.3 | 28.4 | -41.9 |
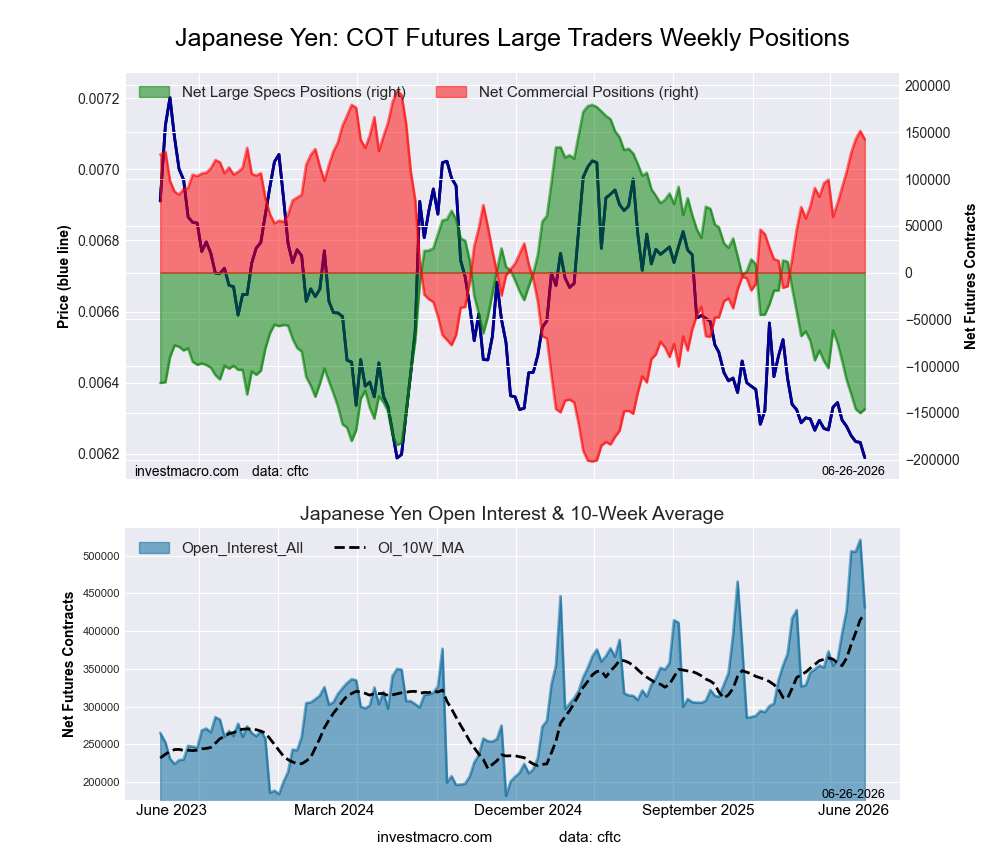
Japanese Yen Futures:
 Positioning Notes:
- Japanese Yen large speculator standing this week resulted in a net position of -146,104 contracts in the data reported through Tuesday.
- Weekly Speculator position boost of 4,028 contracts from the previous week which had a total of -150,132 net contracts.
- This week’s current strength score (range over the past 3 years, measured from 0 to 100) shows the speculators are currently Bearish-Extreme with a score of 10.5 percent.
- The Commercials are Bullish-Extreme with a score of 86.8 percent.
- The Small Traders (not shown in chart) are Bearish with a score of 43.1 percent.
Price Trend-Following Model: Strong Downtrend
Our weekly trend-following model classifies the current market price position as: Strong Downtrend.
| JAPANESE YEN Statistics | SPECULATORS | COMMERCIALS | SMALL TRADERS |
| – Percent of Open Interest Longs: | 26.4 | 58.5 | 11.0 |
| – Percent of Open Interest Shorts: | 60.3 | 25.5 | 10.1 |
| – Net Position: | -146,104 | 142,381 | 3,723 |
| – Gross Longs: | 113,698 | 252,278 | 47,306 |
| – Gross Shorts: | 259,802 | 109,897 | 43,583 |
| – Long to Short Ratio: | 0.4 to 1 | 2.3 to 1 | 1.1 to 1 |
| NET POSITION TREND: | | | |
| – Strength Index Score (3 Year Range Pct): | 10.5 | 86.8 | 43.1 |
| – Strength Index Reading (3 Year Range): | Bearish-Extreme | Bullish-Extreme | Bearish |
| NET POSITION MOVEMENT INDEX: | | | |
| – 6-Week Change in Strength Index: | -19.5 | 17.2 | 7.6 |
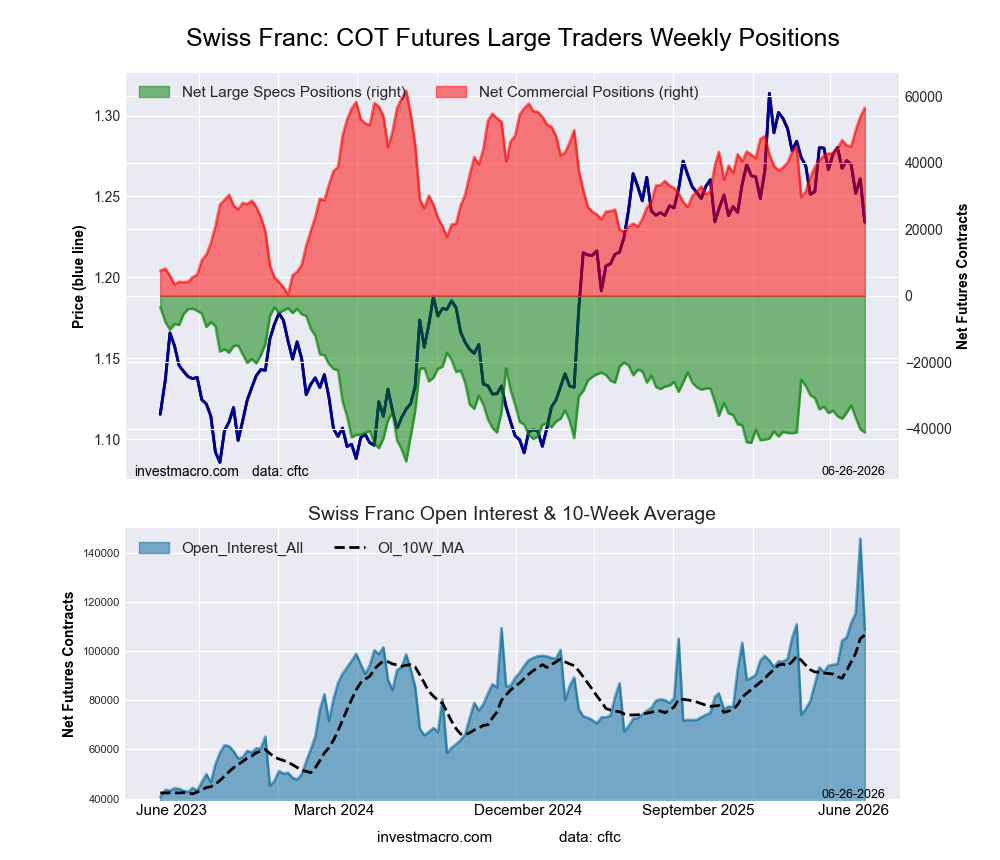
Swiss Franc Futures:
 Positioning Notes:
- Swiss Franc large speculator standing this week resulted in a net position of -41,094 contracts in the data reported through Tuesday.
- Weekly Speculator position fall of -1,036 contracts from the previous week which had a total of -40,058 net contracts.
- This week’s current strength score (range over the past 3 years, measured from 0 to 100) shows the speculators are currently Bearish-Extreme with a score of 18.8 percent.
- The Commercials are Bullish-Extreme with a score of 91.6 percent.
- The Small Traders (not shown in chart) are Bearish-Extreme with a score of 13.5 percent.
Price Trend-Following Model: Strong Downtrend
Our weekly trend-following model classifies the current market price position as: Strong Downtrend.
| SWISS FRANC Statistics | SPECULATORS | COMMERCIALS | SMALL TRADERS |
| – Percent of Open Interest Longs: | 7.3 | 83.6 | 9.0 |
| – Percent of Open Interest Shorts: | 45.2 | 31.6 | 23.2 |
| – Net Position: | -41,094 | 56,495 | -15,401 |
| – Gross Longs: | 7,975 | 90,828 | 9,792 |
| – Gross Shorts: | 49,069 | 34,333 | 25,193 |
| – Long to Short Ratio: | 0.2 to 1 | 2.6 to 1 | 0.4 to 1 |
| NET POSITION TREND: | | | |
| – Strength Index Score (3 Year Range Pct): | 18.8 | 91.6 | 13.5 |
| – Strength Index Reading (3 Year Range): | Bearish-Extreme | Bullish-Extreme | Bearish-Extreme |
| NET POSITION MOVEMENT INDEX: | | | |
| – 6-Week Change in Strength Index: | -10.6 | 19.9 | -31.0 |
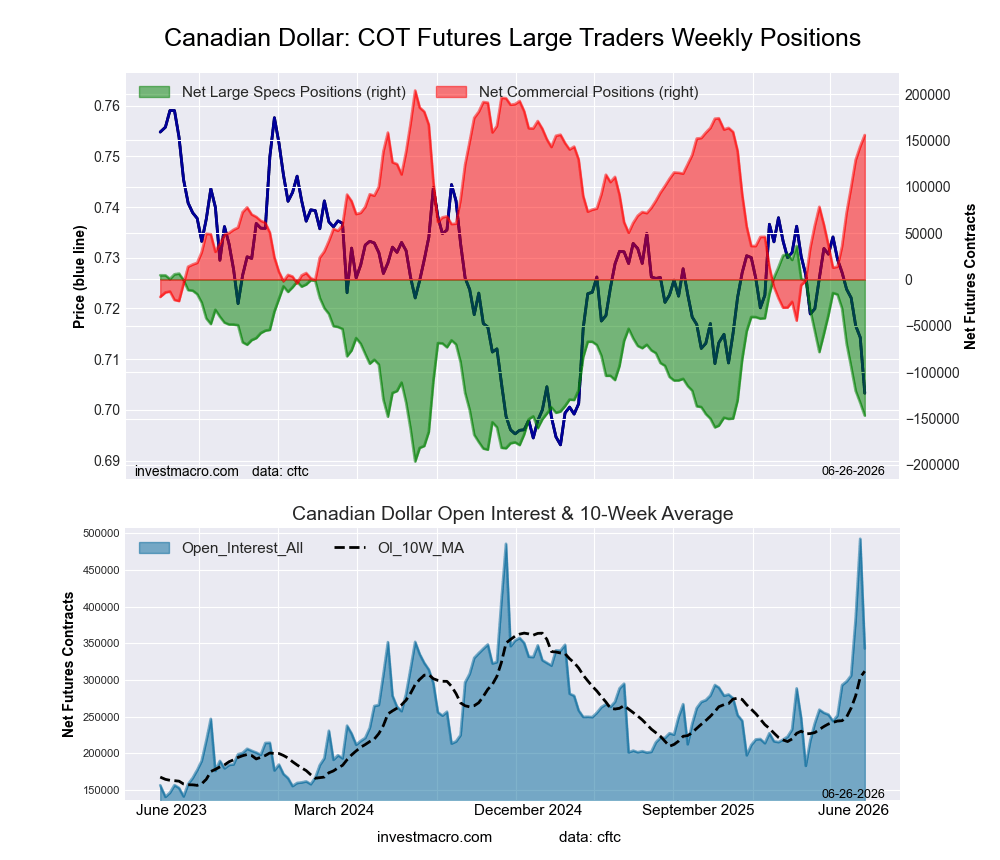
Canadian Dollar Futures:
 Positioning Notes:
- Canadian Dollar large speculator standing this week resulted in a net position of -146,792 contracts in the data reported through Tuesday.
- Weekly Speculator position reduction of -13,891 contracts from the previous week which had a total of -132,901 net contracts.
- This week’s current strength score (range over the past 3 years, measured from 0 to 100) shows the speculators are currently Bearish with a score of 21.3 percent.
- The Commercials are Bullish-Extreme with a score of 80.7 percent.
- The Small Traders (not shown in chart) are Bearish with a score of 21.9 percent.
Price Trend-Following Model: Strong Downtrend
Our weekly trend-following model classifies the current market price position as: Strong Downtrend.
| CANADIAN DOLLAR Statistics | SPECULATORS | COMMERCIALS | SMALL TRADERS |
| – Percent of Open Interest Longs: | 11.5 | 78.0 | 8.9 |
| – Percent of Open Interest Shorts: | 54.3 | 32.6 | 11.5 |
| – Net Position: | -146,792 | 155,789 | -8,997 |
| – Gross Longs: | 39,429 | 267,566 | 30,351 |
| – Gross Shorts: | 186,221 | 111,777 | 39,348 |
| – Long to Short Ratio: | 0.2 to 1 | 2.4 to 1 | 0.8 to 1 |
| NET POSITION TREND: | | | |
| – Strength Index Score (3 Year Range Pct): | 21.3 | 80.7 | 21.9 |
| – Strength Index Reading (3 Year Range): | Bearish | Bullish-Extreme | Bearish |
| NET POSITION MOVEMENT INDEX: | | | |
| – 6-Week Change in Strength Index: | -56.2 | 57.3 | -34.8 |
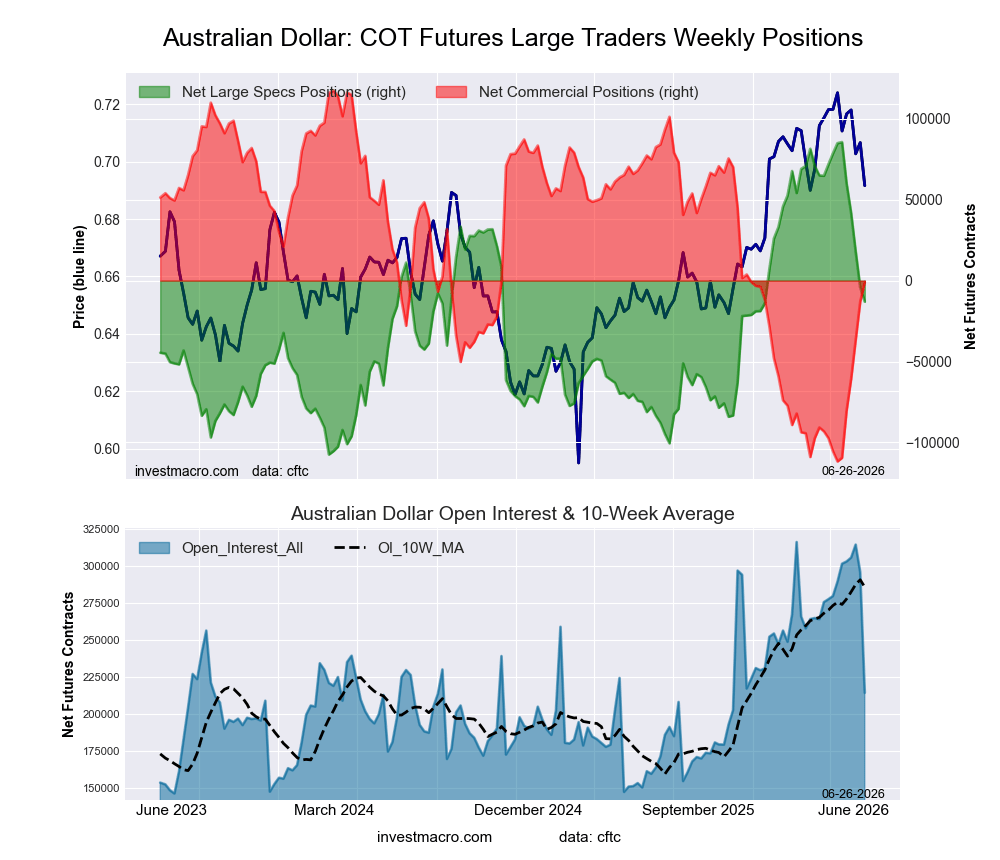
Australian Dollar Futures:
 Positioning Notes:
- Australian Dollar large speculator standing this week resulted in a net position of -13,012 contracts in the data reported through Tuesday.
- Weekly Speculator position fall of -8,887 contracts from the previous week which had a total of -4,125 net contracts.
- This week’s current strength score (range over the past 3 years, measured from 0 to 100) shows the speculators are currently Bearish with a score of 48.9 percent.
- The Commercials are Bearish with a score of 48.4 percent.
- The Small Traders (not shown in chart) are Bullish with a score of 69.1 percent.
Price Trend-Following Model: Weak Uptrend
Our weekly trend-following model classifies the current market price position as: Weak Uptrend.
| AUSTRALIAN DOLLAR Statistics | SPECULATORS | COMMERCIALS | SMALL TRADERS |
| – Percent of Open Interest Longs: | 38.3 | 45.3 | 16.0 |
| – Percent of Open Interest Shorts: | 44.4 | 45.7 | 9.6 |
| – Net Position: | -13,012 | -863 | 13,875 |
| – Gross Longs: | 82,200 | 97,086 | 34,390 |
| – Gross Shorts: | 95,212 | 97,949 | 20,515 |
| – Long to Short Ratio: | 0.9 to 1 | 1.0 to 1 | 1.7 to 1 |
| NET POSITION TREND: | | | |
| – Strength Index Score (3 Year Range Pct): | 48.9 | 48.4 | 69.1 |
| – Strength Index Reading (3 Year Range): | Bearish | Bearish | Bullish |
| NET POSITION MOVEMENT INDEX: | | | |
| – 6-Week Change in Strength Index: | -50.7 | 48.4 | -27.5 |
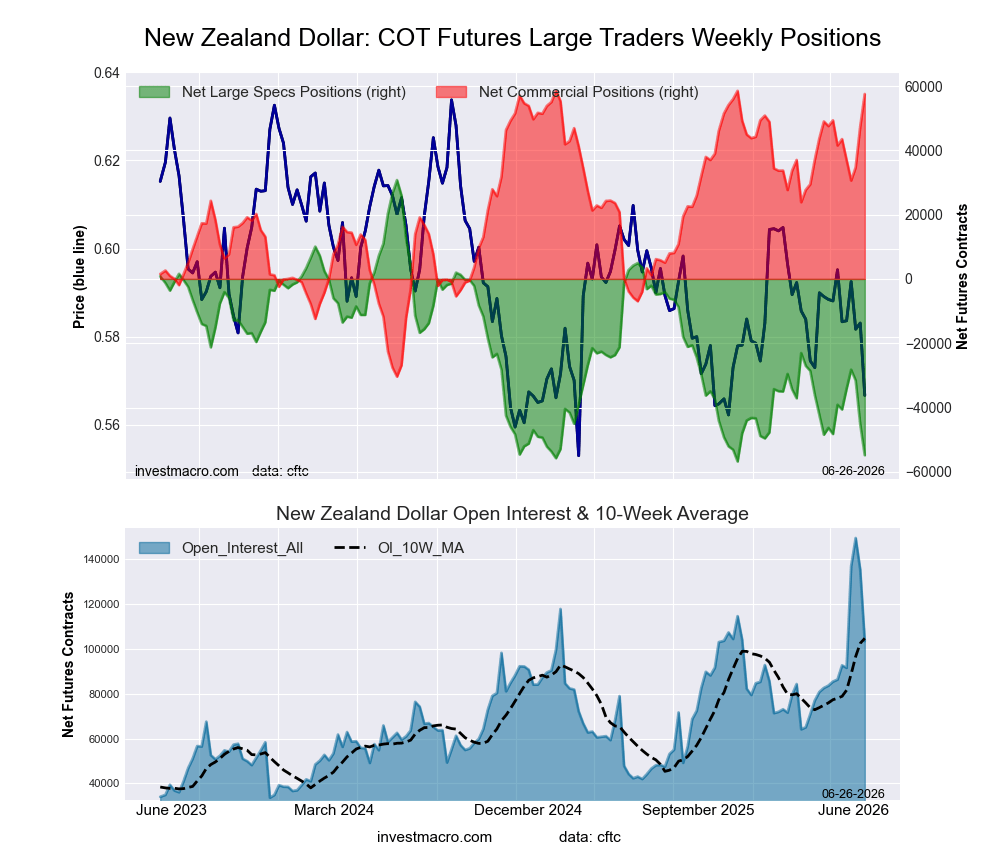
New Zealand Dollar Futures:
 Positioning Notes:
- New Zealand Dollar large speculator standing this week resulted in a net position of -54,844 contracts in the data reported through Tuesday.
- Weekly Speculator position reduction of -9,683 contracts from the previous week which had a total of -45,161 net contracts.
- This week’s current strength score (range over the past 3 years, measured from 0 to 100) shows the speculators are currently Bearish-Extreme with a score of 2.2 percent.
- The Commercials are Bullish-Extreme with a score of 98.8 percent.
- The Small Traders (not shown in chart) are Bearish-Extreme with a score of 15.2 percent.
Price Trend-Following Model: Strong Downtrend
Our weekly trend-following model classifies the current market price position as: Strong Downtrend.
| NEW ZEALAND DOLLAR Statistics | SPECULATORS | COMMERCIALS | SMALL TRADERS |
| – Percent of Open Interest Longs: | 11.7 | 84.0 | 3.4 |
| – Percent of Open Interest Shorts: | 64.8 | 28.4 | 6.0 |
| – Net Position: | -54,844 | 57,522 | -2,678 |
| – Gross Longs: | 12,114 | 86,813 | 3,469 |
| – Gross Shorts: | 66,958 | 29,291 | 6,147 |
| – Long to Short Ratio: | 0.2 to 1 | 3.0 to 1 | 0.6 to 1 |
| NET POSITION TREND: | | | |
| – Strength Index Score (3 Year Range Pct): | 2.2 | 98.8 | 15.2 |
| – Strength Index Reading (3 Year Range): | Bearish-Extreme | Bullish-Extreme | Bearish-Extreme |
| NET POSITION MOVEMENT INDEX: | | | |
| – 6-Week Change in Strength Index: | -17.9 | 18.0 | -4.2 |
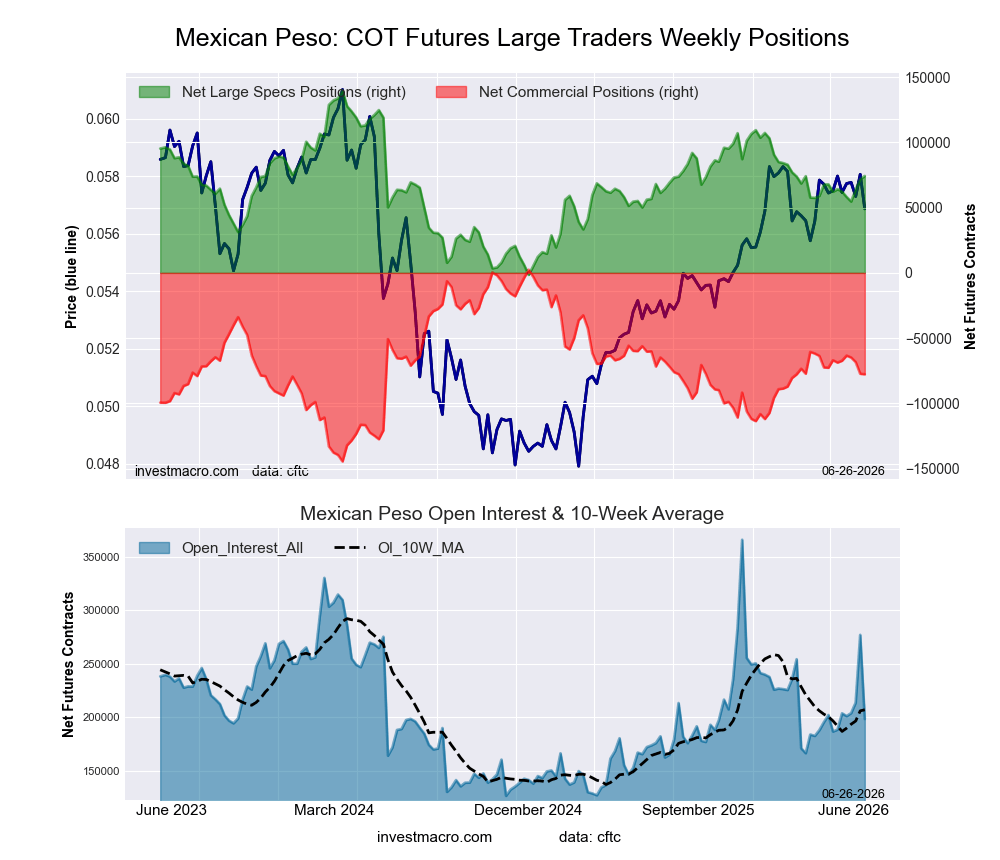
Mexican Peso Futures:
 Positioning Notes:
- Mexican Peso large speculator standing this week resulted in a net position of 74,225 contracts in the data reported through Tuesday.
- Weekly Speculator position gain of 2,436 contracts from the previous week which had a total of 71,789 net contracts.
- This week’s current strength score (range over the past 3 years, measured from 0 to 100) shows the speculators are currently Bullish with a score of 53.6 percent.
- The Commercials are Bearish with a score of 45.5 percent.
- The Small Traders (not shown in chart) are Bullish with a score of 52.8 percent.
Price Trend-Following Model: Weak Uptrend
Our weekly trend-following model classifies the current market price position as: Weak Uptrend.
| MEXICAN PESO Statistics | SPECULATORS | COMMERCIALS | SMALL TRADERS |
| – Percent of Open Interest Longs: | 56.6 | 39.7 | 3.4 |
| – Percent of Open Interest Shorts: | 19.2 | 78.8 | 1.7 |
| – Net Position: | 74,225 | -77,667 | 3,442 |
| – Gross Longs: | 112,389 | 78,775 | 6,786 |
| – Gross Shorts: | 38,164 | 156,442 | 3,344 |
| – Long to Short Ratio: | 2.9 to 1 | 0.5 to 1 | 2.0 to 1 |
| NET POSITION TREND: | | | |
| – Strength Index Score (3 Year Range Pct): | 53.6 | 45.5 | 52.8 |
| – Strength Index Reading (3 Year Range): | Bullish | Bearish | Bullish |
| NET POSITION MOVEMENT INDEX: | | | |
| – 6-Week Change in Strength Index: | 7.2 | -6.1 | -8.5 |
Brazilian Real Futures:
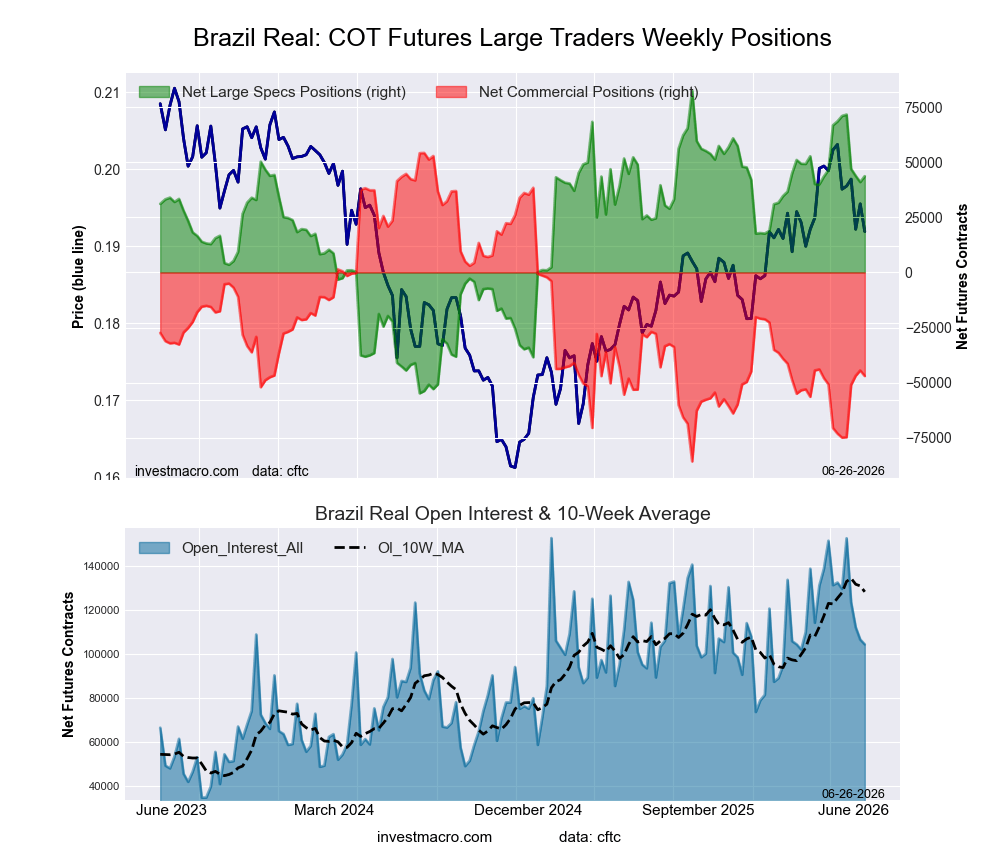 Positioning Notes:
- Brazilian Real large speculator standing this week resulted in a net position of 43,679 contracts in the data reported through Tuesday.
- Weekly Speculator position gain of 2,685 contracts from the previous week which had a total of 40,994 net contracts.
- This week’s current strength score (range over the past 3 years, measured from 0 to 100) shows the speculators are currently Bullish with a score of 71.7 percent.
- The Commercials are Bearish with a score of 27.7 percent.
- The Small Traders (not shown in chart) are Bearish with a score of 39.6 percent.
Price Trend-Following Model: Weak Uptrend
Our weekly trend-following model classifies the current market price position as: Weak Uptrend.
| BRAZIL REAL Statistics | SPECULATORS | COMMERCIALS | SMALL TRADERS |
| – Percent of Open Interest Longs: | 71.8 | 22.2 | 4.5 |
| – Percent of Open Interest Shorts: | 29.9 | 67.2 | 1.3 |
| – Net Position: | 43,679 | -47,025 | 3,346 |
| – Gross Longs: | 74,888 | 23,105 | 4,718 |
| – Gross Shorts: | 31,209 | 70,130 | 1,372 |
| – Long to Short Ratio: | 2.4 to 1 | 0.3 to 1 | 3.4 to 1 |
| NET POSITION TREND: | | | |
| – Strength Index Score (3 Year Range Pct): | 71.7 | 27.7 | 39.6 |
| – Strength Index Reading (3 Year Range): | Bullish | Bearish | Bearish |
| NET POSITION MOVEMENT INDEX: | | | |
| – 6-Week Change in Strength Index: | -18.1 | 18.7 | -7.2 |
Bitcoin Futures:
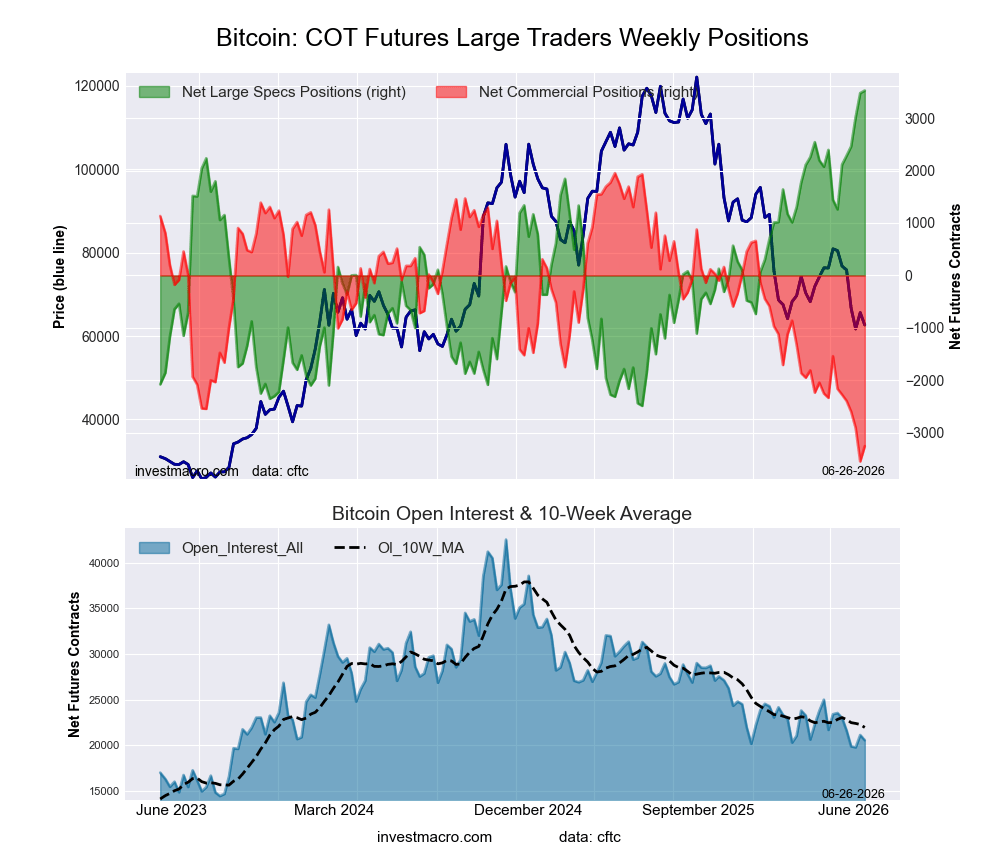 Positioning Notes:
- Bitcoin large speculator standing this week resulted in a net position of 3,524 contracts in the data reported through Tuesday.
- Weekly Speculator position rise of 49 contracts from the previous week which had a total of 3,475 net contracts.
- This week’s current strength score (range over the past 3 years, measured from 0 to 100) shows the speculators are currently Bullish-Extreme with a score of 100.0 percent.
- The Commercials are Bearish-Extreme with a score of 5.3 percent.
- The Small Traders (not shown in chart) are Bearish with a score of 23.3 percent.
Price Trend-Following Model: Strong Downtrend
Our weekly trend-following model classifies the current market price position as: Strong Downtrend.
| BITCOIN Statistics | SPECULATORS | COMMERCIALS | SMALL TRADERS |
| – Percent of Open Interest Longs: | 79.5 | 0.3 | 4.5 |
| – Percent of Open Interest Shorts: | 62.4 | 16.2 | 5.9 |
| – Net Position: | 3,524 | -3,253 | -271 |
| – Gross Longs: | 16,348 | 70 | 935 |
| – Gross Shorts: | 12,824 | 3,323 | 1,206 |
| – Long to Short Ratio: | 1.3 to 1 | 0.0 to 1 | 0.8 to 1 |
| NET POSITION TREND: | | | |
| – Strength Index Score (3 Year Range Pct): | 100.0 | 5.3 | 23.3 |
| – Strength Index Reading (3 Year Range): | Bullish-Extreme | Bearish-Extreme | Bearish |
| NET POSITION MOVEMENT INDEX: | | | |
| – 6-Week Change in Strength Index: | 37.7 | -19.9 | -60.7 |
Article By InvestMacro – Receive our weekly COT Reports by Email
*COT Report: The COT data, released weekly to the public each Friday, is updated through the most recent Tuesday (data is 3 days old) and shows a quick view of how large speculators or non-commercials (for-profit traders) were positioned in the futures markets.
The CFTC categorizes trader positions according to commercial hedgers (traders who use futures contracts for hedging as part of the business), non-commercials (large traders who speculate to realize trading profits) and nonreportable traders (usually small traders/speculators) as well as their open interest (contracts open in the market at time of reporting).See CFTC criteria here.
All information and opinions on this website and contained in this article are for general informational purposes only and do not constitute investment advice.