
By RoboForex Analytical Department
The AUD/USD pair is declining, reaching 0.6539 on Wednesday.
The Australian dollar is heading back to a three-week low following the release of softer-than-expected consumer price index (CPI) data from Australia.
For February 2024, inflation in Australia stood at 3.4%, unchanged from the previous report, in contrast to the anticipated slight increase to 3.5%. This marks the lowest inflation level since November 2021.
Last week, the Reserve Bank of Australia (RBA) held its meeting and decided to keep the interest rate unchanged at 4.35% annually. The rate remains at a 12-year peak, unchanged for the third consecutive meeting. The RBA’s stance has slightly shifted; the regulator no longer indicates further rate hikes, confident that inflation will ease pressure. This opens the possibility of rate reductions later in the year.
The US dollar is strengthening today amid growing expectations that the Federal Reserve will maintain interest rates high for an extended period. This contrasts with forecasts of monetary policy easing by other central banks, some of which could occur before the Fed’s actions.
Free Reports:
 Download Our Metatrader 4 Indicators – Put Our Free MetaTrader 4 Custom Indicators on your charts when you join our Weekly Newsletter
 Get our Weekly Commitment of Traders Reports - See where the biggest traders (Hedge Funds and Commercial Hedgers) are positioned in the futures markets on a weekly basis.
Technical Analysis of AUD/USD
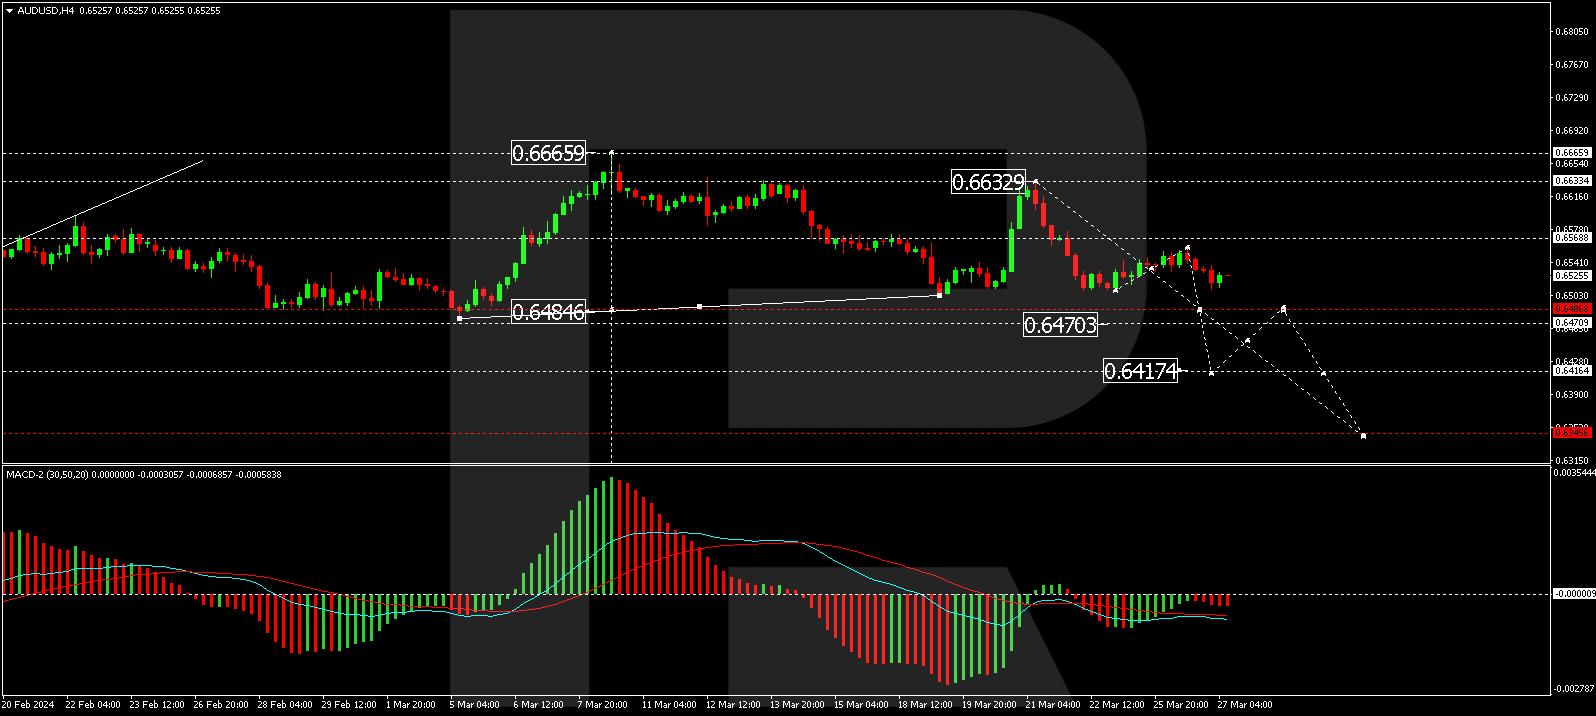
On the H4 chart of AUD/USD, a correction to 0.6558 has been completed. The market is continuing to develop a declining wave to 0.6486. After reaching this level, a consolidation range is expected. With a downward exit from this range, there is a potential for further decline to 0.6417. This target is local. The MACD indicator supports this scenario, with its signal line below zero and strictly directed downwards.
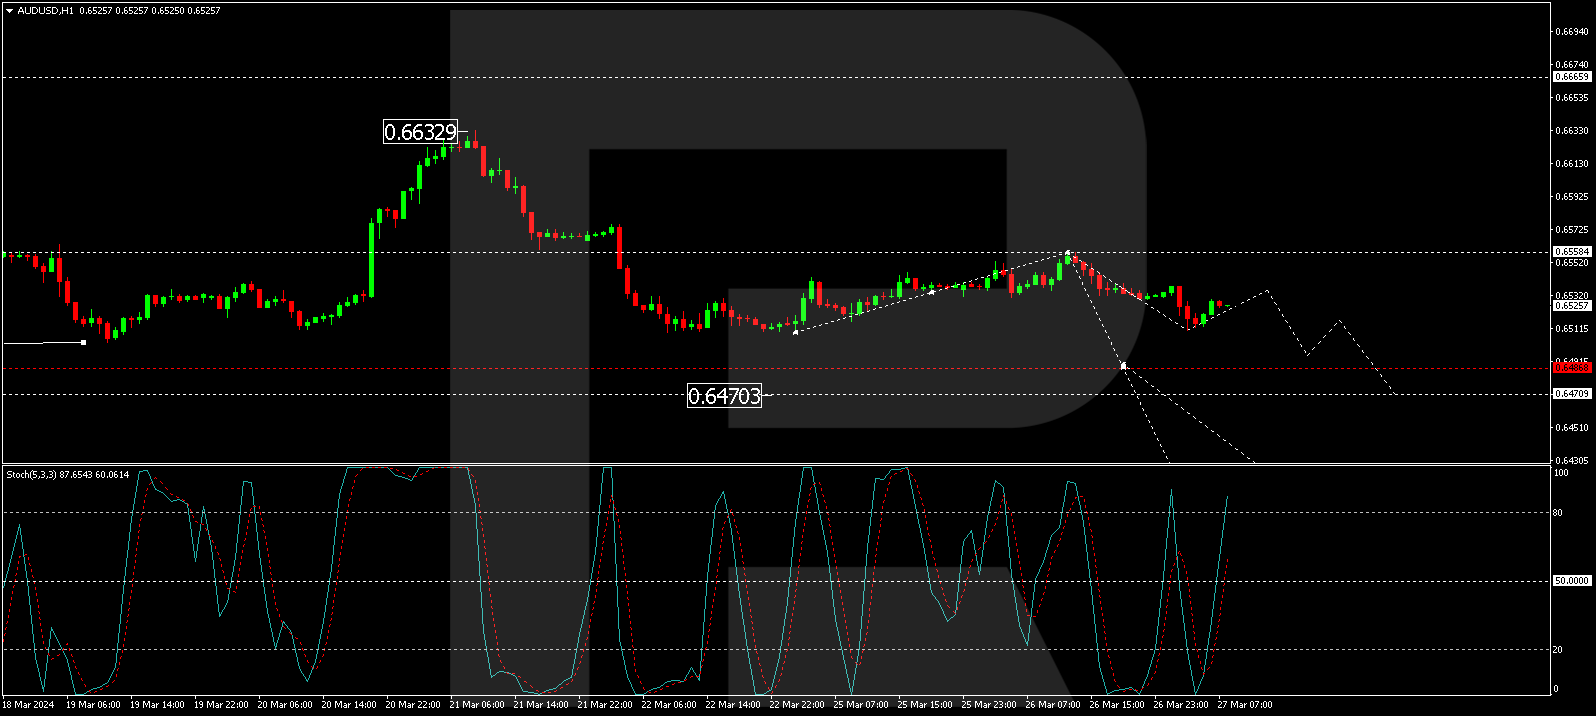
On the H1 chart, AUD/USD is forming a declining wave structure towards 0.6486. After reaching this level, a corrective phase to 0.6533 may occur, followed by a decline to 0.6470, with the potential to continue the trend towards 0.6417. The Stochastic oscillator confirms this scenario, with its signal line above 80 and preparing for a decline to 20.
Disclaimer
Any forecasts contained herein are based on the author’s particular opinion. This analysis may not be treated as trading advice. RoboForex bears no responsibility for trading results based on trading recommendations and reviews contained herein.

- Oil prices jumped 4% amid a new wave of escalation between the US and Iran Jul 13, 2026
- EUR/USD: US Inflation Will Determine Everything Jul 13, 2026
- COT Metals Charts: Weekly Speculator Bets see small gains for Silver & Gold Jul 12, 2026
- COT Bonds Charts: Speculator Bets led by SOFR 3-Months & 2-Year Bonds Jul 12, 2026
- COT Energy Charts: Weekly Speculator Changes led by Brent Oil Jul 12, 2026
- COT Soft Commodities Charts: Weekly Speculator Changes led by Sugar, Corn & Soybeans Jul 12, 2026
- The US and European stock indices are rising again amid renewed investor interest in the AI industry. Jul 10, 2026
- USD/JPY Falls as Yen Recovers Weekly Losses Jul 10, 2026
- Crude oil prices surged sharply by 7% in reaction to the rapid escalation of the conflict in the Middle East Jul 9, 2026
- Middle East Tensions Weigh on Gold Jul 9, 2026