By InvestMacro
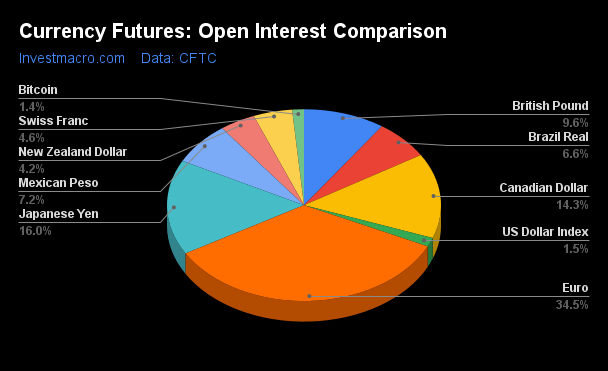
Here are the latest charts and statistics for the Commitment of Traders (COT) data published by the Commodities Futures Trading Commission (CFTC).
The latest COT data is updated through Tuesday March 25th and shows a quick view of how large market participants (for-profit speculators and commercial traders) were positioned in the futures markets. All currency positions are in direct relation to the US dollar where, for example, a bet for the euro is a bet that the euro will rise versus the dollar while a bet against the euro will be a bet that the euro will decline versus the dollar.
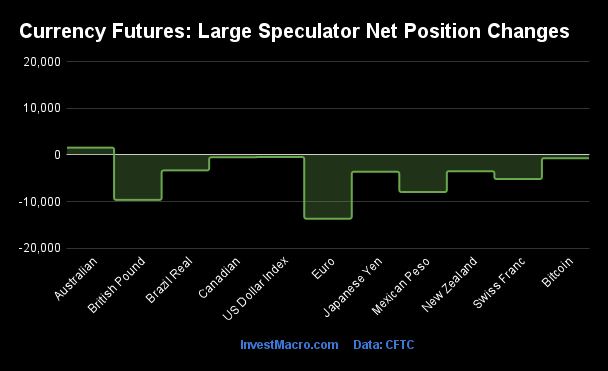
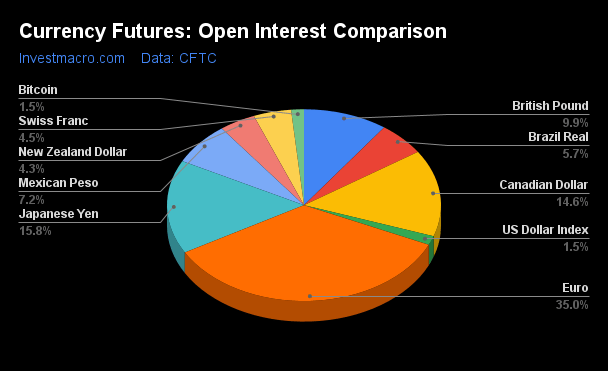
Weekly Speculator Changes led by British Pound & Canadian Dollar
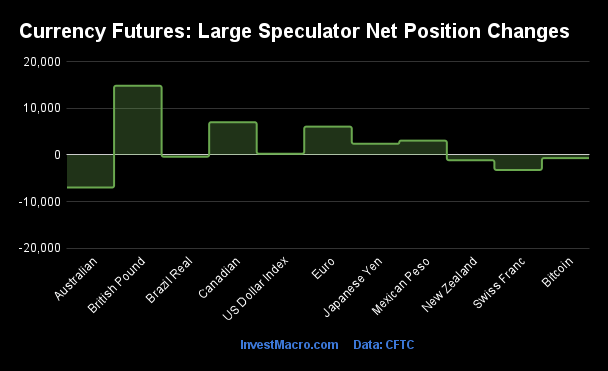
The COT currency market speculator bets were slightly overall higher this week as six out of the eleven currency markets we cover had higher positioning while the other five markets had lower speculator contracts.
Leading the gains for the currency markets was the British Pound Sterling (14,881 contracts) with the Canadian Dollar (7,048 contracts), the Euro (6,100 contracts), the Mexican Peso (3,087 contracts), the Japanese Yen (2,412 contracts) and the US Dollar Index (280 contracts) also showing positive weeks.
The currencies seeing declines in speculator bets on the week were the Australian Dollar (-6,997 contracts), the Swiss Franc (-3,218 contracts), the New Zealand Dollar (-1,123 contracts), Bitcoin (-662 contracts) and the Brazilian Real (-372 contracts) also registering lower bets on the week.
RoundUp: Speculators continued to add to Japanese & European currencies while US Dollar & Commodity currencies see lower bets
The speculative landscape for the currency futures this week continued to be a mixed bag with some major currencies seeing sentiment gains versus the US Dollar while others continued to see weak sentiment levels persist.
The US Dollar Index futures saw slightly higher speculator contracts this week with a small gain of 280 contracts. But overall, the US Dollar Index bets have fallen in three out of the past five weeks and by a total of -9,300 contracts over these past five weeks, bringing the total bullish position to just +7,468 contracts (down by more than 50% of 3 weeks ago). The Dollar Index price has remained in a short-term downtrend that started in the new year and has taken the price from over 109.00 to the current level of approximately 104.00. The 102.50 and the very significant level of 100.00 still linger below as major support barriers if the downtrend continues.
The Euro speculator positions have continued to see positive sentiment with gains in six straight weeks and the overall position has risen by +129,950 contracts in the last six weeks through Tuesday. The Euro standing for speculators is at the highest level since September after a 20-week spell in bearish territory from October to early March. The Euro futures price trades around the 1.0825 level currently, up from around the 1.0250 levels to end 2024 but would need to breakthrough the tough 1.1250 resistance to see a strong breakout to the upside and perhaps, a new Euro bull market.
The British pound sterling led the currencies in bullish bets on the week and overall, the GBP speculator positions have risen for eight straight weeks through Tuesday. This has brought the overall spec standing to a +44,283 contract bullish position – the highest since November. The GBP futures price has been on a bullish run since the beginning of the new year and is currently right at a significant overhead resistance level of 1.3000. The test of this level will determine the next path for the GBP as a breakthrough above 1.3000 could see a retest of the 2024 high (just below 1.3500) or we could see a breakdown and testing of lower levels (200-weekly ma at 1.2715 & previous support around 1.2500-1.2650).
The Japanese yen speculators boosted their bets this week for the ninth time out of the past ten weeks with a total +154,787 contract gain over that time. This week’s spec level is the third highest level on record at a total of +125,376 contracts for the yen and demonstrates how bullish speculators are on the currency. However, it remains to be seen if this level of sentiment can propel the JPY to higher price levels. The yen remains in a historically weak position versus the US Dollar as the USDJPY trades right around the 150.00 level and the currency pair has been bid up relatively quickly anytime there is a dip below this threshold. There is going to need a sustained push below the 150.00 level to get traction on a yen bullish case.
The Canadian, Australian and New Zealand dollars (commodity currencies) are all in similar situations currently in terms of speculator positioning. All three sport strength scores (current levels compared to last 3-years of spec bets) of 30 or under with the Canadian dollar at 30, Australian at 21 and the New Zealand currency at 16. Recently, the New Zealand dollar speculator positions fell to an all-time record low of -55,765 contracts on March 4th. Perhaps, the worst of the sentiment is over for these currencies in this down cycle but we would need to see a sustained turning of the bearish positions in conjunction with price trends coming out of the deep downtrends all three currencies are in now.
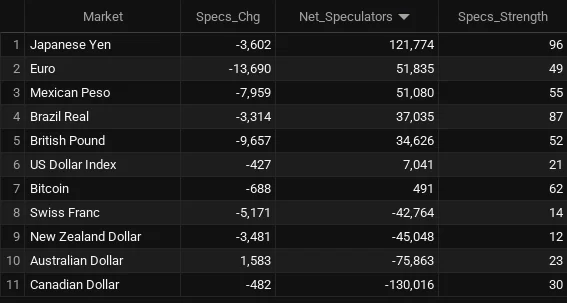
Currencies Net Speculators Leaderboard

Legend: Weekly Speculators Change | Speculators Current Net Position | Speculators Strength Score compared to last 3-Years (0-100 range)
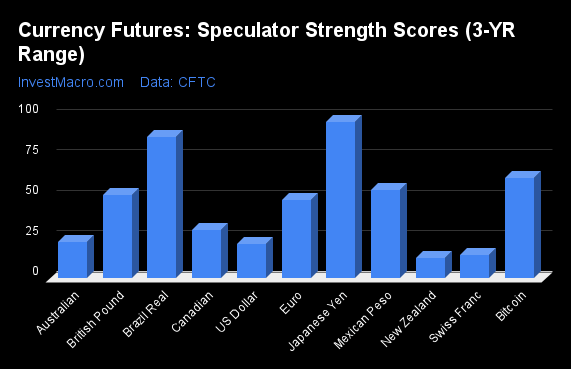
Strength Scores led by Japanese Yen & Brazilian Real
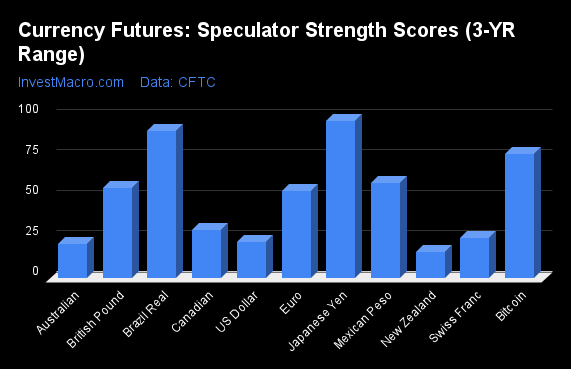
COT Strength Scores (a normalized measure of Speculator positions over a 3-Year range, from 0 to 100 where above 80 is Extreme-Bullish and below 20 is Extreme-Bearish) showed that the Japanese Yen (97 percent) and the Brazilian Real (91 percent) lead the currency markets this week. Bitcoin (77 percent), the Mexican Peso (59 percent) and the British Pound (56 percent) came in as the next highest in the weekly strength scores.
On the downside, the New Zealand Dollar (16 percent) comes in at the lowest strength levels currently and is in Extreme-Bearish territory (below 20 percent). The next lowest strength scores are the Australian Dollar (21 percent), the US Dollar Index (22 percent) and the Swiss Franc (25 percent).
3-Year Strength Statistics:
US Dollar Index (22.2 percent) vs US Dollar Index previous week (21.6 percent)
EuroFX (53.7 percent) vs EuroFX previous week (51.4 percent)
British Pound Sterling (56.0 percent) vs British Pound Sterling previous week (49.3 percent)
Japanese Yen (97.3 percent) vs Japanese Yen previous week (96.6 percent)
Swiss Franc (24.7 percent) vs Swiss Franc previous week (31.2 percent)
Canadian Dollar (29.9 percent) vs Canadian Dollar previous week (26.7 percent)
Australian Dollar (21.3 percent) vs Australian Dollar previous week (26.3 percent)
New Zealand Dollar (16.4 percent) vs New Zealand Dollar previous week (17.7 percent)
Mexican Peso (58.9 percent) vs Mexican Peso previous week (57.3 percent)
Brazilian Real (90.6 percent) vs Brazilian Real previous week (90.9 percent)
Bitcoin (77.0 percent) vs Bitcoin previous week (91.5 percent)
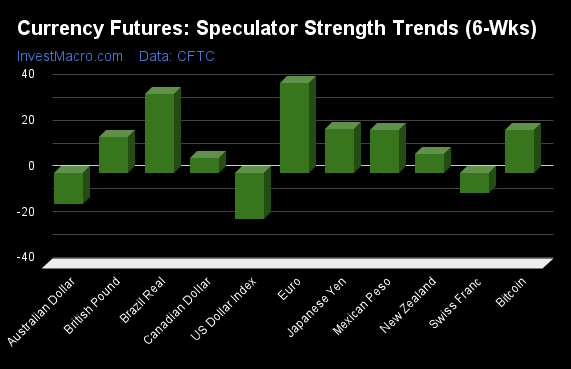
EuroFX & Brazilian Real top the 6-Week Strength Trends
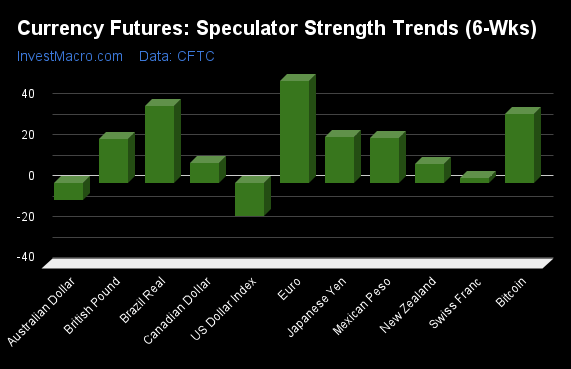
COT Strength Score Trends (or move index, calculates the 6-week changes in strength scores) showed that the EuroFX (49 percent) and the Brazilian Real (37 percent) lead the past six weeks trends for the currencies. Bitcoin (34 percent), the Japanese Yen (22 percent) and the Mexican Peso (22 percent) are the next highest positive movers in the 3-Year trends data.
The US Dollar Index (-16 percent) leads the downside trend scores currently with the Australian Dollar (-8 percent) following next with lower trend scores.
3-Year Strength Trends:
US Dollar Index (-16.2 percent) vs US Dollar Index previous week (-15.2 percent)
EuroFX (49.5 percent) vs EuroFX previous week (44.9 percent)
British Pound Sterling (21.3 percent) vs British Pound Sterling previous week (18.3 percent)
Japanese Yen (22.2 percent) vs Japanese Yen previous week (32.8 percent)
Swiss Franc (2.3 percent) vs Swiss Franc previous week (16.0 percent)
Canadian Dollar (9.5 percent) vs Canadian Dollar previous week (10.7 percent)
Australian Dollar (-8.4 percent) vs Australian Dollar previous week (3.4 percent)
New Zealand Dollar (9.0 percent) vs New Zealand Dollar previous week (10.0 percent)
Mexican Peso (22.0 percent) vs Mexican Peso previous week (22.3 percent)
Brazilian Real (37.4 percent) vs Brazilian Real previous week (38.5 percent)
Bitcoin (33.7 percent) vs Bitcoin previous week (23.0 percent)
Individual COT Forex Markets:
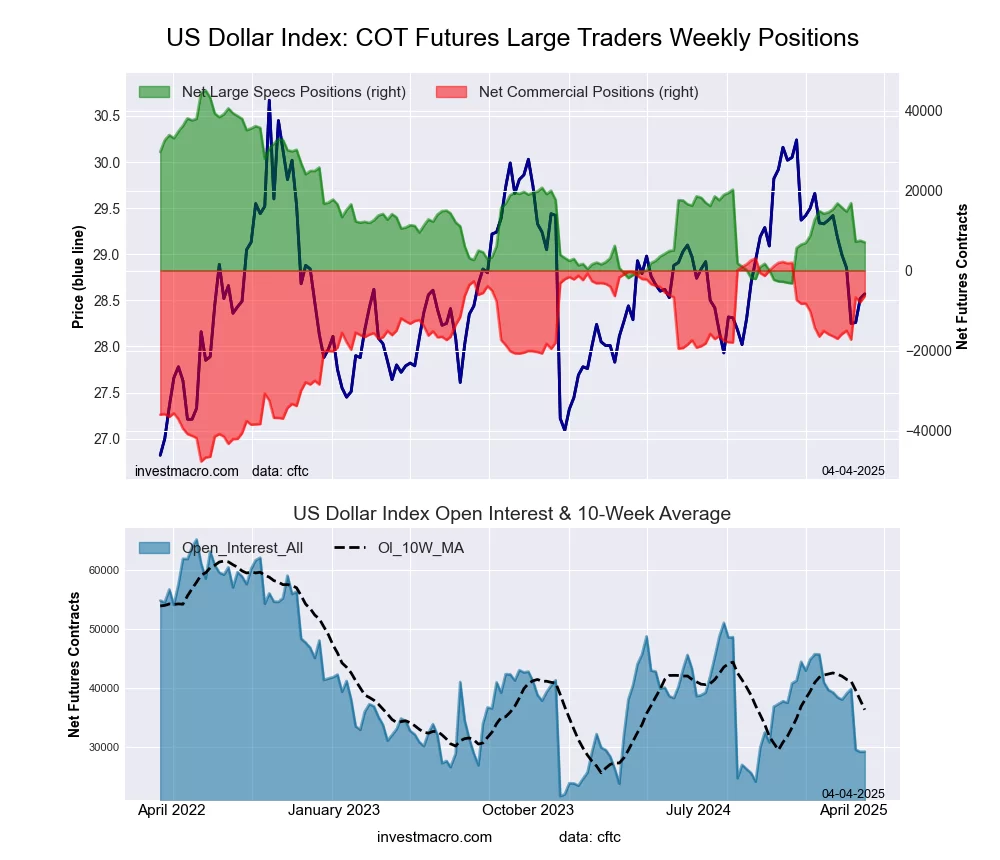
US Dollar Index Futures:
 The US Dollar Index large speculator standing this week equaled a net position of 7,468 contracts in the data reported through Tuesday. This was a weekly lift of 280 contracts from the previous week which had a total of 7,188 net contracts.
This week’s current strength score (the trader positioning range over the past three years, measured from 0 to 100) shows the speculators are currently Bearish with a score of 22.2 percent. The commercials are Bullish with a score of 78.4 percent and the small traders (not shown in chart) are Bearish with a score of 31.3 percent.
Price Trend-Following Model: Strong Downtrend
Our weekly trend-following model classifies the current market price position as: Strong Downtrend.
| US DOLLAR INDEX Statistics | SPECULATORS | COMMERCIALS | SMALL TRADERS |
| – Percent of Open Interest Longs: | 77.7 | 4.7 | 10.1 |
| – Percent of Open Interest Shorts: | 52.1 | 31.9 | 8.5 |
| – Net Position: | 7,468 | -7,945 | 477 |
| – Gross Longs: | 22,699 | 1,385 | 2,953 |
| – Gross Shorts: | 15,231 | 9,330 | 2,476 |
| – Long to Short Ratio: | 1.5 to 1 | 0.1 to 1 | 1.2 to 1 |
| NET POSITION TREND: | | | |
| – Strength Index Score (3 Year Range Pct): | 22.2 | 78.4 | 31.3 |
| – Strength Index Reading (3 Year Range): | Bearish | Bullish | Bearish |
| NET POSITION MOVEMENT INDEX: | | | |
| – 6-Week Change in Strength Index: | -16.2 | 16.7 | -7.5 |
Euro Currency Futures:
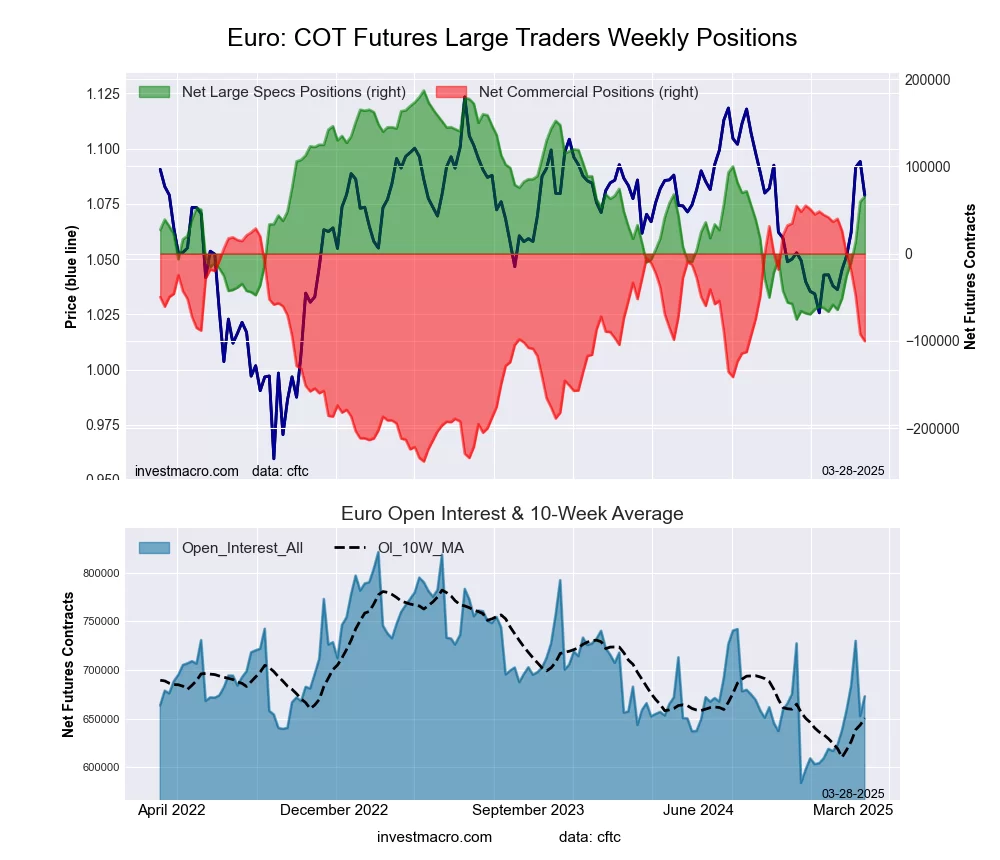 The Euro Currency large speculator standing this week equaled a net position of 65,525 contracts in the data reported through Tuesday. This was a weekly increase of 6,100 contracts from the previous week which had a total of 59,425 net contracts.
This week’s current strength score (the trader positioning range over the past three years, measured from 0 to 100) shows the speculators are currently Bullish with a score of 53.7 percent. The commercials are Bearish with a score of 47.0 percent and the small traders (not shown in chart) are Bullish with a score of 50.5 percent.
Price Trend-Following Model: Strong Uptrend
Our weekly trend-following model classifies the current market price position as: Strong Uptrend.
| EURO Currency Statistics | SPECULATORS | COMMERCIALS | SMALL TRADERS |
| – Percent of Open Interest Longs: | 28.2 | 55.8 | 12.1 |
| – Percent of Open Interest Shorts: | 18.5 | 70.8 | 7.0 |
| – Net Position: | 65,525 | -100,316 | 34,791 |
| – Gross Longs: | 189,796 | 375,753 | 81,743 |
| – Gross Shorts: | 124,271 | 476,069 | 46,952 |
| – Long to Short Ratio: | 1.5 to 1 | 0.8 to 1 | 1.7 to 1 |
| NET POSITION TREND: | | | |
| – Strength Index Score (3 Year Range Pct): | 53.7 | 47.0 | 50.5 |
| – Strength Index Reading (3 Year Range): | Bullish | Bearish | Bullish |
| NET POSITION MOVEMENT INDEX: | | | |
| – 6-Week Change in Strength Index: | 49.5 | -47.8 | 23.0 |
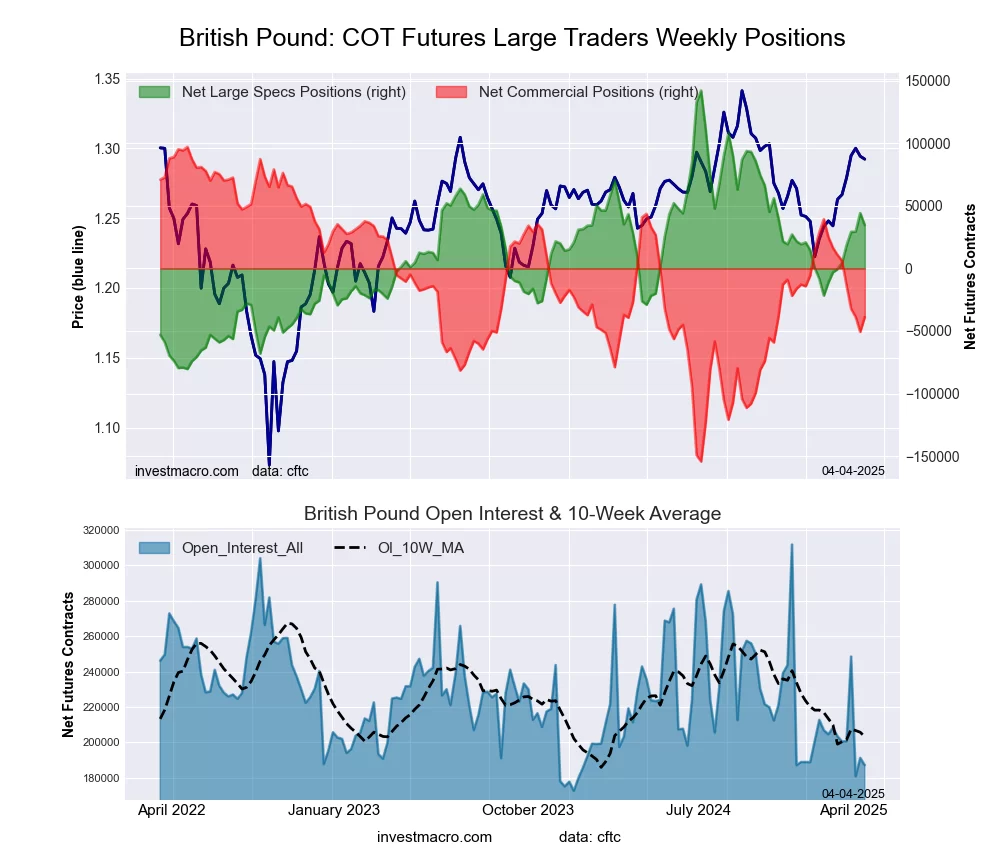
British Pound Sterling Futures:
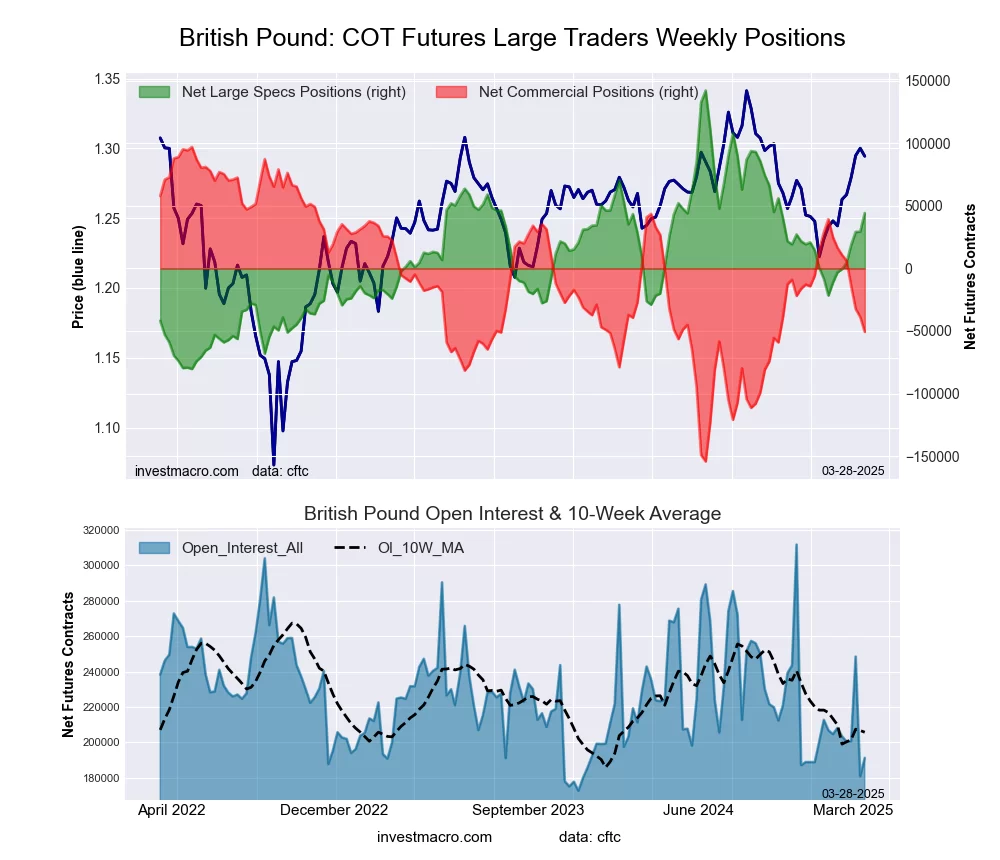 The British Pound Sterling large speculator standing this week equaled a net position of 44,283 contracts in the data reported through Tuesday. This was a weekly rise of 14,881 contracts from the previous week which had a total of 29,402 net contracts.
This week’s current strength score (the trader positioning range over the past three years, measured from 0 to 100) shows the speculators are currently Bullish with a score of 56.0 percent. The commercials are Bearish with a score of 41.2 percent and the small traders (not shown in chart) are Bullish with a score of 75.6 percent.
Price Trend-Following Model: Strong Uptrend
Our weekly trend-following model classifies the current market price position as: Strong Uptrend.
| BRITISH POUND Statistics | SPECULATORS | COMMERCIALS | SMALL TRADERS |
| – Percent of Open Interest Longs: | 57.0 | 25.5 | 16.9 |
| – Percent of Open Interest Shorts: | 33.9 | 52.0 | 13.5 |
| – Net Position: | 44,283 | -50,682 | 6,399 |
| – Gross Longs: | 109,016 | 48,843 | 32,226 |
| – Gross Shorts: | 64,733 | 99,525 | 25,827 |
| – Long to Short Ratio: | 1.7 to 1 | 0.5 to 1 | 1.2 to 1 |
| NET POSITION TREND: | | | |
| – Strength Index Score (3 Year Range Pct): | 56.0 | 41.2 | 75.6 |
| – Strength Index Reading (3 Year Range): | Bullish | Bearish | Bullish |
| NET POSITION MOVEMENT INDEX: | | | |
| – 6-Week Change in Strength Index: | 21.3 | -26.7 | 41.4 |
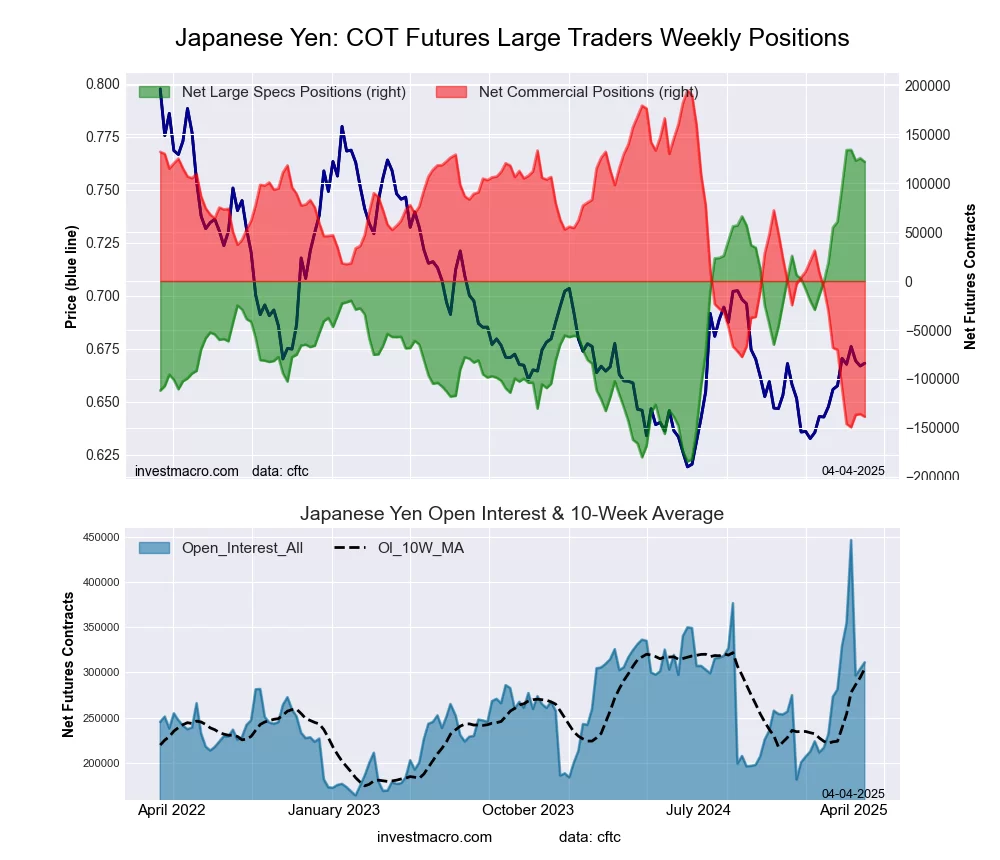
Japanese Yen Futures:
 The Japanese Yen large speculator standing this week equaled a net position of 125,376 contracts in the data reported through Tuesday. This was a weekly rise of 2,412 contracts from the previous week which had a total of 122,964 net contracts.
This week’s current strength score (the trader positioning range over the past three years, measured from 0 to 100) shows the speculators are currently Bullish-Extreme with a score of 97.3 percent. The commercials are Bearish-Extreme with a score of 3.9 percent and the small traders (not shown in chart) are Bullish-Extreme with a score of 86.8 percent.
Price Trend-Following Model: Strong Uptrend
Our weekly trend-following model classifies the current market price position as: Strong Uptrend.
| JAPANESE YEN Statistics | SPECULATORS | COMMERCIALS | SMALL TRADERS |
| – Percent of Open Interest Longs: | 52.8 | 30.6 | 14.8 |
| – Percent of Open Interest Shorts: | 11.6 | 75.3 | 11.4 |
| – Net Position: | 125,376 | -135,740 | 10,364 |
| – Gross Longs: | 160,474 | 92,999 | 44,965 |
| – Gross Shorts: | 35,098 | 228,739 | 34,601 |
| – Long to Short Ratio: | 4.6 to 1 | 0.4 to 1 | 1.3 to 1 |
| NET POSITION TREND: | | | |
| – Strength Index Score (3 Year Range Pct): | 97.3 | 3.9 | 86.8 |
| – Strength Index Reading (3 Year Range): | Bullish-Extreme | Bearish-Extreme | Bullish-Extreme |
| NET POSITION MOVEMENT INDEX: | | | |
| – 6-Week Change in Strength Index: | 22.2 | -19.7 | -8.4 |
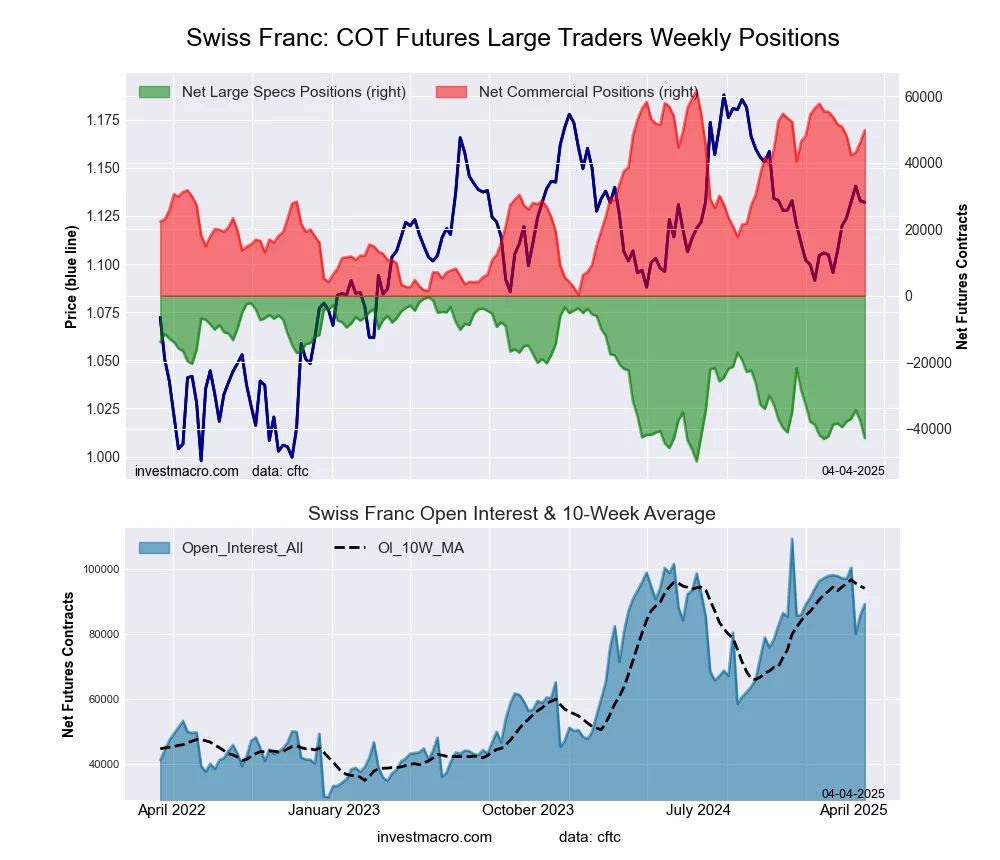
Swiss Franc Futures:
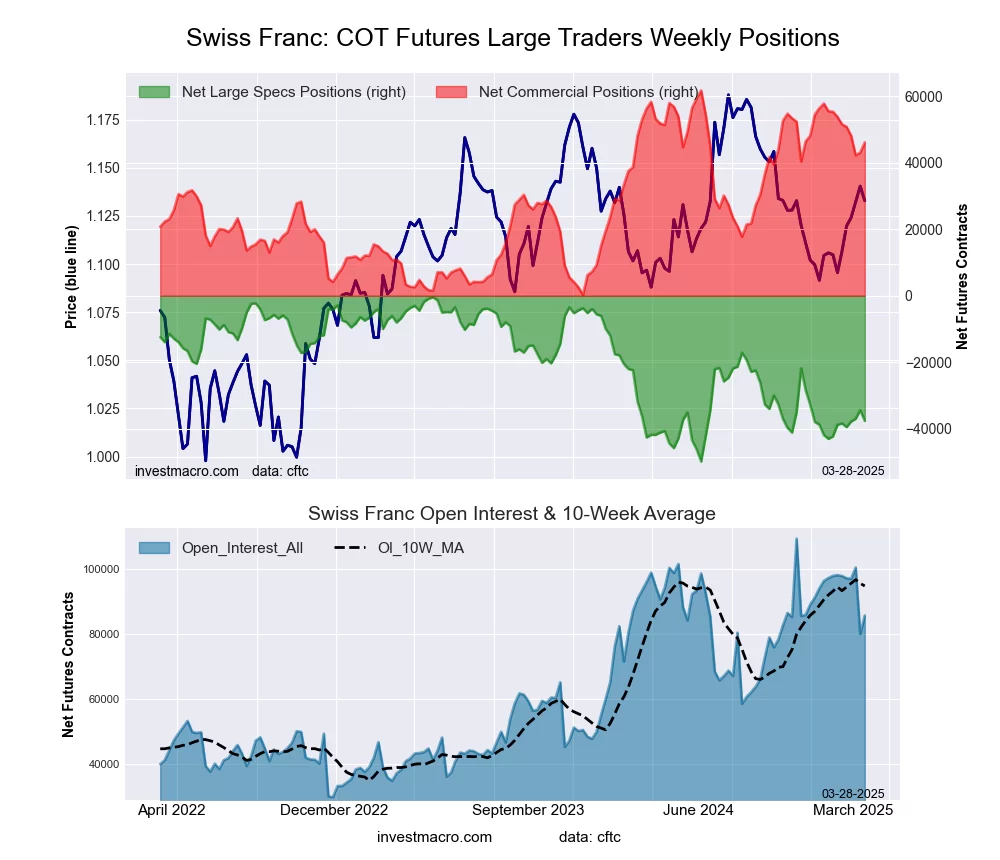 The Swiss Franc large speculator standing this week equaled a net position of -37,593 contracts in the data reported through Tuesday. This was a weekly reduction of -3,218 contracts from the previous week which had a total of -34,375 net contracts.
This week’s current strength score (the trader positioning range over the past three years, measured from 0 to 100) shows the speculators are currently Bearish with a score of 24.7 percent. The commercials are Bullish with a score of 74.6 percent and the small traders (not shown in chart) are Bearish with a score of 42.7 percent.
Price Trend-Following Model: Weak Downtrend
Our weekly trend-following model classifies the current market price position as: Weak Downtrend.
| SWISS FRANC Statistics | SPECULATORS | COMMERCIALS | SMALL TRADERS |
| – Percent of Open Interest Longs: | 4.9 | 82.6 | 12.3 |
| – Percent of Open Interest Shorts: | 48.7 | 28.8 | 22.2 |
| – Net Position: | -37,593 | 46,102 | -8,509 |
| – Gross Longs: | 4,178 | 70,830 | 10,519 |
| – Gross Shorts: | 41,771 | 24,728 | 19,028 |
| – Long to Short Ratio: | 0.1 to 1 | 2.9 to 1 | 0.6 to 1 |
| NET POSITION TREND: | | | |
| – Strength Index Score (3 Year Range Pct): | 24.7 | 74.6 | 42.7 |
| – Strength Index Reading (3 Year Range): | Bearish | Bullish | Bearish |
| NET POSITION MOVEMENT INDEX: | | | |
| – 6-Week Change in Strength Index: | 2.3 | -12.5 | 27.6 |
Canadian Dollar Futures:
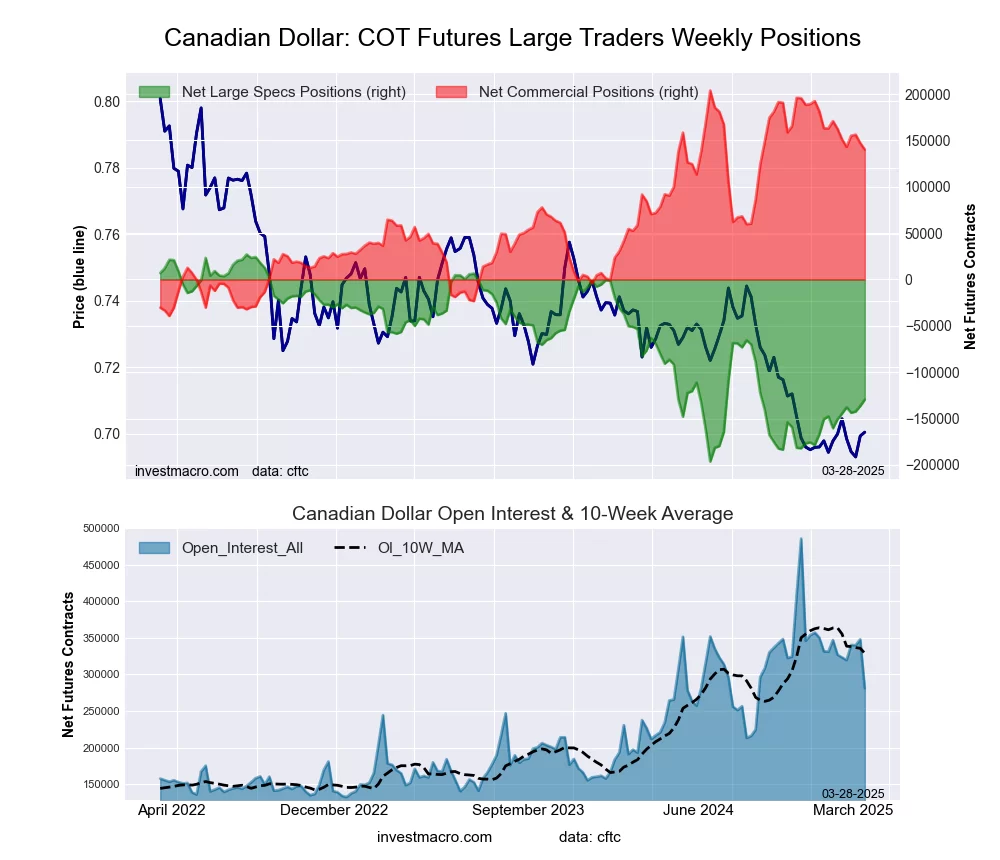 The Canadian Dollar large speculator standing this week equaled a net position of -129,534 contracts in the data reported through Tuesday. This was a weekly gain of 7,048 contracts from the previous week which had a total of -136,582 net contracts.
This week’s current strength score (the trader positioning range over the past three years, measured from 0 to 100) shows the speculators are currently Bearish with a score of 29.9 percent. The commercials are Bullish with a score of 73.8 percent and the small traders (not shown in chart) are Bearish-Extreme with a score of 12.1 percent.
Price Trend-Following Model: Downtrend
Our weekly trend-following model classifies the current market price position as: Downtrend.
| CANADIAN DOLLAR Statistics | SPECULATORS | COMMERCIALS | SMALL TRADERS |
| – Percent of Open Interest Longs: | 6.4 | 83.5 | 8.8 |
| – Percent of Open Interest Shorts: | 52.5 | 33.6 | 12.5 |
| – Net Position: | -129,534 | 140,196 | -10,662 |
| – Gross Longs: | 17,948 | 234,774 | 24,617 |
| – Gross Shorts: | 147,482 | 94,578 | 35,279 |
| – Long to Short Ratio: | 0.1 to 1 | 2.5 to 1 | 0.7 to 1 |
| NET POSITION TREND: | | | |
| – Strength Index Score (3 Year Range Pct): | 29.9 | 73.8 | 12.1 |
| – Strength Index Reading (3 Year Range): | Bearish | Bullish | Bearish-Extreme |
| NET POSITION MOVEMENT INDEX: | | | |
| – 6-Week Change in Strength Index: | 9.5 | -9.2 | 2.8 |
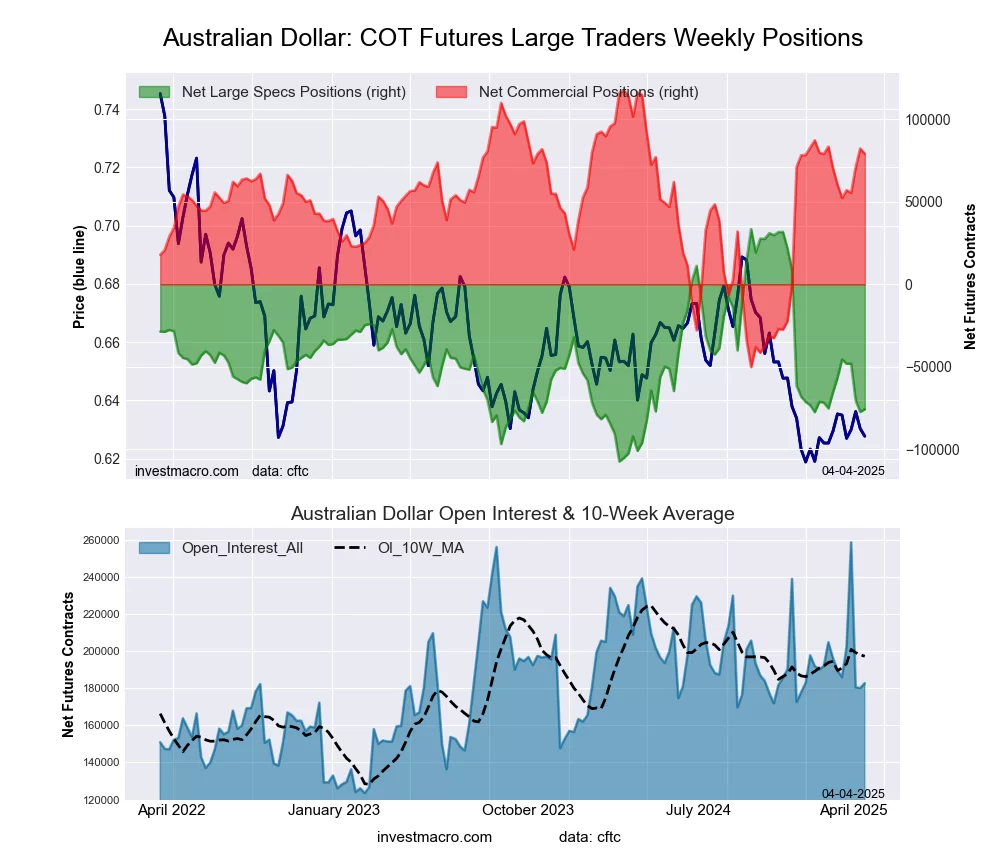
Australian Dollar Futures:
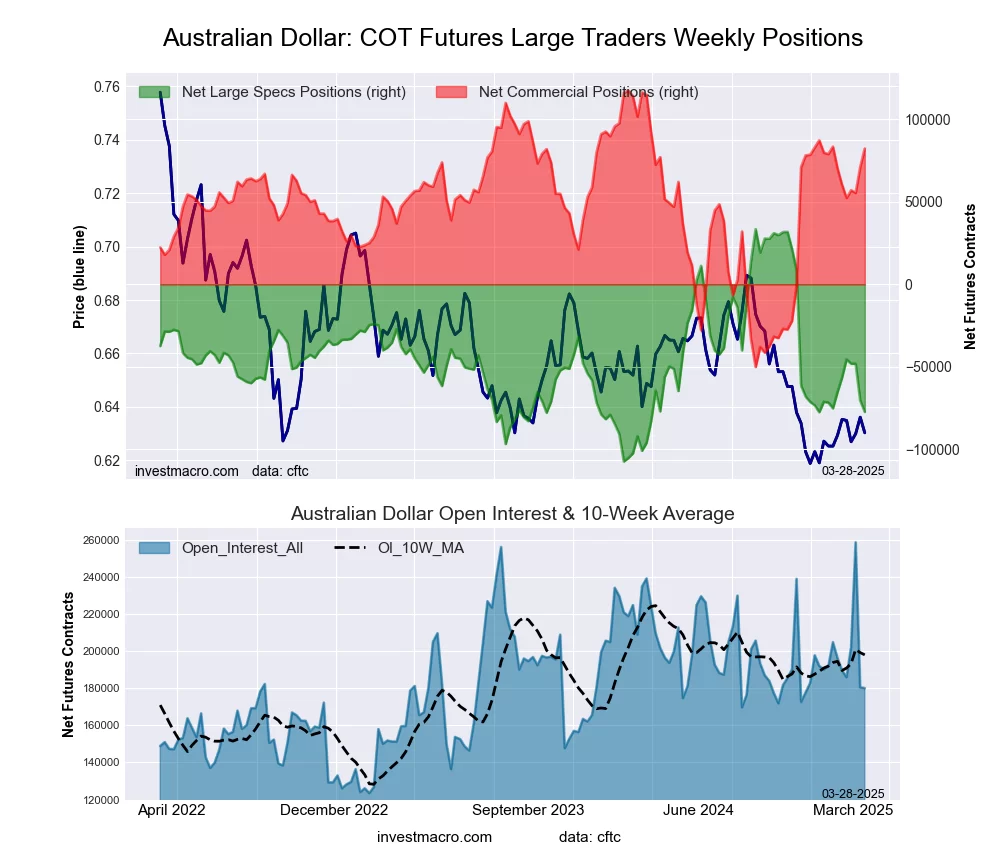 The Australian Dollar large speculator standing this week equaled a net position of -77,446 contracts in the data reported through Tuesday. This was a weekly reduction of -6,997 contracts from the previous week which had a total of -70,449 net contracts.
This week’s current strength score (the trader positioning range over the past three years, measured from 0 to 100) shows the speculators are currently Bearish with a score of 21.3 percent. The commercials are Bullish with a score of 79.0 percent and the small traders (not shown in chart) are Bearish with a score of 36.2 percent.
Price Trend-Following Model: Downtrend
Our weekly trend-following model classifies the current market price position as: Downtrend.
| AUSTRALIAN DOLLAR Statistics | SPECULATORS | COMMERCIALS | SMALL TRADERS |
| – Percent of Open Interest Longs: | 15.6 | 66.3 | 12.9 |
| – Percent of Open Interest Shorts: | 58.6 | 20.6 | 15.7 |
| – Net Position: | -77,446 | 82,329 | -4,883 |
| – Gross Longs: | 28,124 | 119,381 | 23,317 |
| – Gross Shorts: | 105,570 | 37,052 | 28,200 |
| – Long to Short Ratio: | 0.3 to 1 | 3.2 to 1 | 0.8 to 1 |
| NET POSITION TREND: | | | |
| – Strength Index Score (3 Year Range Pct): | 21.3 | 79.0 | 36.2 |
| – Strength Index Reading (3 Year Range): | Bearish | Bullish | Bearish |
| NET POSITION MOVEMENT INDEX: | | | |
| – 6-Week Change in Strength Index: | -8.4 | 7.1 | -0.1 |
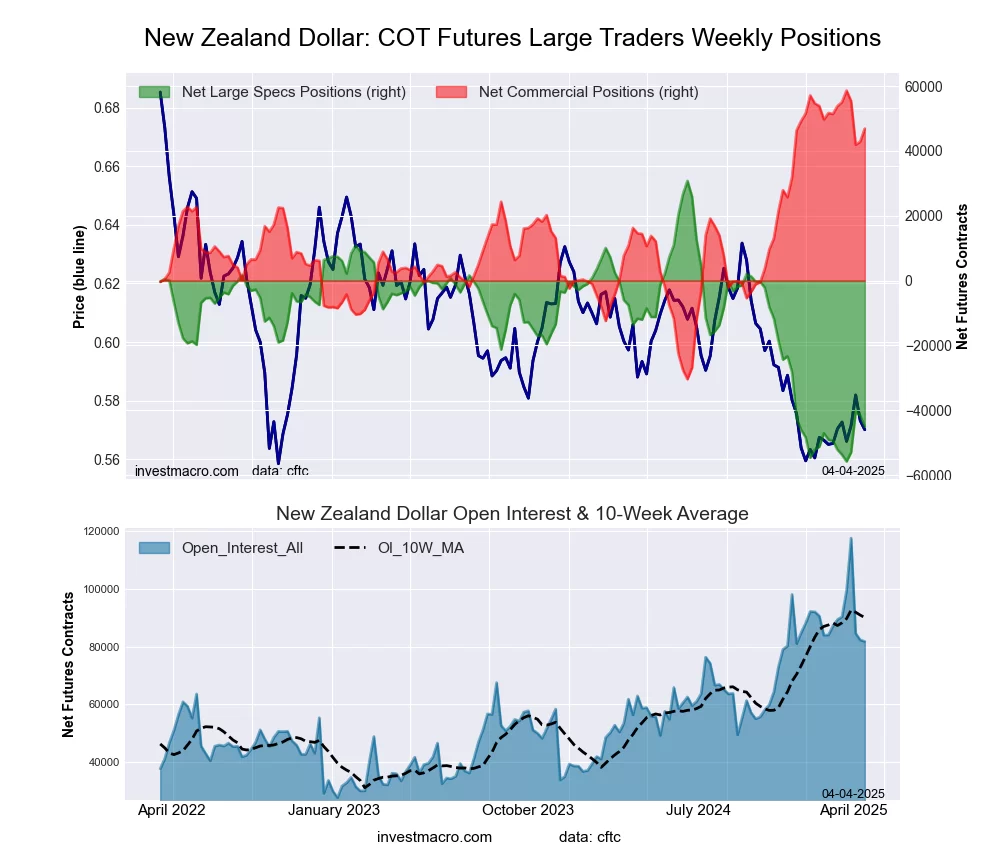
New Zealand Dollar Futures:
 The New Zealand Dollar large speculator standing this week equaled a net position of -41,567 contracts in the data reported through Tuesday. This was a weekly reduction of -1,123 contracts from the previous week which had a total of -40,444 net contracts.
This week’s current strength score (the trader positioning range over the past three years, measured from 0 to 100) shows the speculators are currently Bearish-Extreme with a score of 16.4 percent. The commercials are Bullish-Extreme with a score of 82.3 percent and the small traders (not shown in chart) are Bearish with a score of 36.9 percent.
Price Trend-Following Model: Weak Downtrend
Our weekly trend-following model classifies the current market price position as: Weak Downtrend.
| NEW ZEALAND DOLLAR Statistics | SPECULATORS | COMMERCIALS | SMALL TRADERS |
| – Percent of Open Interest Longs: | 16.3 | 78.5 | 5.0 |
| – Percent of Open Interest Shorts: | 66.9 | 26.4 | 6.5 |
| – Net Position: | -41,567 | 42,865 | -1,298 |
| – Gross Longs: | 13,435 | 64,617 | 4,082 |
| – Gross Shorts: | 55,002 | 21,752 | 5,380 |
| – Long to Short Ratio: | 0.2 to 1 | 3.0 to 1 | 0.8 to 1 |
| NET POSITION TREND: | | | |
| – Strength Index Score (3 Year Range Pct): | 16.4 | 82.3 | 36.9 |
| – Strength Index Reading (3 Year Range): | Bearish-Extreme | Bullish-Extreme | Bearish |
| NET POSITION MOVEMENT INDEX: | | | |
| – 6-Week Change in Strength Index: | 9.0 | -9.6 | 9.7 |
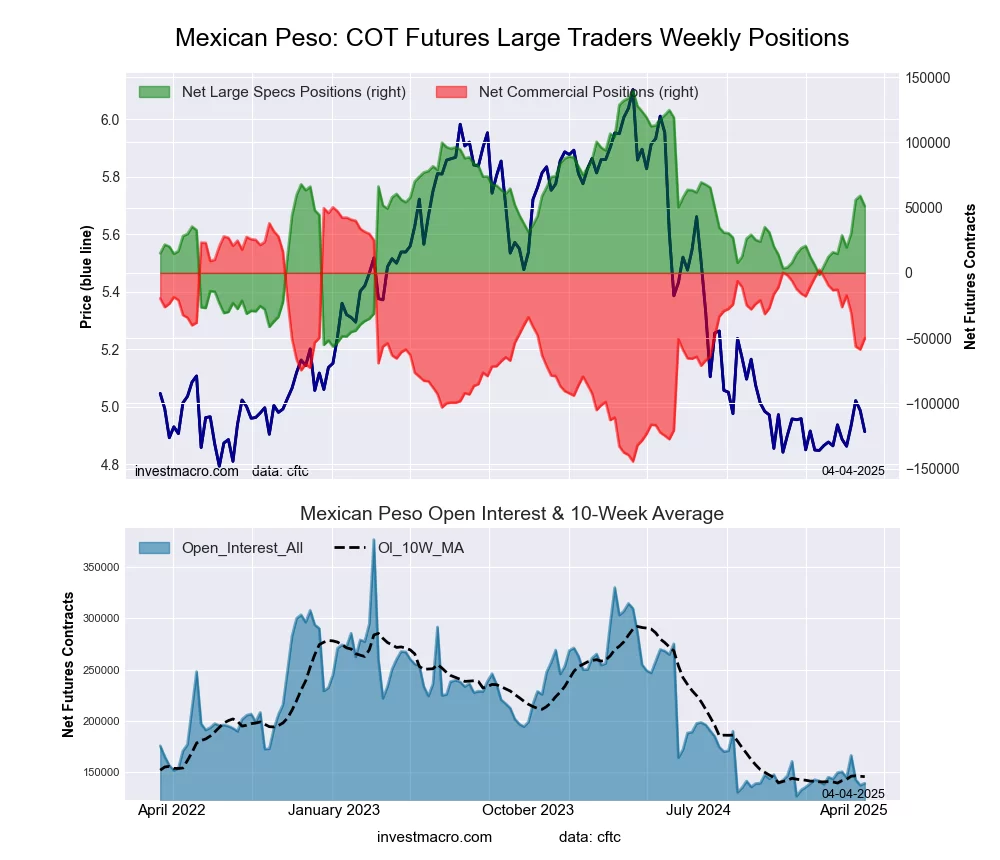
Mexican Peso Futures:
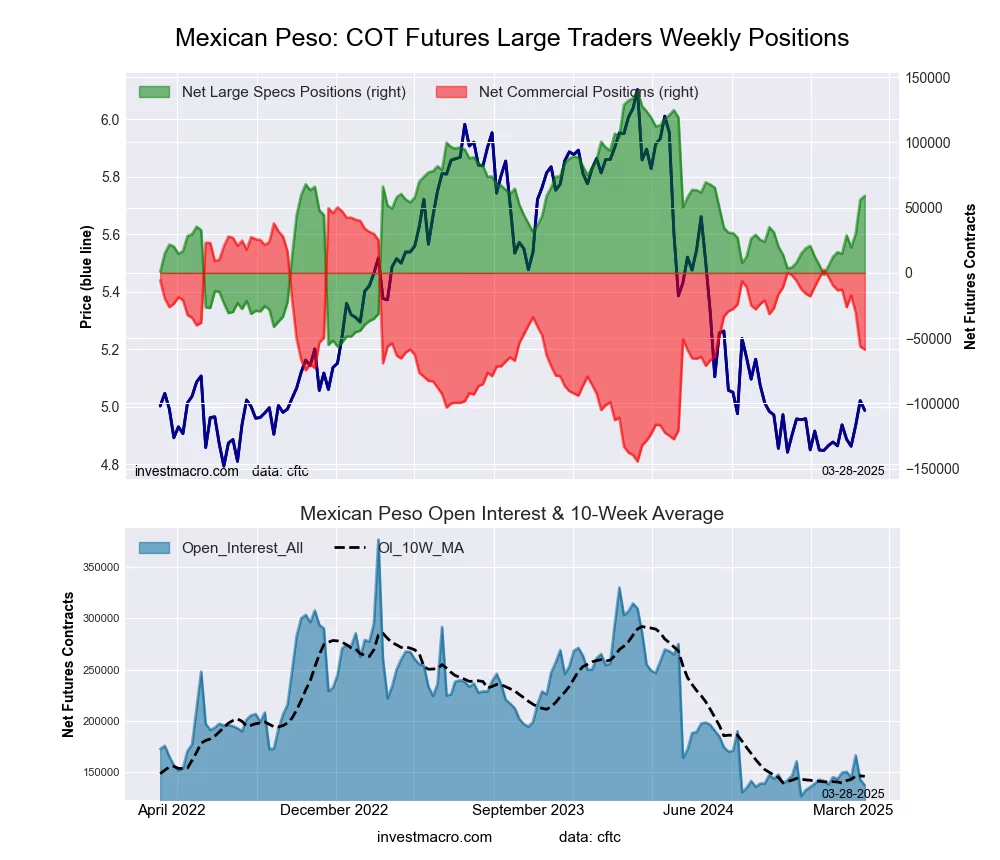 The Mexican Peso large speculator standing this week equaled a net position of 59,039 contracts in the data reported through Tuesday. This was a weekly increase of 3,087 contracts from the previous week which had a total of 55,952 net contracts.
This week’s current strength score (the trader positioning range over the past three years, measured from 0 to 100) shows the speculators are currently Bullish with a score of 58.9 percent. The commercials are Bearish with a score of 44.0 percent and the small traders (not shown in chart) are Bearish with a score of 20.8 percent.
Price Trend-Following Model: Uptrend
Our weekly trend-following model classifies the current market price position as: Uptrend.
| MEXICAN PESO Statistics | SPECULATORS | COMMERCIALS | SMALL TRADERS |
| – Percent of Open Interest Longs: | 65.1 | 28.0 | 3.2 |
| – Percent of Open Interest Shorts: | 22.1 | 70.7 | 3.4 |
| – Net Position: | 59,039 | -58,694 | -345 |
| – Gross Longs: | 89,477 | 38,556 | 4,376 |
| – Gross Shorts: | 30,438 | 97,250 | 4,721 |
| – Long to Short Ratio: | 2.9 to 1 | 0.4 to 1 | 0.9 to 1 |
| NET POSITION TREND: | | | |
| – Strength Index Score (3 Year Range Pct): | 58.9 | 44.0 | 20.8 |
| – Strength Index Reading (3 Year Range): | Bullish | Bearish | Bearish |
| NET POSITION MOVEMENT INDEX: | | | |
| – 6-Week Change in Strength Index: | 22.0 | -23.3 | 12.4 |
Brazilian Real Futures:
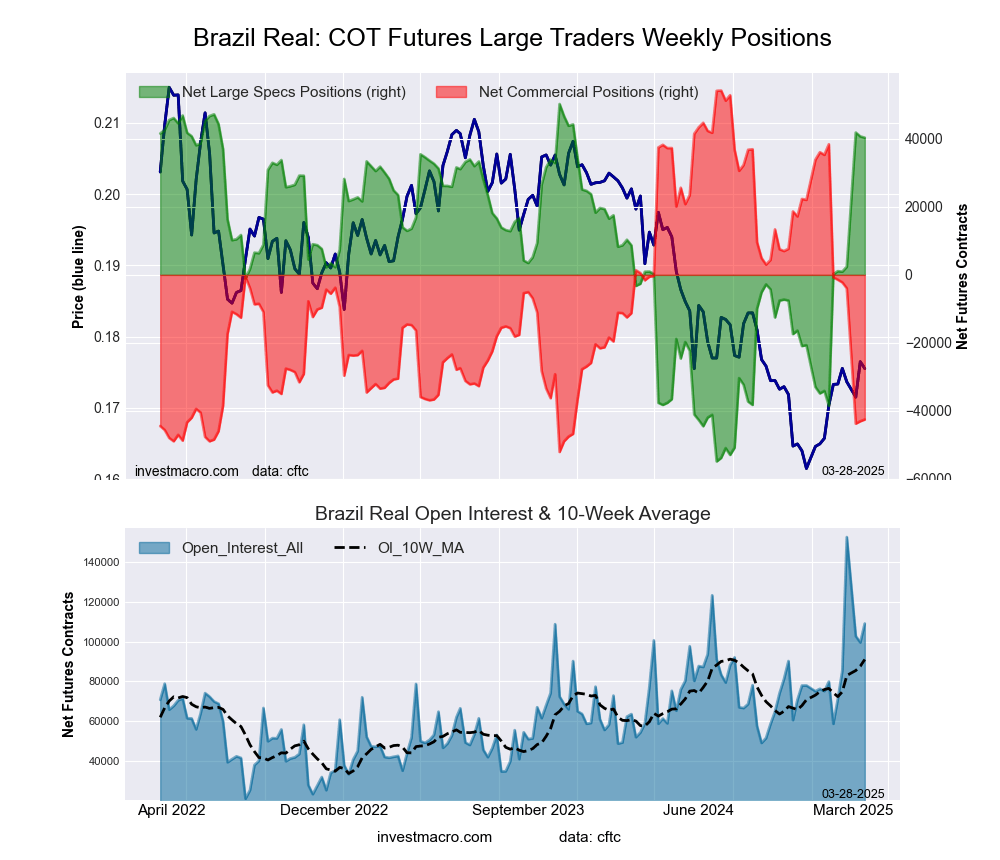 The Brazilian Real large speculator standing this week equaled a net position of 40,349 contracts in the data reported through Tuesday. This was a weekly decrease of -372 contracts from the previous week which had a total of 40,721 net contracts.
This week’s current strength score (the trader positioning range over the past three years, measured from 0 to 100) shows the speculators are currently Bullish-Extreme with a score of 90.6 percent. The commercials are Bearish-Extreme with a score of 9.0 percent and the small traders (not shown in chart) are Bearish with a score of 33.3 percent.
Price Trend-Following Model: Strong Uptrend
Our weekly trend-following model classifies the current market price position as: Strong Uptrend.
| BRAZIL REAL Statistics | SPECULATORS | COMMERCIALS | SMALL TRADERS |
| – Percent of Open Interest Longs: | 64.2 | 27.0 | 3.3 |
| – Percent of Open Interest Shorts: | 27.2 | 66.0 | 1.2 |
| – Net Position: | 40,349 | -42,553 | 2,204 |
| – Gross Longs: | 70,030 | 29,411 | 3,556 |
| – Gross Shorts: | 29,681 | 71,964 | 1,352 |
| – Long to Short Ratio: | 2.4 to 1 | 0.4 to 1 | 2.6 to 1 |
| NET POSITION TREND: | | | |
| – Strength Index Score (3 Year Range Pct): | 90.6 | 9.0 | 33.3 |
| – Strength Index Reading (3 Year Range): | Bullish-Extreme | Bearish-Extreme | Bearish |
| NET POSITION MOVEMENT INDEX: | | | |
| – 6-Week Change in Strength Index: | 37.4 | -38.7 | 10.4 |
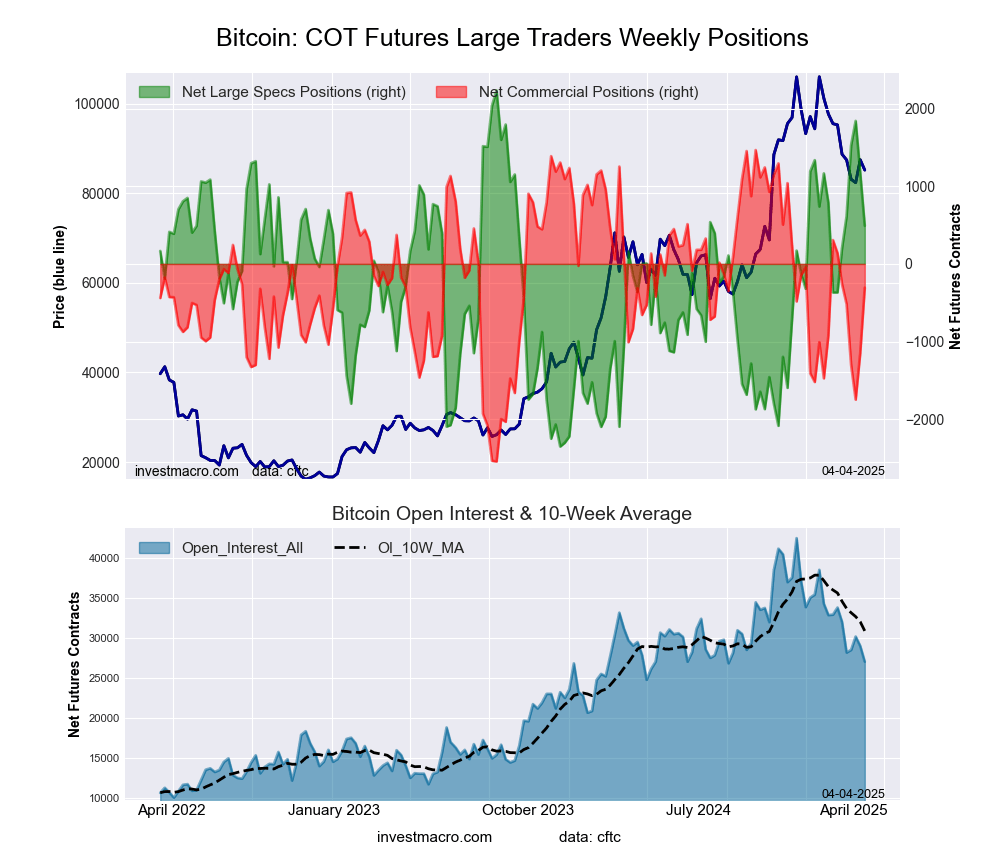
Bitcoin Futures:
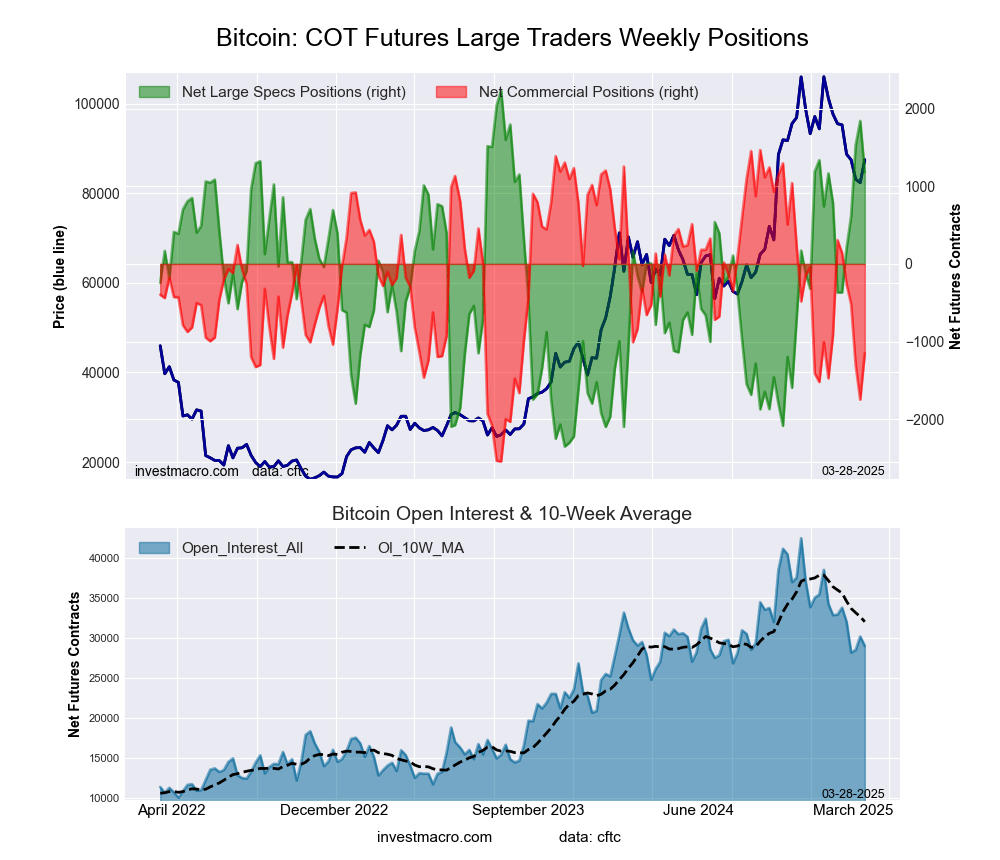 The Bitcoin large speculator standing this week equaled a net position of 1,179 contracts in the data reported through Tuesday. This was a weekly reduction of -662 contracts from the previous week which had a total of 1,841 net contracts.
This week’s current strength score (the trader positioning range over the past three years, measured from 0 to 100) shows the speculators are currently Bullish with a score of 77.0 percent. The commercials are Bearish with a score of 34.7 percent and the small traders (not shown in chart) are Bearish-Extreme with a score of 13.8 percent.
Price Trend-Following Model: Strong Downtrend
Our weekly trend-following model classifies the current market price position as: Strong Downtrend.
| BITCOIN Statistics | SPECULATORS | COMMERCIALS | SMALL TRADERS |
| – Percent of Open Interest Longs: | 84.0 | 3.3 | 4.2 |
| – Percent of Open Interest Shorts: | 79.9 | 7.2 | 4.3 |
| – Net Position: | 1,179 | -1,150 | -29 |
| – Gross Longs: | 24,376 | 945 | 1,207 |
| – Gross Shorts: | 23,197 | 2,095 | 1,236 |
| – Long to Short Ratio: | 1.1 to 1 | 0.5 to 1 | 1.0 to 1 |
| NET POSITION TREND: | | | |
| – Strength Index Score (3 Year Range Pct): | 77.0 | 34.7 | 13.8 |
| – Strength Index Reading (3 Year Range): | Bullish | Bearish | Bearish-Extreme |
| NET POSITION MOVEMENT INDEX: | | | |
| – 6-Week Change in Strength Index: | 33.7 | -36.3 | -6.2 |
Article By InvestMacro – Receive our weekly COT Newsletter
*COT Report: The COT data, released weekly to the public each Friday, is updated through the most recent Tuesday (data is 3 days old) and shows a quick view of how large speculators or non-commercials (for-profit traders) were positioned in the futures markets.
The CFTC categorizes trader positions according to commercial hedgers (traders who use futures contracts for hedging as part of the business), non-commercials (large traders who speculate to realize trading profits) and nonreportable traders (usually small traders/speculators) as well as their open interest (contracts open in the market at time of reporting). See CFTC criteria here.