by JustForex
The EUR/USD currency pair
- Prev Open: 1.1285
- Prev Close: 1.1233
- % chg. over the last day: -0.46%
Inflationary expectations are rising again in Germany. The Bundesbank predicts a jump in inflation to a level close to 6%. The euro continues to decline against the dollar after Powell’s reappointment. With the ECB planning to start cutting back its stimulus program only next March, the Euro will continue to decline against the dollar in the medium term.
- Support levels: 1.1256, 1.1168
- Resistance levels: 1.1386, 1.1436, 1.1535, 1.1613, 1.1667, 1.1717
From a technical point of view, the EUR/USD is bearish on the hour time frame. The Euro continues to show weakness. The MACD indicator has become negative again, but there are signs of divergence at several time frames, so traders should expect a technical rebound. Under such market conditions, traders should consider sell positions from the resistance levels near the moving average since the price has deviated strongly from the averages. Buy trades should be considered only from the support levels of the higher time frame, given the buyers’ initiative, but only with short targets.
Alternative scenario: if the price breaks out through the 1.1386 resistance level and fixes above, the mid-term uptrend will likely resume.

- – Germany Manufacturing PMI (m/m) at 10:30 (GMT+2);
- – Germany Services PMI (m/m) at 10:30 (GMT+2);
- – Eurozone Manufacturing PMI (m/m) at 11:00 (GMT+2);
- – Eurozone Services PMI (m/m) at 11:00 (GMT+2).
The GBP/USD currency pair
- Prev Open: 1.3445
- Prev Close: 1.3394
- % chg. over the last day: -0.38%
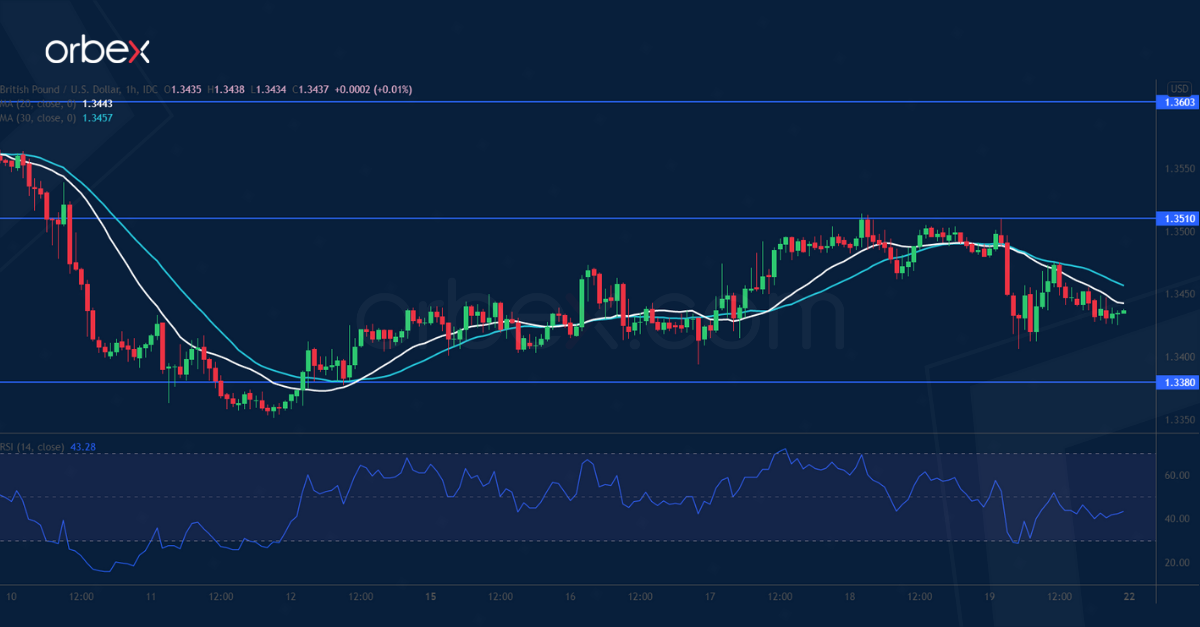
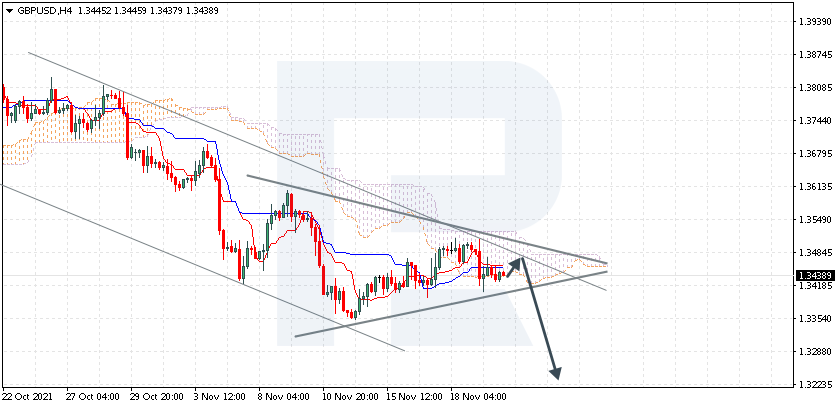
Traders are increasingly negative on the pound, betting that the decline will continue, which has already brought the currency close to its lowest level this year. The strength of the dollar, Brexit, and doubts in the decisiveness of the Bank of England are putting pressure on the currency.
- Support levels: 1.3360
- Resistance levels: 1.3434, 1.3507, 1.3575, 1.3685, 1.3748
On the hourly time frame, the trend on GBP/USD is bearish. The MACD indicator has become negative, sellers’ pressure intensified. Under such market conditions, traders should consider sell positions from the resistance level near the moving average. Buy trades should be considered only from the support levels of the higher time frame, given the buyers’ initiative.
Alternative scenario: if the price breaks out through the 1.3507 resistance level and consolidates above, the bullish scenario will likely resume.

- – UK Manufacturing PMI (m/m) at 11:30 (GMT+2);
- – UK Services PMI (m/m) at 11:30 (GMT+2).
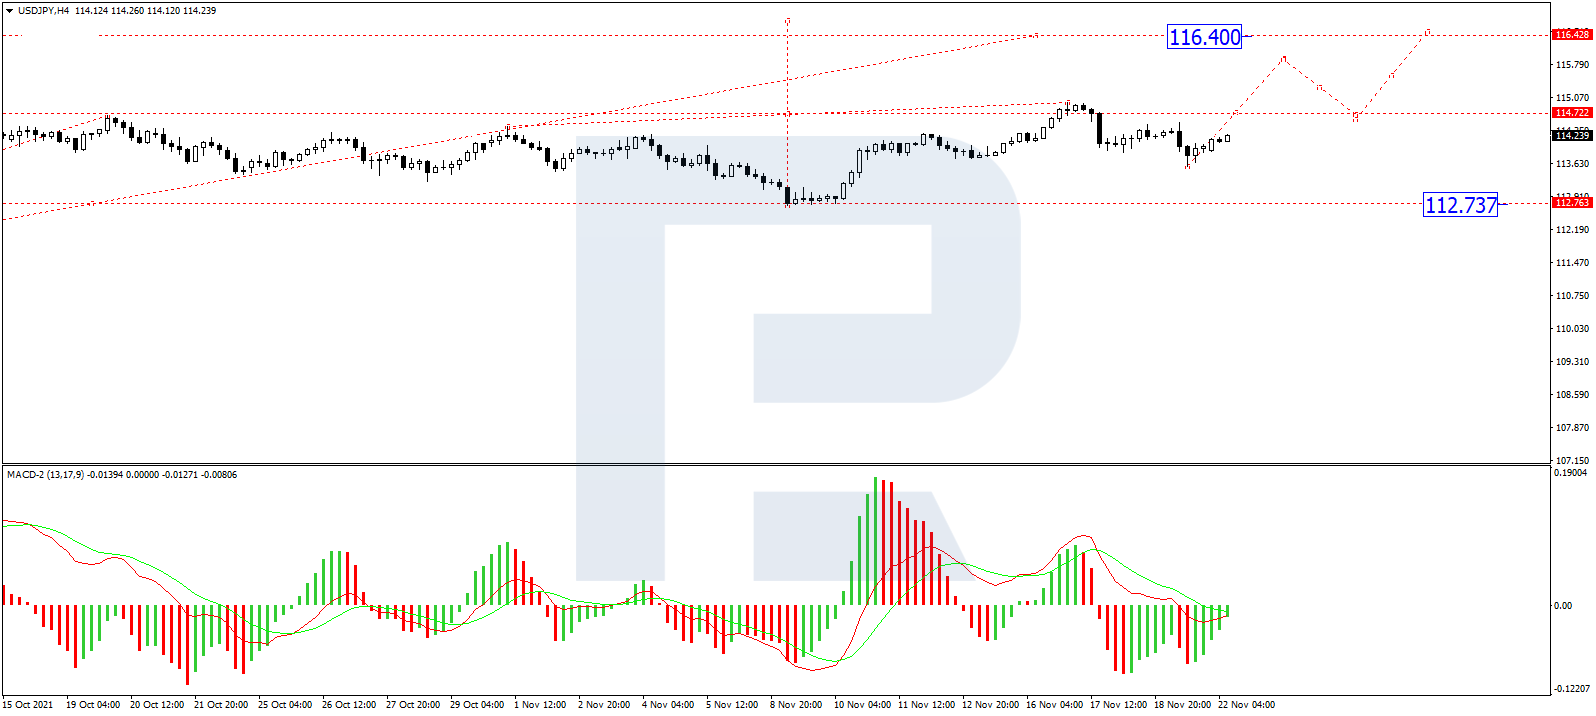
The USD/JPY currency pair
- Prev Open: 114.03
- Prev Close: 114.86
- % chg. over the last day: +0.73%
Today, it’s a bank holiday in Japan, so the Japanese Yen will be fully correlated with the dollar index. Yesterday, the USD/JPY quotes jumped sharply due to the strengthening of the dollar index. Fundamentally, the Japanese Yen will continue to decline against the USD.
- Support levels: 114.38, 113.79, 113.32, 112.87, 112.30
- Resistance levels: 115.15, 115.50
The global trend on the USD/JPY currency pair is bullish. Yesterday, the quotes jumped sharply, forming below the buyers’ initiative zones. The MACD indicator is positive, but there are the first signs of divergence. Under such market conditions, it’s better to look for buy positions from the buyers’ initiative zone near the moving average. Sell positions should be considered from the resistance levels of higher time frames, given there is sellers’ initiative, but only with short targets.
Alternative scenario: if the price falls below 113.79, the uptrend will likely be broken.

The USD/CAD currency pair
- Prev Open: 1.2639
- Prev Close: 1.2699
- % chg. over the last day: +0.47%
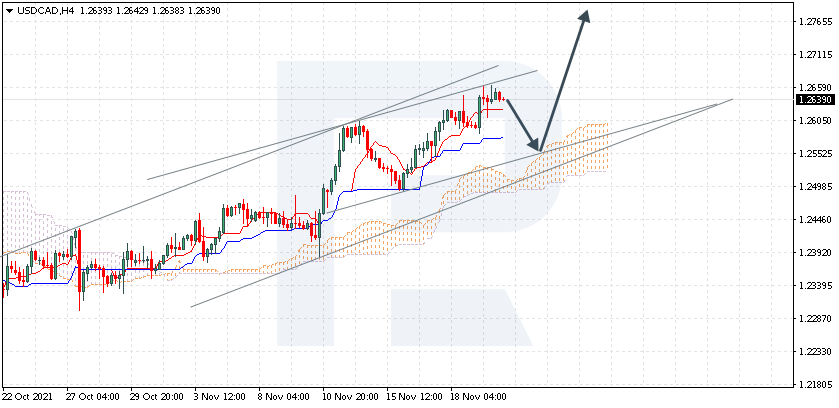
The Canadian dollar is a commodity currency, so the USD/CAD currency pair highly depends on the dollar index dynamics and oil prices. Yesterday, the dollar index increased sharply on the news of the Fed governor reappointment, while oil quotes decreased on possible oil reserves released by the USA, Japan, and India. As a result, the USD/CAD currency pair increased due to the strengthening US dollar.
- Support levels: 1.2646, 1.2598, 1.2571, 1.2483, 1.2416, 1.2388
- Resistance levels: 1.2729
From a technical point of view, the trend of the USD/CAD currency is bullish. The MACD indicator is in the positive zone, but there are signs of divergence on several time frames, which indicates the weakness of the buyers. Under such market conditions, it is better to look for buy trades from the support levels near the moving average, as the price has strongly deviated from the average values. Sell deals should be considered from the resistance levels of the higher time frames.
Alternative scenario: if the price breaks down through the 1.2571 support level and fixes below, the downtrend will likely resume.

by JustForex
This article reflects a personal opinion and should not be interpreted as an investment advice, and/or offer, and/or a persistent request for carrying out financial transactions, and/or a guarantee, and/or a forecast of future events.