
By InvestMacro | COT | Data Tables | COT Leaders | Downloads | COT Newsletter
Here are the latest charts and statistics for the Commitment of Traders (COT) data published by the Commodities Futures Trading Commission (CFTC).
The latest COT data is updated through Tuesday November 16th 2021 and shows a quick view of how large traders (for-profit speculators and commercial entities) were positioned in the futures markets. All currency positions are in direct relation to the US dollar where, for example, a bet for the euro is a bet that the euro will rise versus the dollar while a bet against the euro will be a bet that the euro will decline versus the dollar.
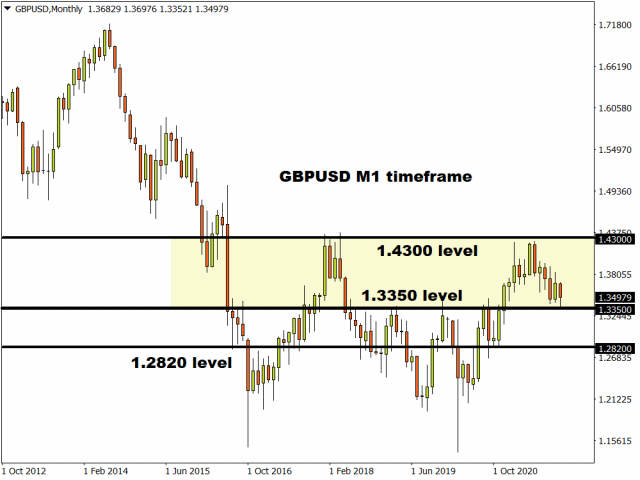
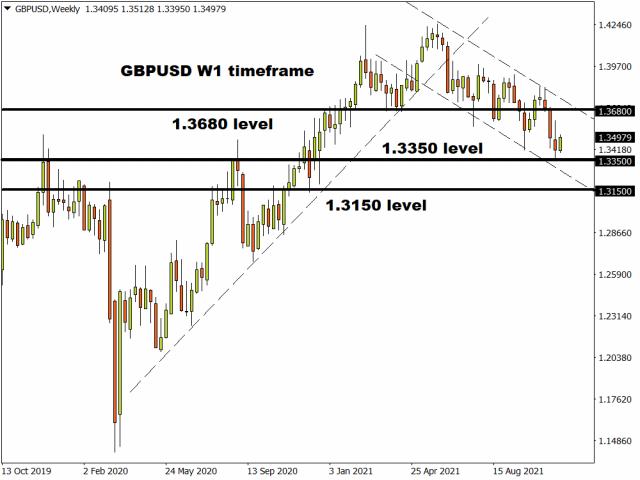
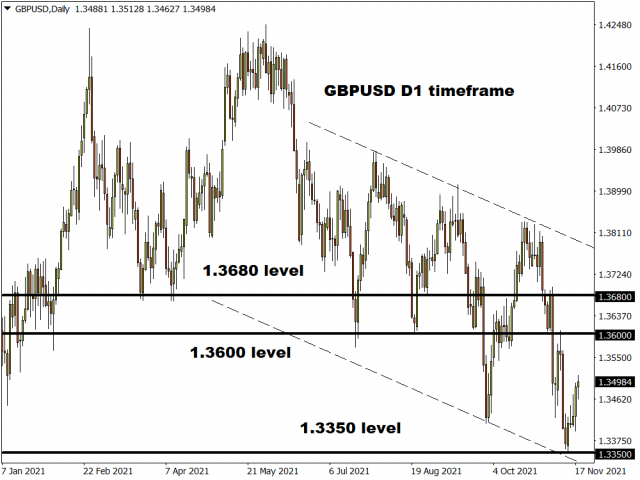
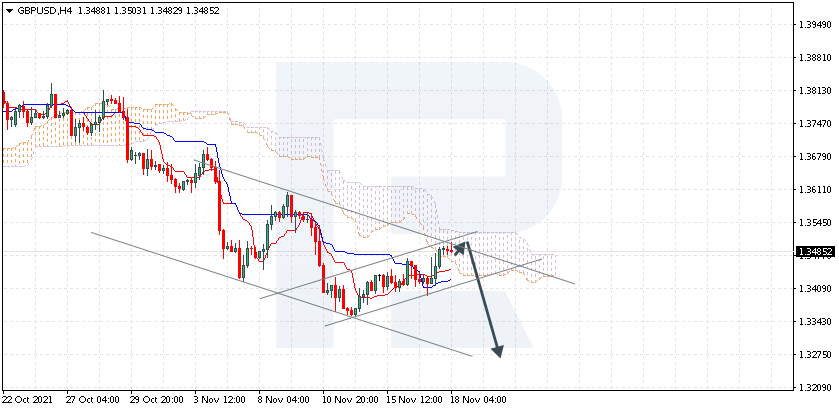
Highlighting the COT Currency data this week is the second straight decline in British pound sterling speculative positions. The pound sterling speculator contracts dropped sharply for the second consecutive week this week and have now fallen by a total of -46,646 contracts over just this two-week time period. These declines have pushed the overall speculative position into a bearish sentiment level of -31,599 contracts which marks the lowest standing of the past seventy-six weeks, dating back to June 2nd of 2020. The GBPUSD currency pair has been under pressure since the middle of October and fallen from around 1.3800 exchange rate to just above the 1.3435 level currently, a drop of almost 400 pips.
| Nov-16-2021 | OI | OI-Index | Spec-Net | Spec-Index | Com-Net | COM-Index | Smalls-Net | Smalls-Index |
|---|---|---|---|---|---|---|---|---|
| USD Index | 59,387 | 88 | 34,908 | 86 | -40,455 | 7 | 5,547 | 77 |
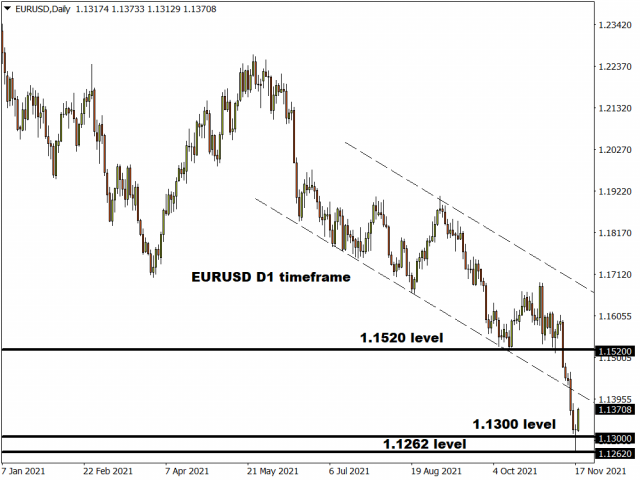
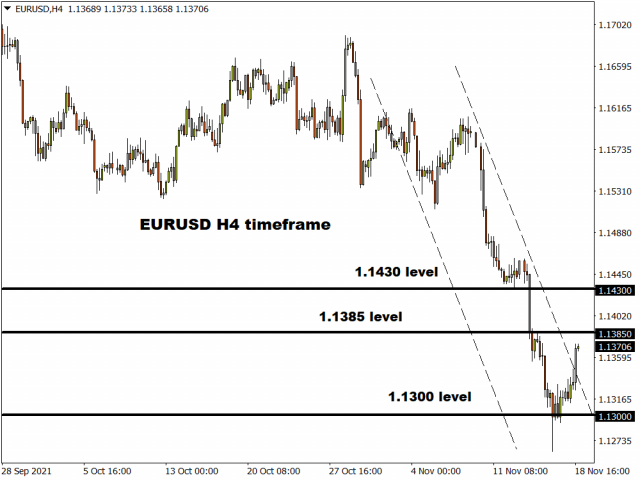
| EUR | 705,698 | 86 | -3,826 | 34 | -26,985 | 68 | 30,811 | 25 |
| GBP | 207,099 | 43 | -31,599 | 51 | 41,182 | 54 | -9,583 | 36 |
| JPY | 252,897 | 91 | -93,126 | 10 | 115,758 | 94 | -22,632 | 1 |
| CHF | 49,320 | 27 | -8,889 | 54 | 18,767 | 52 | -9,878 | 34 |
| CAD | 148,955 | 30 | 8,709 | 62 | -26,717 | 35 | 18,008 | 74 |
| AUD | 166,688 | 57 | -61,153 | 27 | 69,858 | 71 | -8,705 | 31 |
| NZD | 42,945 | 30 | 13,965 | 95 | -15,521 | 6 | 1,556 | 70 |
| MXN | 170,102 | 33 | -47,655 | 2 | 46,127 | 99 | 1,528 | 50 |
| RUB | 52,624 | 58 | 22,625 | 67 | -23,936 | 31 | 1,311 | 70 |
| BRL | 31,767 | 32 | -15,698 | 48 | 15,743 | 54 | -45 | 66 |
| Bitcoin | 13,648 | 78 | -1,478 | 69 | 357 | 0 | 1,121 | 23 |
US Dollar Index Futures:
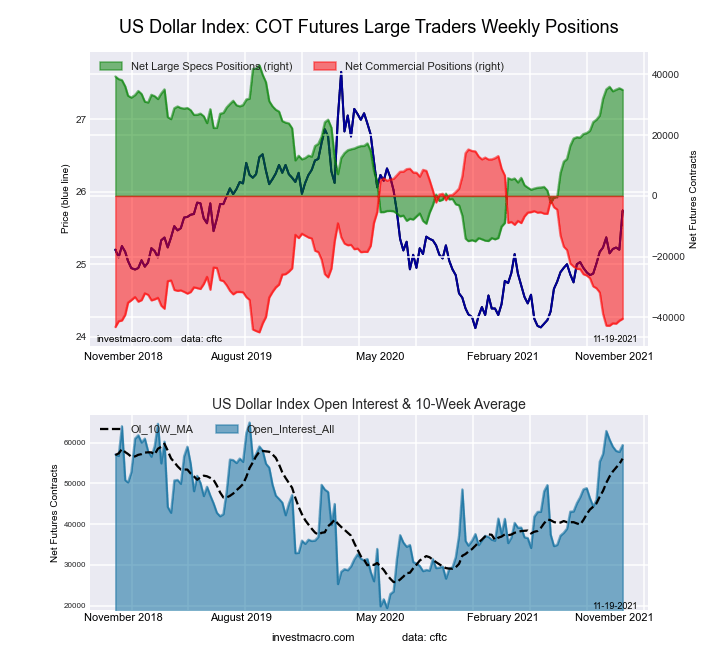 The US Dollar Index large speculator standing this week was a net position of 34,908 contracts in the data reported through Tuesday. This was a weekly lowering of -540 contracts from the previous week which had a total of 35,448 net contracts.
This week’s current strength score (the trader positioning range over the past three years, measured from 0 to 100) shows the speculators are currently Bullish-Extreme with a score of 86.0 percent. The commercials are Bearish-Extreme with a score of 7.4 percent and the small traders (not shown in chart) are Bullish with a score of 77.2 percent.
| US DOLLAR INDEX Statistics | SPECULATORS | COMMERCIALS | SMALL TRADERS |
| – Percent of Open Interest Longs: | 80.8 | 3.4 | 12.8 |
| – Percent of Open Interest Shorts: | 22.0 | 71.5 | 3.5 |
| – Net Position: | 34,908 | -40,455 | 5,547 |
| – Gross Longs: | 47,959 | 2,000 | 7,621 |
| – Gross Shorts: | 13,051 | 42,455 | 2,074 |
| – Long to Short Ratio: | 3.7 to 1 | 0.0 to 1 | 3.7 to 1 |
| NET POSITION TREND: | |||
| – COT Index Score (3 Year Range Pct): | 86.0 | 7.4 | 77.2 |
| – COT Index Reading (3 Year Range): | Bullish-Extreme | Bearish-Extreme | Bullish |
| NET POSITION MOVEMENT INDEX: | |||
| – 6-Week Change in Strength Index: | 5.0 | -2.7 | -13.6 |
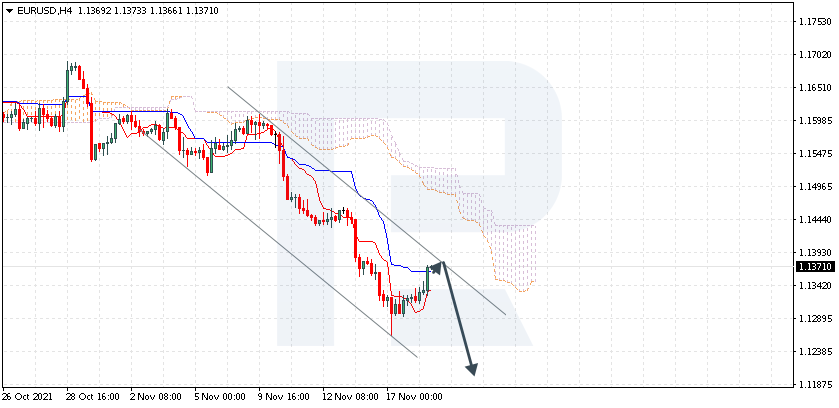
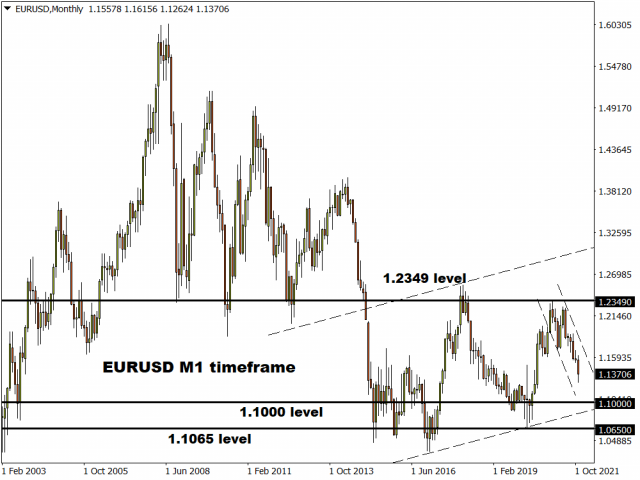
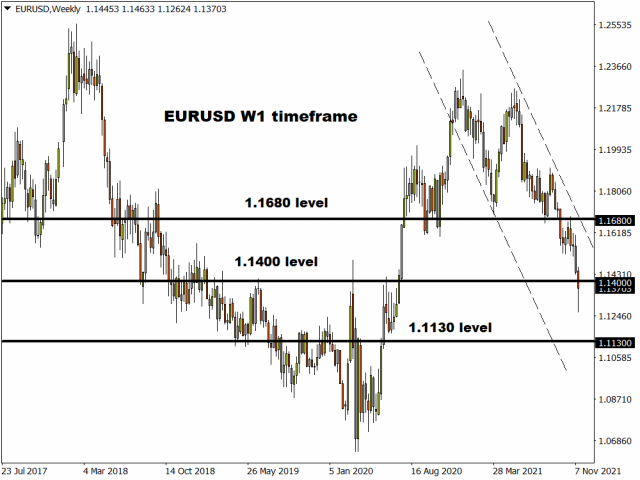
Euro Currency Futures:
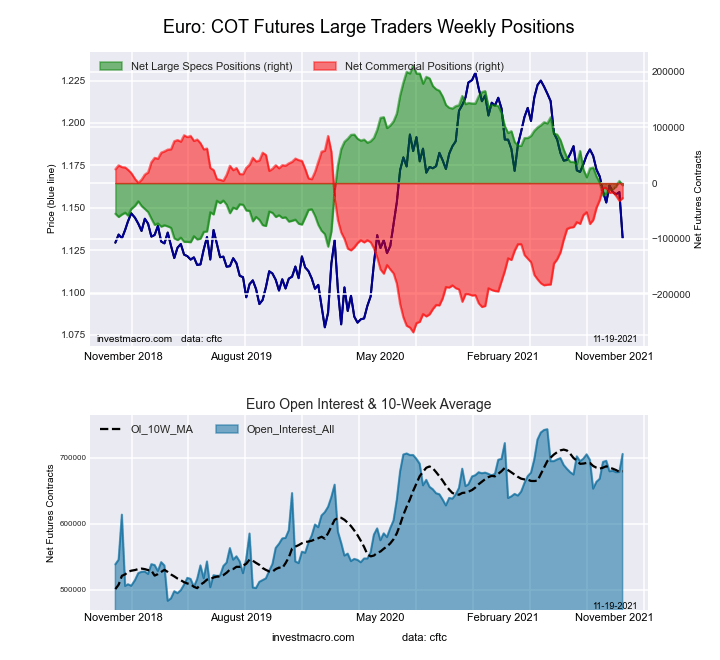 The Euro Currency large speculator standing this week was a net position of -3,826 contracts in the data reported through Tuesday. This was a weekly reduction of -7,599 contracts from the previous week which had a total of 3,773 net contracts.
This week’s current strength score (the trader positioning range over the past three years, measured from 0 to 100) shows the speculators are currently Bearish with a score of 33.8 percent. The commercials are Bullish with a score of 68.1 percent and the small traders (not shown in chart) are Bearish with a score of 25.4 percent.
| EURO Currency Statistics | SPECULATORS | COMMERCIALS | SMALL TRADERS |
| – Percent of Open Interest Longs: | 28.1 | 57.3 | 12.8 |
| – Percent of Open Interest Shorts: | 28.6 | 61.1 | 8.4 |
| – Net Position: | -3,826 | -26,985 | 30,811 |
| – Gross Longs: | 198,181 | 404,266 | 90,261 |
| – Gross Shorts: | 202,007 | 431,251 | 59,450 |
| – Long to Short Ratio: | 1.0 to 1 | 0.9 to 1 | 1.5 to 1 |
| NET POSITION TREND: | |||
| – COT Index Score (3 Year Range Pct): | 33.8 | 68.1 | 25.4 |
| – COT Index Reading (3 Year Range): | Bearish | Bullish | Bearish |
| NET POSITION MOVEMENT INDEX: | |||
| – 6-Week Change in Strength Index: | 5.7 | -5.2 | -0.0 |
British Pound Sterling Futures:
 The British Pound Sterling large speculator standing this week was a net position of -31,599 contracts in the data reported through Tuesday. This was a weekly lowering of -19,506 contracts from the previous week which had a total of -12,093 net contracts.
This week’s current strength score (the trader positioning range over the past three years, measured from 0 to 100) shows the speculators are currently Bullish with a score of 51.2 percent. The commercials are Bullish with a score of 54.0 percent and the small traders (not shown in chart) are Bearish with a score of 35.8 percent.
| BRITISH POUND Statistics | SPECULATORS | COMMERCIALS | SMALL TRADERS |
| – Percent of Open Interest Longs: | 24.4 | 61.4 | 11.3 |
| – Percent of Open Interest Shorts: | 39.6 | 41.5 | 15.9 |
| – Net Position: | -31,599 | 41,182 | -9,583 |
| – Gross Longs: | 50,443 | 127,197 | 23,322 |
| – Gross Shorts: | 82,042 | 86,015 | 32,905 |
| – Long to Short Ratio: | 0.6 to 1 | 1.5 to 1 | 0.7 to 1 |
| NET POSITION TREND: | |||
| – COT Index Score (3 Year Range Pct): | 51.2 | 54.0 | 35.8 |
| – COT Index Reading (3 Year Range): | Bullish | Bullish | Bearish |
| NET POSITION MOVEMENT INDEX: | |||
| – 6-Week Change in Strength Index: | -8.3 | 9.2 | -8.1 |
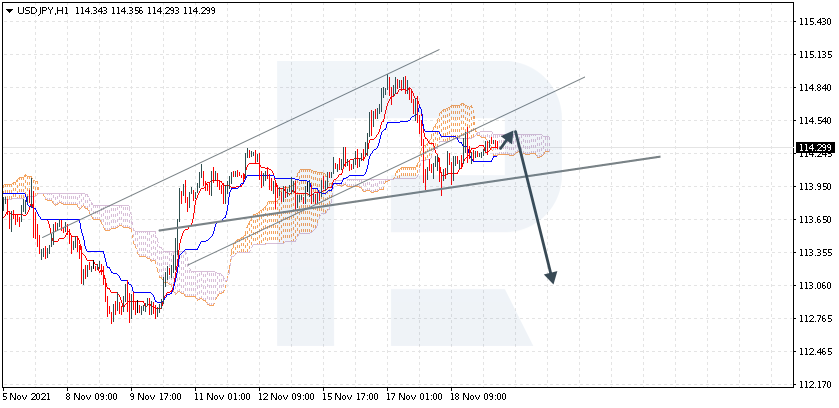
Japanese Yen Futures:
 The Japanese Yen large speculator standing this week was a net position of -93,126 contracts in the data reported through Tuesday. This was a weekly increase of 12,225 contracts from the previous week which had a total of -105,351 net contracts.
This week’s current strength score (the trader positioning range over the past three years, measured from 0 to 100) shows the speculators are currently Bearish-Extreme with a score of 10.4 percent. The commercials are Bullish-Extreme with a score of 93.7 percent and the small traders (not shown in chart) are Bearish-Extreme with a score of 0.8 percent.
| JAPANESE YEN Statistics | SPECULATORS | COMMERCIALS | SMALL TRADERS |
| – Percent of Open Interest Longs: | 9.7 | 80.5 | 8.6 |
| – Percent of Open Interest Shorts: | 46.6 | 34.7 | 17.6 |
| – Net Position: | -93,126 | 115,758 | -22,632 |
| – Gross Longs: | 24,635 | 203,468 | 21,790 |
| – Gross Shorts: | 117,761 | 87,710 | 44,422 |
| – Long to Short Ratio: | 0.2 to 1 | 2.3 to 1 | 0.5 to 1 |
| NET POSITION TREND: | |||
| – COT Index Score (3 Year Range Pct): | 10.4 | 93.7 | 0.8 |
| – COT Index Reading (3 Year Range): | Bearish-Extreme | Bullish-Extreme | Bearish-Extreme |
| NET POSITION MOVEMENT INDEX: | |||
| – 6-Week Change in Strength Index: | -18.4 | 15.5 | -4.1 |
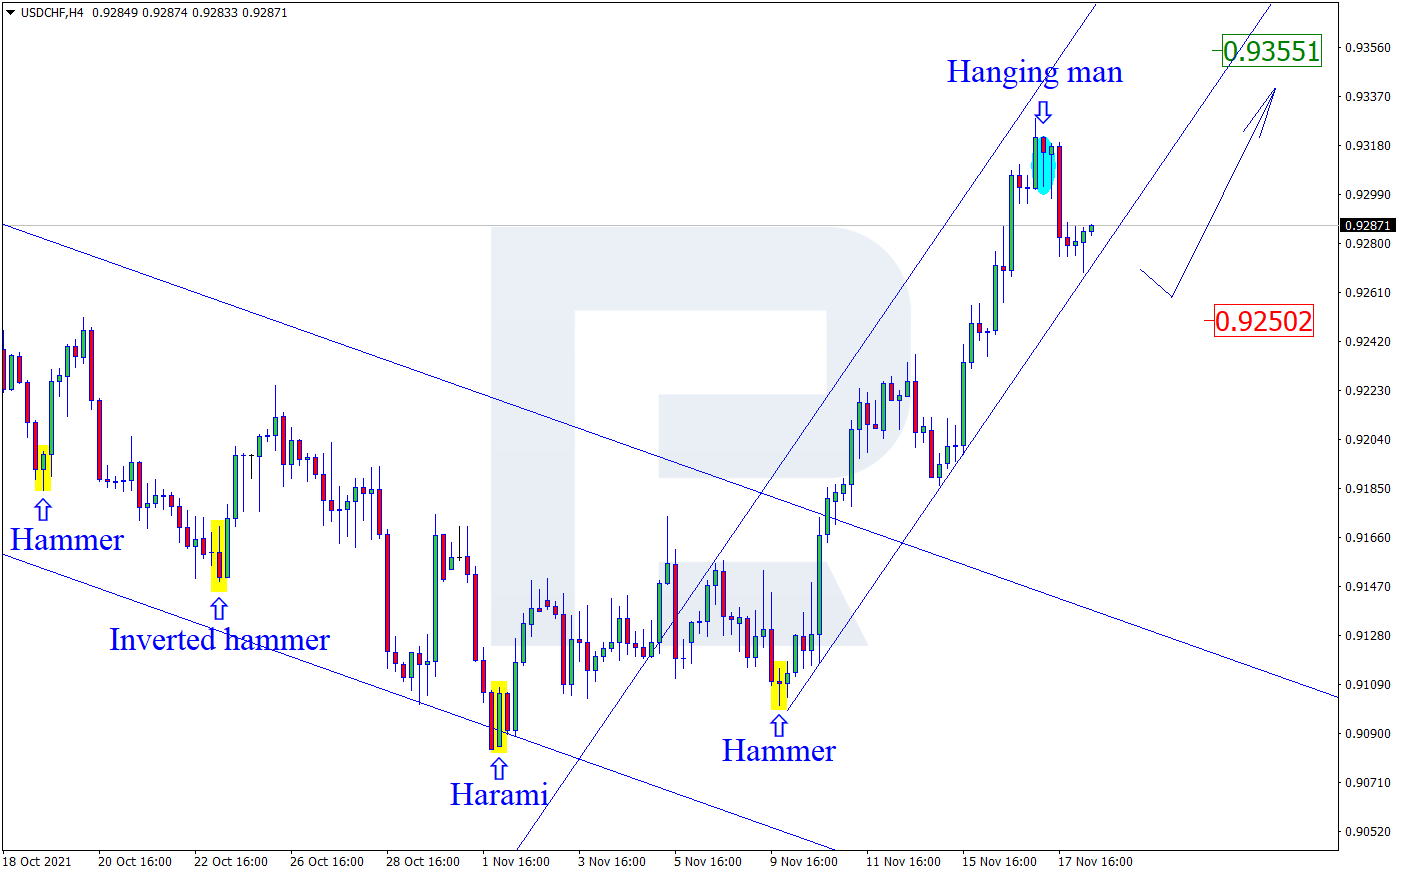
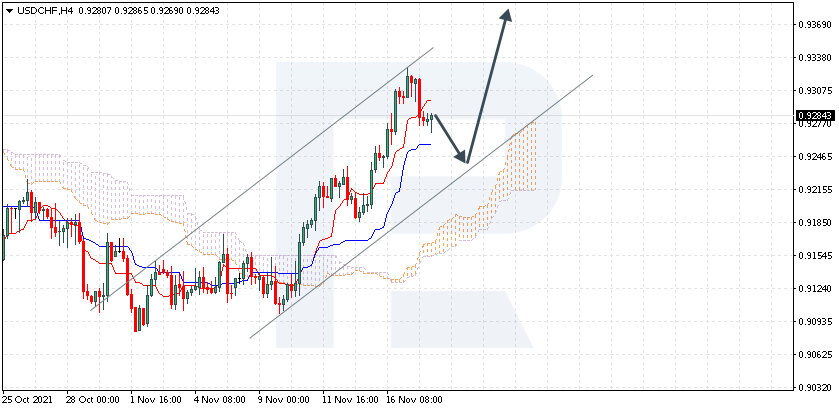
Swiss Franc Futures:
 The Swiss Franc large speculator standing this week was a net position of -8,889 contracts in the data reported through Tuesday. This was a weekly rise of 8,154 contracts from the previous week which had a total of -17,043 net contracts.
This week’s current strength score (the trader positioning range over the past three years, measured from 0 to 100) shows the speculators are currently Bullish with a score of 54.4 percent. The commercials are Bullish with a score of 52.0 percent and the small traders (not shown in chart) are Bearish with a score of 34.3 percent.
| SWISS FRANC Statistics | SPECULATORS | COMMERCIALS | SMALL TRADERS |
| – Percent of Open Interest Longs: | 11.2 | 64.2 | 24.4 |
| – Percent of Open Interest Shorts: | 29.2 | 26.1 | 44.5 |
| – Net Position: | -8,889 | 18,767 | -9,878 |
| – Gross Longs: | 5,502 | 31,663 | 12,048 |
| – Gross Shorts: | 14,391 | 12,896 | 21,926 |
| – Long to Short Ratio: | 0.4 to 1 | 2.5 to 1 | 0.5 to 1 |
| NET POSITION TREND: | |||
| – COT Index Score (3 Year Range Pct): | 54.4 | 52.0 | 34.3 |
| – COT Index Reading (3 Year Range): | Bullish | Bullish | Bearish |
| NET POSITION MOVEMENT INDEX: | |||
| – 6-Week Change in Strength Index: | 11.9 | -12.2 | 11.8 |
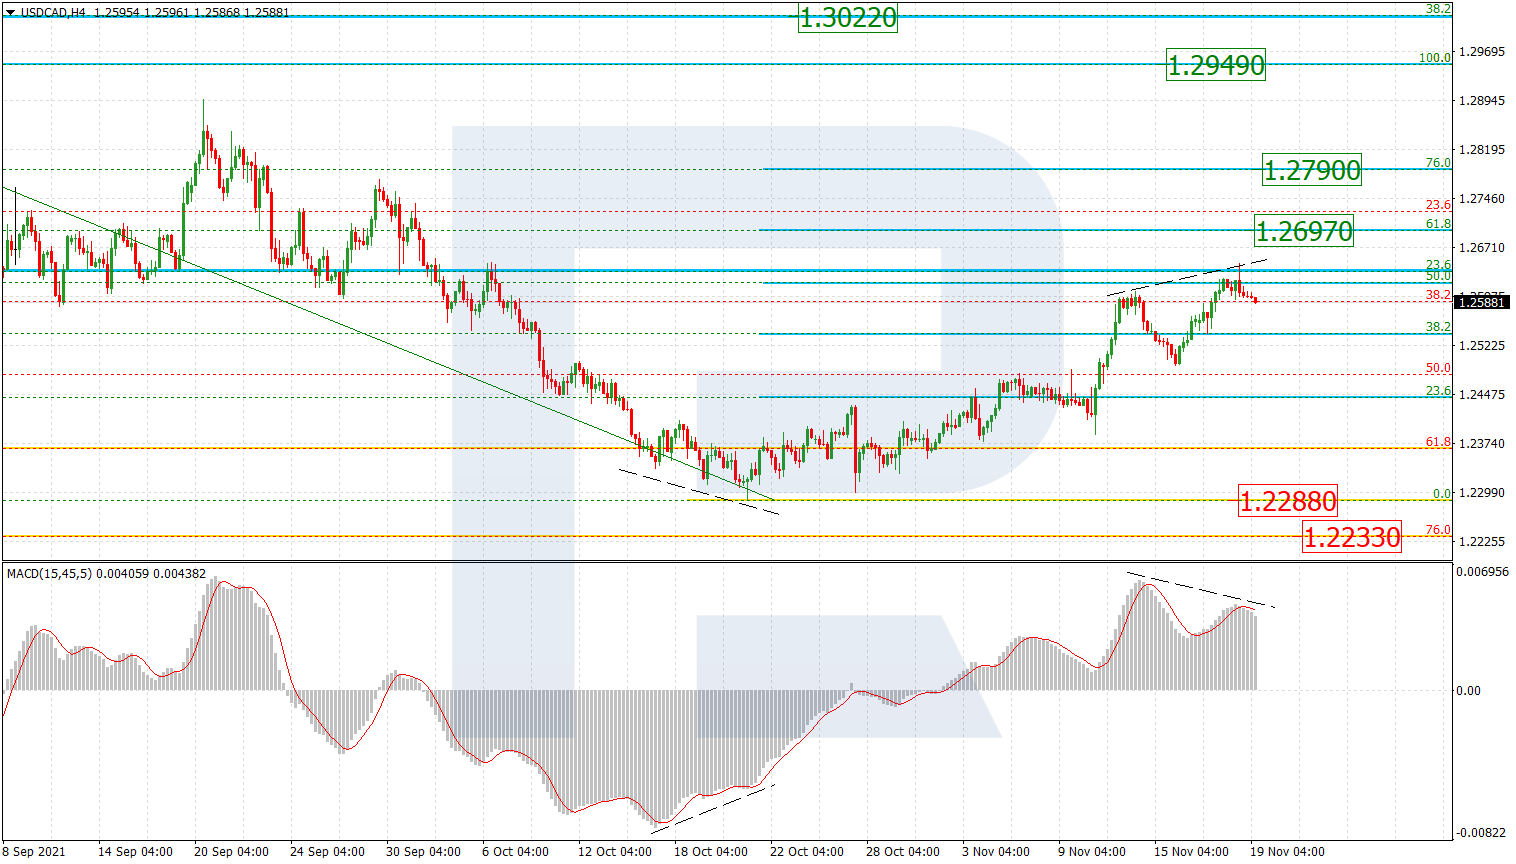
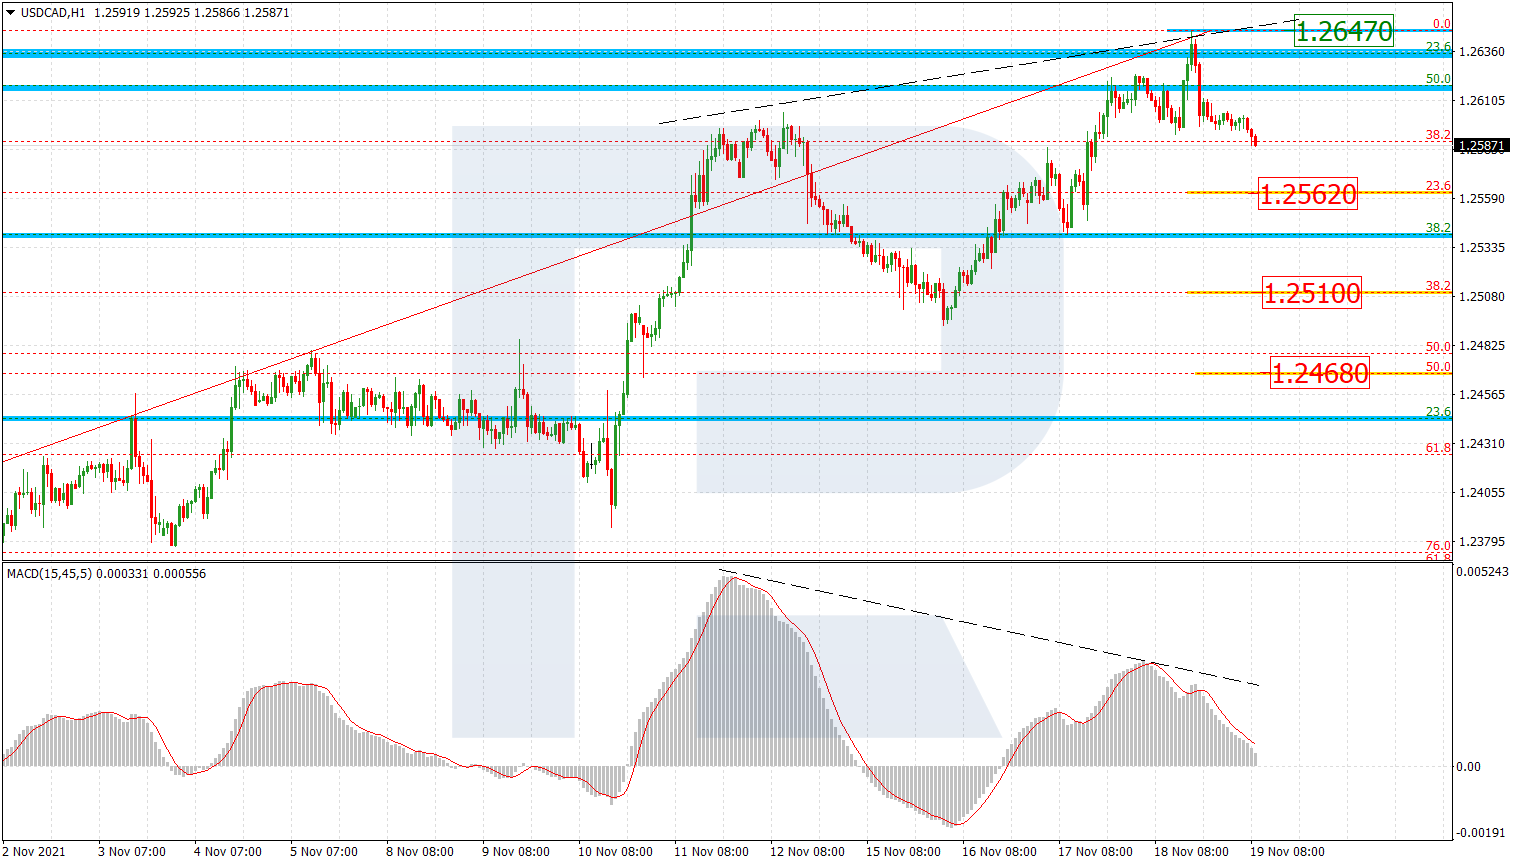
Canadian Dollar Futures:
 The Canadian Dollar large speculator standing this week was a net position of 8,709 contracts in the data reported through Tuesday. This was a weekly rise of 3,605 contracts from the previous week which had a total of 5,104 net contracts.
This week’s current strength score (the trader positioning range over the past three years, measured from 0 to 100) shows the speculators are currently Bullish with a score of 62.3 percent. The commercials are Bearish with a score of 34.9 percent and the small traders (not shown in chart) are Bullish with a score of 74.0 percent.
| CANADIAN DOLLAR Statistics | SPECULATORS | COMMERCIALS | SMALL TRADERS |
| – Percent of Open Interest Longs: | 29.6 | 42.1 | 27.1 |
| – Percent of Open Interest Shorts: | 23.8 | 60.0 | 15.0 |
| – Net Position: | 8,709 | -26,717 | 18,008 |
| – Gross Longs: | 44,147 | 62,689 | 40,389 |
| – Gross Shorts: | 35,438 | 89,406 | 22,381 |
| – Long to Short Ratio: | 1.2 to 1 | 0.7 to 1 | 1.8 to 1 |
| NET POSITION TREND: | |||
| – COT Index Score (3 Year Range Pct): | 62.3 | 34.9 | 74.0 |
| – COT Index Reading (3 Year Range): | Bullish | Bearish | Bullish |
| NET POSITION MOVEMENT INDEX: | |||
| – 6-Week Change in Strength Index: | 29.6 | -26.4 | 10.0 |
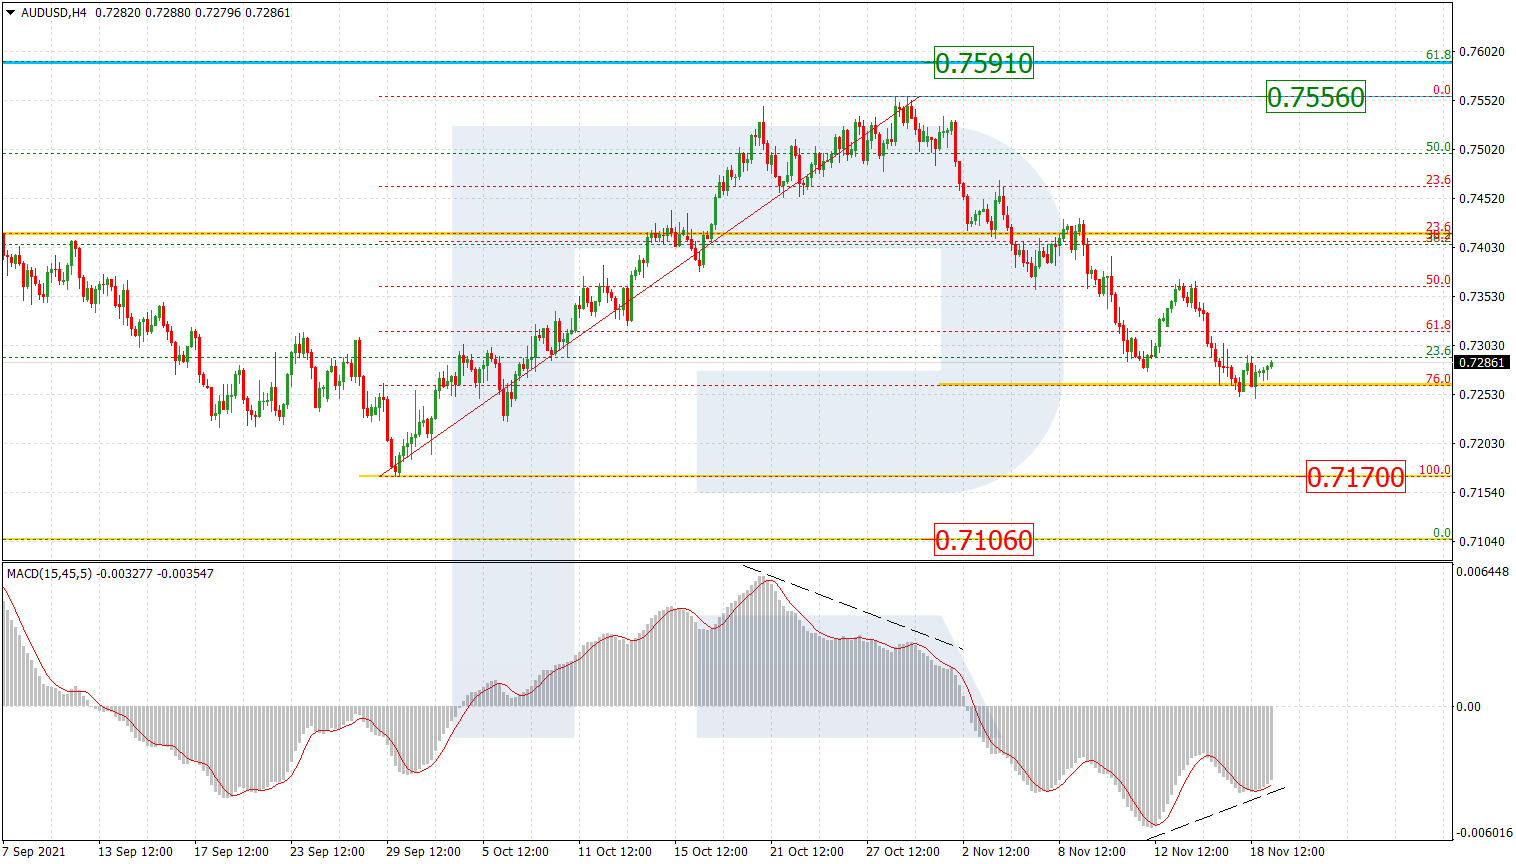
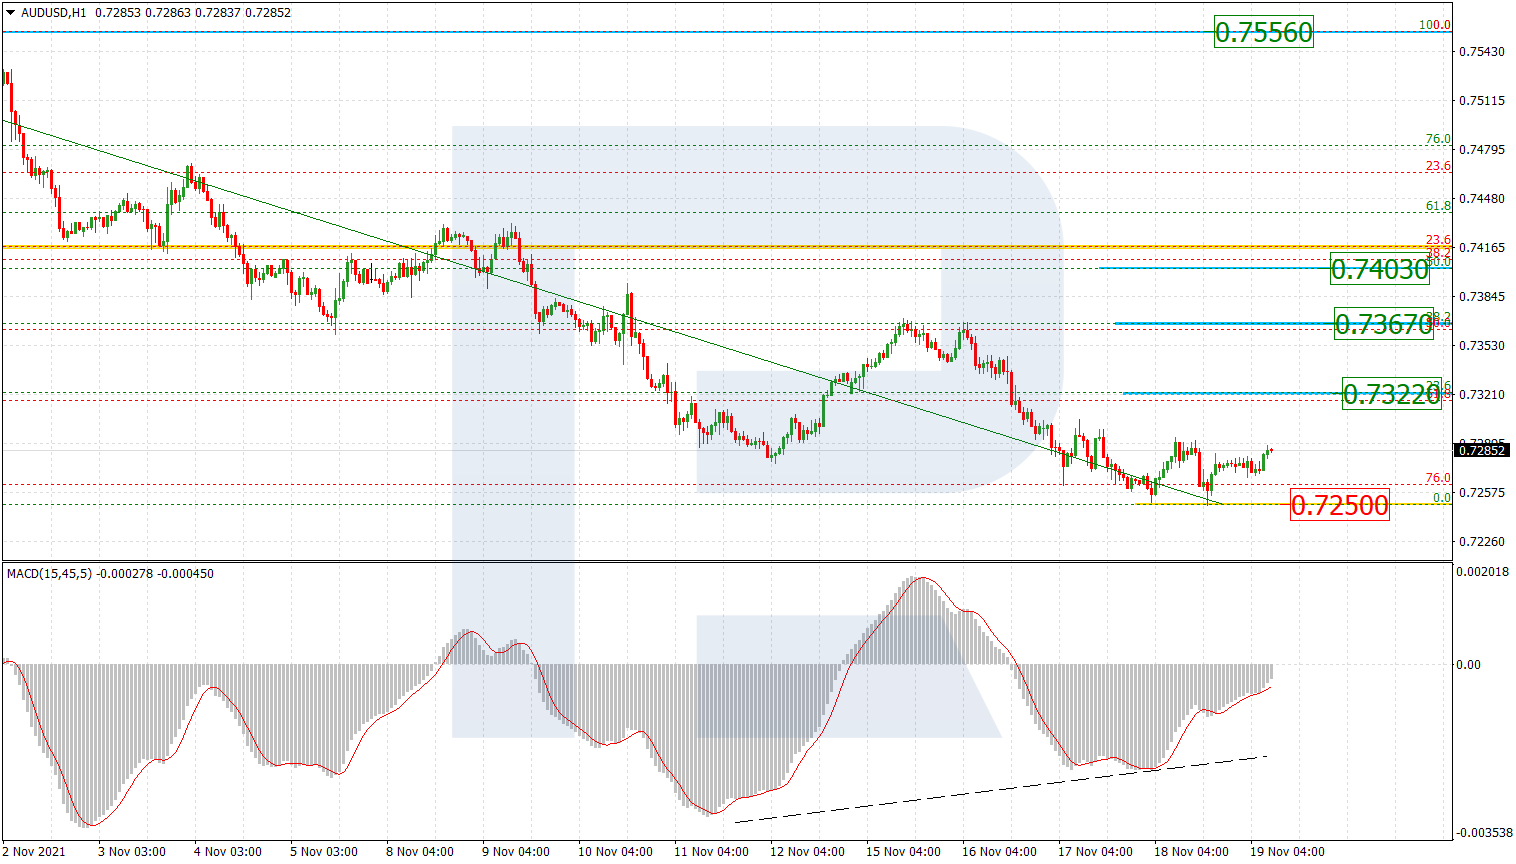
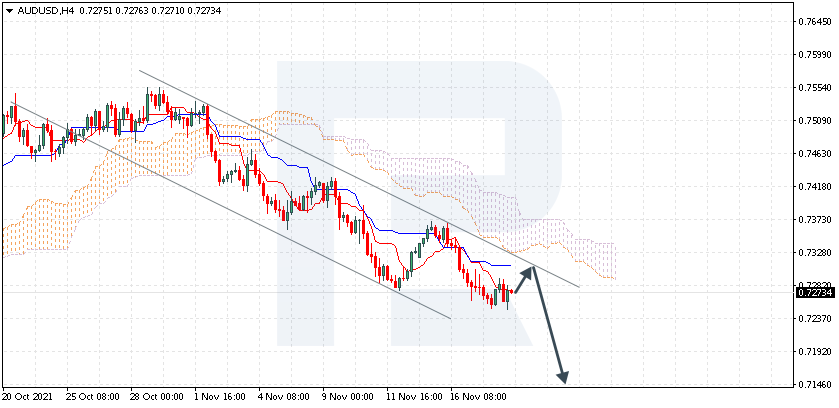
Australian Dollar Futures:
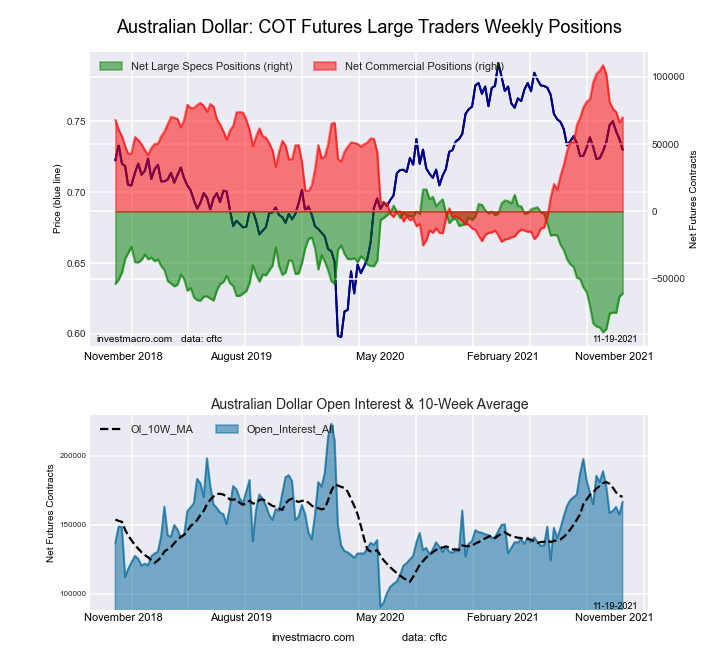 The Australian Dollar large speculator standing this week was a net position of -61,153 contracts in the data reported through Tuesday. This was a weekly gain of 2,271 contracts from the previous week which had a total of -63,424 net contracts.
This week’s current strength score (the trader positioning range over the past three years, measured from 0 to 100) shows the speculators are currently Bearish with a score of 27.1 percent. The commercials are Bullish with a score of 71.0 percent and the small traders (not shown in chart) are Bearish with a score of 31.2 percent.
| AUSTRALIAN DOLLAR Statistics | SPECULATORS | COMMERCIALS | SMALL TRADERS |
| – Percent of Open Interest Longs: | 18.5 | 67.2 | 11.8 |
| – Percent of Open Interest Shorts: | 55.1 | 25.3 | 17.1 |
| – Net Position: | -61,153 | 69,858 | -8,705 |
| – Gross Longs: | 30,760 | 112,044 | 19,744 |
| – Gross Shorts: | 91,913 | 42,186 | 28,449 |
| – Long to Short Ratio: | 0.3 to 1 | 2.7 to 1 | 0.7 to 1 |
| NET POSITION TREND: | |||
| – COT Index Score (3 Year Range Pct): | 27.1 | 71.0 | 31.2 |
| – COT Index Reading (3 Year Range): | Bearish | Bullish | Bearish |
| NET POSITION MOVEMENT INDEX: | |||
| – 6-Week Change in Strength Index: | 27.1 | -29.0 | 24.4 |
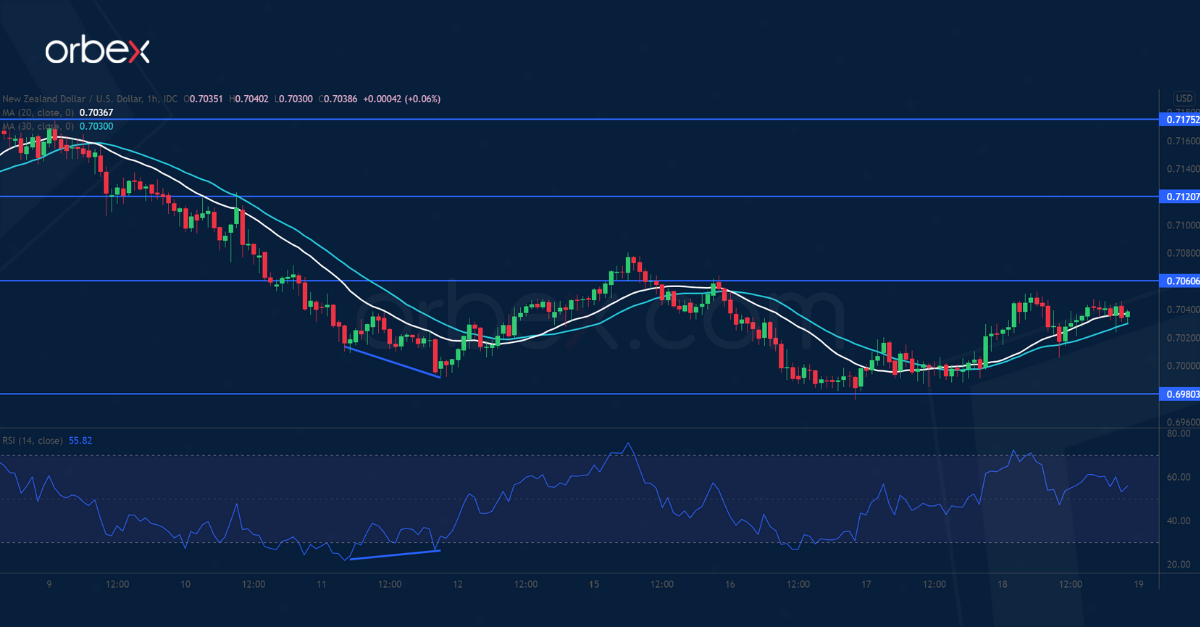
New Zealand Dollar Futures:
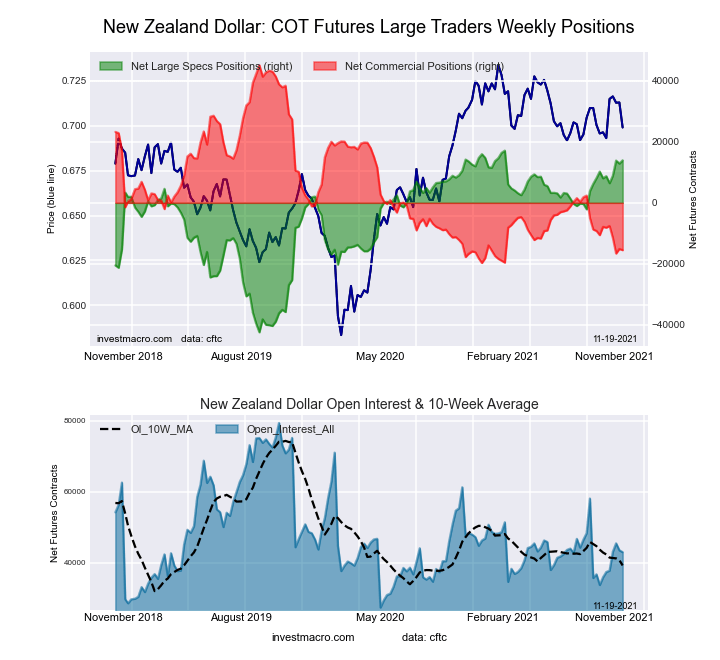 The New Zealand Dollar large speculator standing this week was a net position of 13,965 contracts in the data reported through Tuesday. This was a weekly boost of 1,083 contracts from the previous week which had a total of 12,882 net contracts.
This week’s current strength score (the trader positioning range over the past three years, measured from 0 to 100) shows the speculators are currently Bullish-Extreme with a score of 94.7 percent. The commercials are Bearish-Extreme with a score of 6.5 percent and the small traders (not shown in chart) are Bullish with a score of 69.7 percent.
| NEW ZEALAND DOLLAR Statistics | SPECULATORS | COMMERCIALS | SMALL TRADERS |
| – Percent of Open Interest Longs: | 61.4 | 24.1 | 11.5 |
| – Percent of Open Interest Shorts: | 28.9 | 60.2 | 7.8 |
| – Net Position: | 13,965 | -15,521 | 1,556 |
| – Gross Longs: | 26,388 | 10,349 | 4,923 |
| – Gross Shorts: | 12,423 | 25,870 | 3,367 |
| – Long to Short Ratio: | 2.1 to 1 | 0.4 to 1 | 1.5 to 1 |
| NET POSITION TREND: | |||
| – COT Index Score (3 Year Range Pct): | 94.7 | 6.5 | 69.7 |
| – COT Index Reading (3 Year Range): | Bullish-Extreme | Bearish-Extreme | Bullish |
| NET POSITION MOVEMENT INDEX: | |||
| – 6-Week Change in Strength Index: | 9.9 | -11.8 | 19.8 |
Mexican Peso Futures:
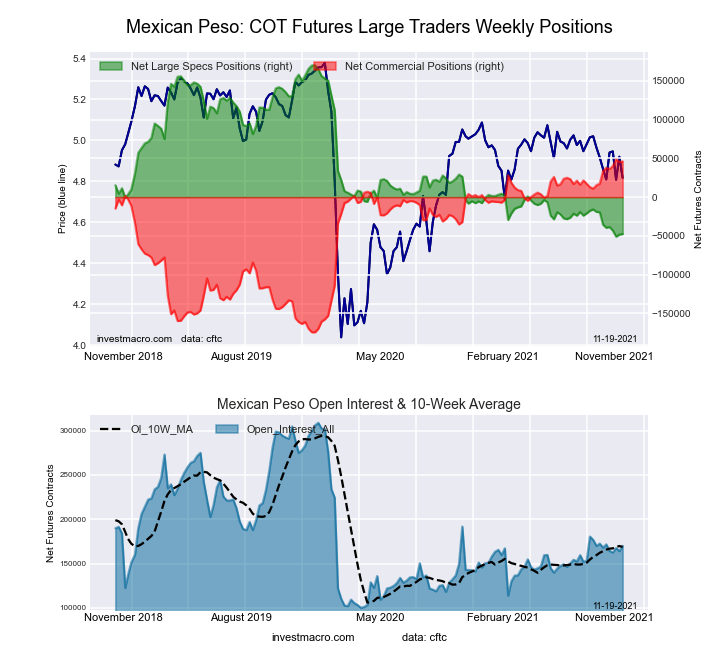 The Mexican Peso large speculator standing this week was a net position of -47,655 contracts in the data reported through Tuesday. This was a weekly gain of 752 contracts from the previous week which had a total of -48,407 net contracts.
This week’s current strength score (the trader positioning range over the past three years, measured from 0 to 100) shows the speculators are currently Bearish-Extreme with a score of 1.5 percent. The commercials are Bullish-Extreme with a score of 98.8 percent and the small traders (not shown in chart) are Bearish with a score of 49.5 percent.
| MEXICAN PESO Statistics | SPECULATORS | COMMERCIALS | SMALL TRADERS |
| – Percent of Open Interest Longs: | 41.1 | 55.3 | 3.1 |
| – Percent of Open Interest Shorts: | 69.2 | 28.2 | 2.2 |
| – Net Position: | -47,655 | 46,127 | 1,528 |
| – Gross Longs: | 69,984 | 94,074 | 5,245 |
| – Gross Shorts: | 117,639 | 47,947 | 3,717 |
| – Long to Short Ratio: | 0.6 to 1 | 2.0 to 1 | 1.4 to 1 |
| NET POSITION TREND: | |||
| – COT Index Score (3 Year Range Pct): | 1.5 | 98.8 | 49.5 |
| – COT Index Reading (3 Year Range): | Bearish-Extreme | Bullish-Extreme | Bearish |
| NET POSITION MOVEMENT INDEX: | |||
| – 6-Week Change in Strength Index: | -5.5 | 5.6 | -1.5 |
Brazilian Real Futures:
 The Brazilian Real large speculator standing this week was a net position of -15,698 contracts in the data reported through Tuesday. This was a weekly decrease of -240 contracts from the previous week which had a total of -15,458 net contracts.
This week’s current strength score (the trader positioning range over the past three years, measured from 0 to 100) shows the speculators are currently Bearish with a score of 47.6 percent. The commercials are Bullish with a score of 54.4 percent and the small traders (not shown in chart) are Bullish with a score of 66.3 percent.
| BRAZIL REAL Statistics | SPECULATORS | COMMERCIALS | SMALL TRADERS |
| – Percent of Open Interest Longs: | 26.7 | 64.6 | 8.0 |
| – Percent of Open Interest Shorts: | 76.1 | 15.0 | 8.2 |
| – Net Position: | -15,698 | 15,743 | -45 |
| – Gross Longs: | 8,468 | 20,507 | 2,545 |
| – Gross Shorts: | 24,166 | 4,764 | 2,590 |
| – Long to Short Ratio: | 0.4 to 1 | 4.3 to 1 | 1.0 to 1 |
| NET POSITION TREND: | |||
| – COT Index Score (3 Year Range Pct): | 47.6 | 54.4 | 66.3 |
| – COT Index Reading (3 Year Range): | Bearish | Bullish | Bullish |
| NET POSITION MOVEMENT INDEX: | |||
| – 6-Week Change in Strength Index: | -17.9 | 19.3 | -12.9 |
Russian Ruble Futures:
 The Russian Ruble large speculator standing this week was a net position of 22,625 contracts in the data reported through Tuesday. This was a weekly advance of 1,922 contracts from the previous week which had a total of 20,703 net contracts.
This week’s current strength score (the trader positioning range over the past three years, measured from 0 to 100) shows the speculators are currently Bullish with a score of 66.9 percent. The commercials are Bearish with a score of 30.7 percent and the small traders (not shown in chart) are Bullish with a score of 70.2 percent.
| RUSSIAN RUBLE Statistics | SPECULATORS | COMMERCIALS | SMALL TRADERS |
| – Percent of Open Interest Longs: | 57.7 | 37.7 | 4.6 |
| – Percent of Open Interest Shorts: | 14.7 | 83.2 | 2.1 |
| – Net Position: | 22,625 | -23,936 | 1,311 |
| – Gross Longs: | 30,357 | 19,849 | 2,418 |
| – Gross Shorts: | 7,732 | 43,785 | 1,107 |
| – Long to Short Ratio: | 3.9 to 1 | 0.5 to 1 | 2.2 to 1 |
| NET POSITION TREND: | |||
| – COT Index Score (3 Year Range Pct): | 66.9 | 30.7 | 70.2 |
| – COT Index Reading (3 Year Range): | Bullish | Bearish | Bullish |
| NET POSITION MOVEMENT INDEX: | |||
| – 6-Week Change in Strength Index: | 5.2 | -3.3 | -20.9 |
Bitcoin Futures:
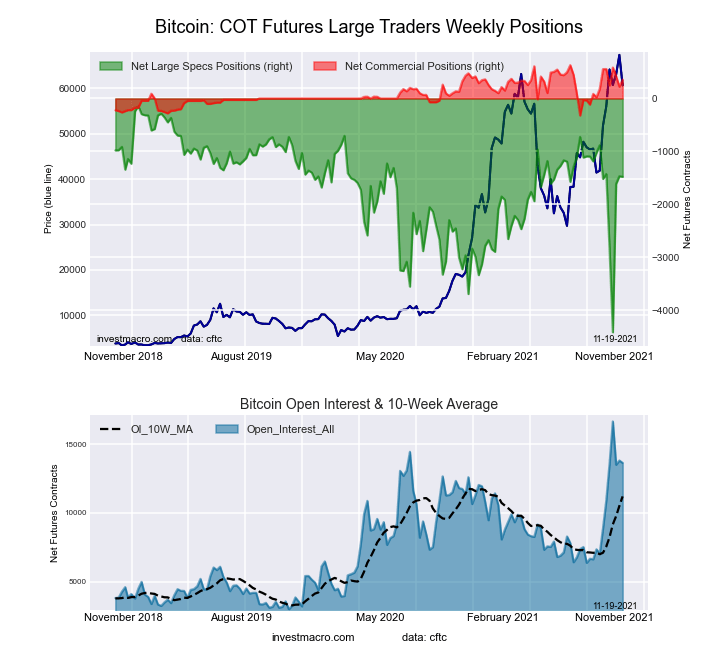 The Bitcoin large speculator standing this week was a net position of -1,478 contracts in the data reported through Tuesday. This was a weekly reduction of -11 contracts from the previous week which had a total of -1,467 net contracts.
This week’s current strength score (the trader positioning range over the past three years, measured from 0 to 100) shows the speculators are currently Bullish with a score of 68.7 percent. The commercials are Bullish with a score of 71.4 percent and the small traders (not shown in chart) are Bearish with a score of 22.9 percent.
| BITCOIN Statistics | SPECULATORS | COMMERCIALS | SMALL TRADERS |
| – Percent of Open Interest Longs: | 63.4 | 5.0 | 14.7 |
| – Percent of Open Interest Shorts: | 74.2 | 2.4 | 6.5 |
| – Net Position: | -1,478 | 357 | 1,121 |
| – Gross Longs: | 8,649 | 678 | 2,008 |
| – Gross Shorts: | 10,127 | 321 | 887 |
| – Long to Short Ratio: | 0.9 to 1 | 2.1 to 1 | 2.3 to 1 |
| NET POSITION TREND: | |||
| – COT Index Score (3 Year Range Pct): | 68.7 | 71.4 | 22.9 |
| – COT Index Reading (3 Year Range): | Bullish | Bullish | Bearish |
| NET POSITION MOVEMENT INDEX: | |||
| – 6-Week Change in Strength Index: | 0.9 | -20.8 | 4.5 |
Article By InvestMacro – Receive our weekly COT Reports by Email
*COT Report: The COT data, released weekly to the public each Friday, is updated through the most recent Tuesday (data is 3 days old) and shows a quick view of how large speculators or non-commercials (for-profit traders) were positioned in the futures markets.
The CFTC categorizes trader positions according to commercial hedgers (traders who use futures contracts for hedging as part of the business), non-commercials (large traders who speculate to realize trading profits) and nonreportable traders (usually small traders/speculators) as well as their open interest (contracts open in the market at time of reporting).See CFTC criteria here.


