Here are the latest charts and statistics for the Commitment of Traders (COT) data published by the Commodities Futures Trading Commission (CFTC).
The latest COT data is updated through Tuesday November 30th 2021 and shows a quick view of how large traders (for-profit speculators and commercial entities) were positioned in the futures markets. All currency positions are in direct relation to the US dollar where, for example, a bet for the euro is a bet that the euro will rise versus the dollar while a bet against the euro will be a bet that the euro will decline versus the dollar.
Highlighting this week’s COT currency data is the Japanese yen speculator bets that rebounded in a risk-off environment. This week’s improvement (or reduction of bearish positioning) in yen positions marked the best one-week gain since March 17th of 2020, a span of eighty-nine weeks. Yen speculator positioning has been very negative since contracts fell onto the bearish side in March of 2021. The bearish sentiment hit a short-term high point just five weeks ago on November 2nd when net positions dropped to a total of -107,624 net contracts. Since that week, bearish bets have improved by a total of +28,758 contracts to level at this week’s -78,866 current contract standing.
Overall, this week’s risk-off tone helped the yen positions while taking a bite out of the bets for the usual risk-on currencies. The Australian dollar bets fell by -16,920 contracts, the Canadian dollar dropped by -10,940 contracts and the New Zealand dollar slipped by -3,309 contracts as well this week. Currently, only the US Dollar Index, the Russian Ruble and the New Zealand dollar have net positive speculator positioning.
| Nov-30-2021 | OI | OI-Index | Spec-Net | Spec-Index | Com-Net | COM-Index | Smalls-Net | Smalls-Index |
|---|
| USD Index | 52,172 | 72 | 35,879 | 88 | -40,442 | 7 | 4,563 | 66 |
| EUR | 705,409 | 85 | -23,240 | 28 | -10,871 | 73 | 34,111 | 31 |
| GBP | 230,423 | 58 | -38,899 | 46 | 53,772 | 61 | -14,873 | 25 |
| JPY | 216,692 | 66 | -78,866 | 18 | 92,033 | 82 | -13,167 | 21 |
| CHF | 50,543 | 29 | -14,182 | 45 | 21,175 | 55 | -6,993 | 43 |
| CAD | 148,375 | 29 | -14,075 | 43 | 9,851 | 58 | 4,224 | 53 |
| AUD | 201,981 | 84 | -80,185 | 9 | 94,709 | 90 | -14,524 | 17 |
| NZD | 49,483 | 43 | 10,630 | 89 | -9,303 | 16 | -1,327 | 37 |
| MXN | 195,719 | 46 | -59,747 | 0 | 61,120 | 100 | -1,373 | 37 |
| RUB | 49,870 | 53 | 13,637 | 46 | -15,633 | 50 | 1,996 | 89 |
| BRL | 41,101 | 46 | -13,842 | 50 | 15,065 | 53 | -1,223 | 52 |
| Bitcoin | 13,197 | 75 | -1,691 | 64 | 697 | 0 | 994 | 36 |
US Dollar Index Futures:
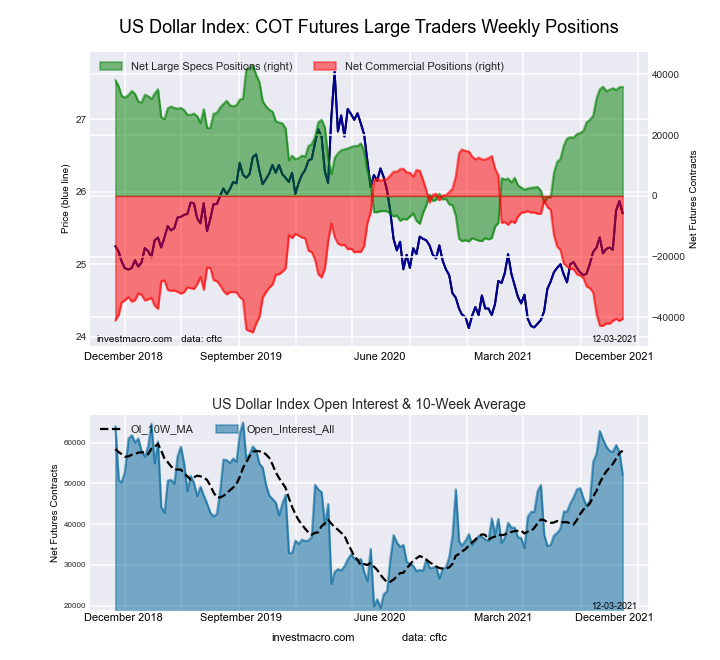 The US Dollar Index large speculator standing this week reached a net position of 35,879 contracts in the data reported through Tuesday. This was a weekly rise of 104 contracts from the previous week which had a total of 35,775 net contracts.
This week’s current strength score (the trader positioning range over the past three years, measured from 0 to 100) shows the speculators are currently Bullish-Extreme with a score of 87.7 percent. The commercials are Bearish-Extreme with a score of 7.4 percent and the small traders (not shown in chart) are Bullish with a score of 66.4 percent.
| US DOLLAR INDEX Statistics | SPECULATORS | COMMERCIALS | SMALL TRADERS |
| – Percent of Open Interest Longs: | 80.5 | 3.1 | 12.6 |
| – Percent of Open Interest Shorts: | 11.8 | 80.6 | 3.9 |
| – Net Position: | 35,879 | -40,442 | 4,563 |
| – Gross Longs: | 42,010 | 1,634 | 6,581 |
| – Gross Shorts: | 6,131 | 42,076 | 2,018 |
| – Long to Short Ratio: | 6.9 to 1 | 0.0 to 1 | 3.3 to 1 |
| NET POSITION TREND: | | | |
| – COT Index Score (3 Year Range Pct): | 87.7 | 7.4 | 66.4 |
| – COT Index Reading (3 Year Range): | Bullish-Extreme | Bearish-Extreme | Bullish |
| NET POSITION MOVEMENT INDEX: | | | |
| – 6-Week Change in Strength Index: | -0.1 | 3.8 | -24.4 |
Euro Currency Futures:
 The Euro Currency large speculator standing this week reached a net position of -23,240 contracts in the data reported through Tuesday. This was a weekly reduction of -6,788 contracts from the previous week which had a total of -16,452 net contracts.
This week’s current strength score (the trader positioning range over the past three years, measured from 0 to 100) shows the speculators are currently Bearish with a score of 27.9 percent. The commercials are Bullish with a score of 72.6 percent and the small traders (not shown in chart) are Bearish with a score of 30.9 percent.
| EURO Currency Statistics | SPECULATORS | COMMERCIALS | SMALL TRADERS |
| – Percent of Open Interest Longs: | 27.1 | 57.8 | 13.1 |
| – Percent of Open Interest Shorts: | 30.4 | 59.3 | 8.3 |
| – Net Position: | -23,240 | -10,871 | 34,111 |
| – Gross Longs: | 191,048 | 407,774 | 92,665 |
| – Gross Shorts: | 214,288 | 418,645 | 58,554 |
| – Long to Short Ratio: | 0.9 to 1 | 1.0 to 1 | 1.6 to 1 |
| NET POSITION TREND: | | | |
| – COT Index Score (3 Year Range Pct): | 27.9 | 72.6 | 30.9 |
| – COT Index Reading (3 Year Range): | Bearish | Bullish | Bearish |
| NET POSITION MOVEMENT INDEX: | | | |
| – 6-Week Change in Strength Index: | -3.4 | 1.9 | 7.3 |
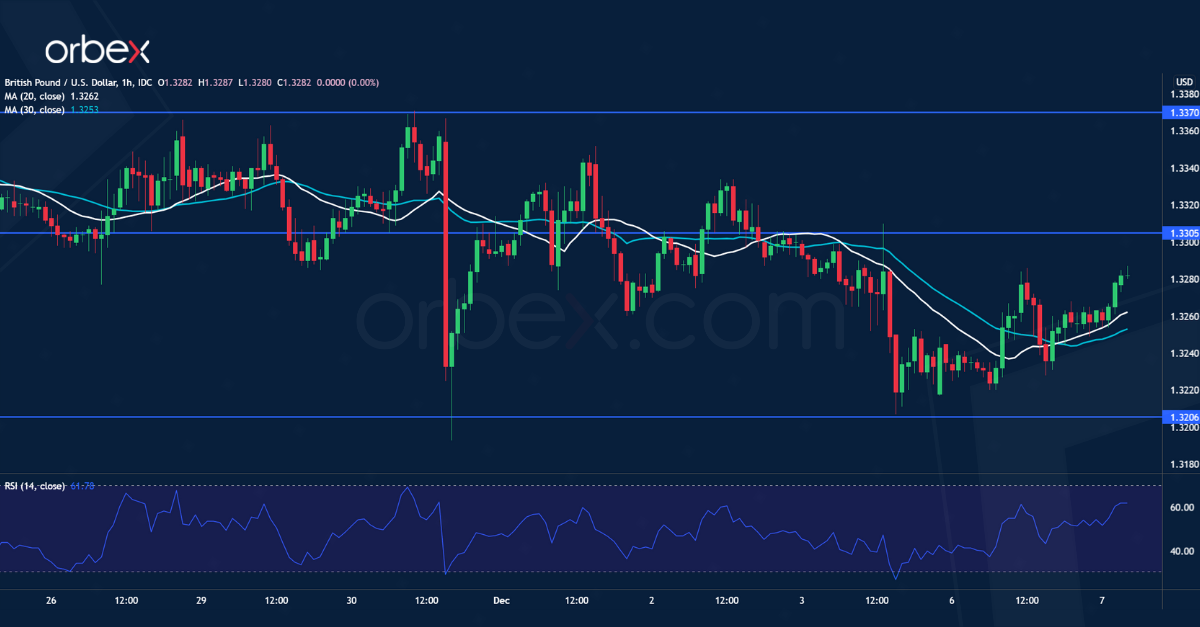
British Pound Sterling Futures:
 The British Pound Sterling large speculator standing this week reached a net position of -38,899 contracts in the data reported through Tuesday. This was a weekly decrease of -4,320 contracts from the previous week which had a total of -34,579 net contracts.
This week’s current strength score (the trader positioning range over the past three years, measured from 0 to 100) shows the speculators are currently Bearish with a score of 46.0 percent. The commercials are Bullish with a score of 61.5 percent and the small traders (not shown in chart) are Bearish with a score of 24.8 percent.
| BRITISH POUND Statistics | SPECULATORS | COMMERCIALS | SMALL TRADERS |
| – Percent of Open Interest Longs: | 22.6 | 64.7 | 9.7 |
| – Percent of Open Interest Shorts: | 39.5 | 41.4 | 16.2 |
| – Net Position: | -38,899 | 53,772 | -14,873 |
| – Gross Longs: | 52,099 | 149,168 | 22,364 |
| – Gross Shorts: | 90,998 | 95,396 | 37,237 |
| – Long to Short Ratio: | 0.6 to 1 | 1.6 to 1 | 0.6 to 1 |
| NET POSITION TREND: | | | |
| – COT Index Score (3 Year Range Pct): | 46.0 | 61.5 | 24.8 |
| – COT Index Reading (3 Year Range): | Bearish | Bullish | Bearish |
| NET POSITION MOVEMENT INDEX: | | | |
| – 6-Week Change in Strength Index: | -29.2 | 33.2 | -32.4 |
Japanese Yen Futures:
 The Japanese Yen large speculator standing this week reached a net position of -78,866 contracts in the data reported through Tuesday. This was a weekly increase of 18,387 contracts from the previous week which had a total of -97,253 net contracts.
This week’s current strength score (the trader positioning range over the past three years, measured from 0 to 100) shows the speculators are currently Bearish-Extreme with a score of 18.2 percent. The commercials are Bullish-Extreme with a score of 81.9 percent and the small traders (not shown in chart) are Bearish with a score of 21.4 percent.
| JAPANESE YEN Statistics | SPECULATORS | COMMERCIALS | SMALL TRADERS |
| – Percent of Open Interest Longs: | 6.7 | 81.8 | 9.5 |
| – Percent of Open Interest Shorts: | 43.1 | 39.3 | 15.6 |
| – Net Position: | -78,866 | 92,033 | -13,167 |
| – Gross Longs: | 14,585 | 177,285 | 20,644 |
| – Gross Shorts: | 93,451 | 85,252 | 33,811 |
| – Long to Short Ratio: | 0.2 to 1 | 2.1 to 1 | 0.6 to 1 |
| NET POSITION TREND: | | | |
| – COT Index Score (3 Year Range Pct): | 18.2 | 81.9 | 21.4 |
| – COT Index Reading (3 Year Range): | Bearish-Extreme | Bullish-Extreme | Bearish |
| NET POSITION MOVEMENT INDEX: | | | |
| – 6-Week Change in Strength Index: | 15.1 | -15.2 | 14.7 |
Swiss Franc Futures:
 The Swiss Franc large speculator standing this week reached a net position of -14,182 contracts in the data reported through Tuesday. This was a weekly decline of -2,806 contracts from the previous week which had a total of -11,376 net contracts.
This week’s current strength score (the trader positioning range over the past three years, measured from 0 to 100) shows the speculators are currently Bearish with a score of 45.2 percent. The commercials are Bullish with a score of 54.7 percent and the small traders (not shown in chart) are Bearish with a score of 42.8 percent.
| SWISS FRANC Statistics | SPECULATORS | COMMERCIALS | SMALL TRADERS |
| – Percent of Open Interest Longs: | 7.8 | 66.0 | 24.5 |
| – Percent of Open Interest Shorts: | 35.8 | 24.1 | 38.3 |
| – Net Position: | -14,182 | 21,175 | -6,993 |
| – Gross Longs: | 3,927 | 33,377 | 12,363 |
| – Gross Shorts: | 18,109 | 12,202 | 19,356 |
| – Long to Short Ratio: | 0.2 to 1 | 2.7 to 1 | 0.6 to 1 |
| NET POSITION TREND: | | | |
| – COT Index Score (3 Year Range Pct): | 45.2 | 54.7 | 42.8 |
| – COT Index Reading (3 Year Range): | Bearish | Bullish | Bearish |
| NET POSITION MOVEMENT INDEX: | | | |
| – 6-Week Change in Strength Index: | 6.0 | -13.7 | 25.7 |
Canadian Dollar Futures:
 The Canadian Dollar large speculator standing this week reached a net position of -14,075 contracts in the data reported through Tuesday. This was a weekly decrease of -10,940 contracts from the previous week which had a total of -3,135 net contracts.
This week’s current strength score (the trader positioning range over the past three years, measured from 0 to 100) shows the speculators are currently Bearish with a score of 43.3 percent. The commercials are Bullish with a score of 57.8 percent and the small traders (not shown in chart) are Bullish with a score of 53.2 percent.
| CANADIAN DOLLAR Statistics | SPECULATORS | COMMERCIALS | SMALL TRADERS |
| – Percent of Open Interest Longs: | 27.8 | 48.5 | 21.0 |
| – Percent of Open Interest Shorts: | 37.3 | 41.9 | 18.1 |
| – Net Position: | -14,075 | 9,851 | 4,224 |
| – Gross Longs: | 41,242 | 72,020 | 31,117 |
| – Gross Shorts: | 55,317 | 62,169 | 26,893 |
| – Long to Short Ratio: | 0.7 to 1 | 1.2 to 1 | 1.2 to 1 |
| NET POSITION TREND: | | | |
| – COT Index Score (3 Year Range Pct): | 43.3 | 57.8 | 53.2 |
| – COT Index Reading (3 Year Range): | Bearish | Bullish | Bullish |
| NET POSITION MOVEMENT INDEX: | | | |
| – 6-Week Change in Strength Index: | -2.6 | 11.1 | -21.9 |
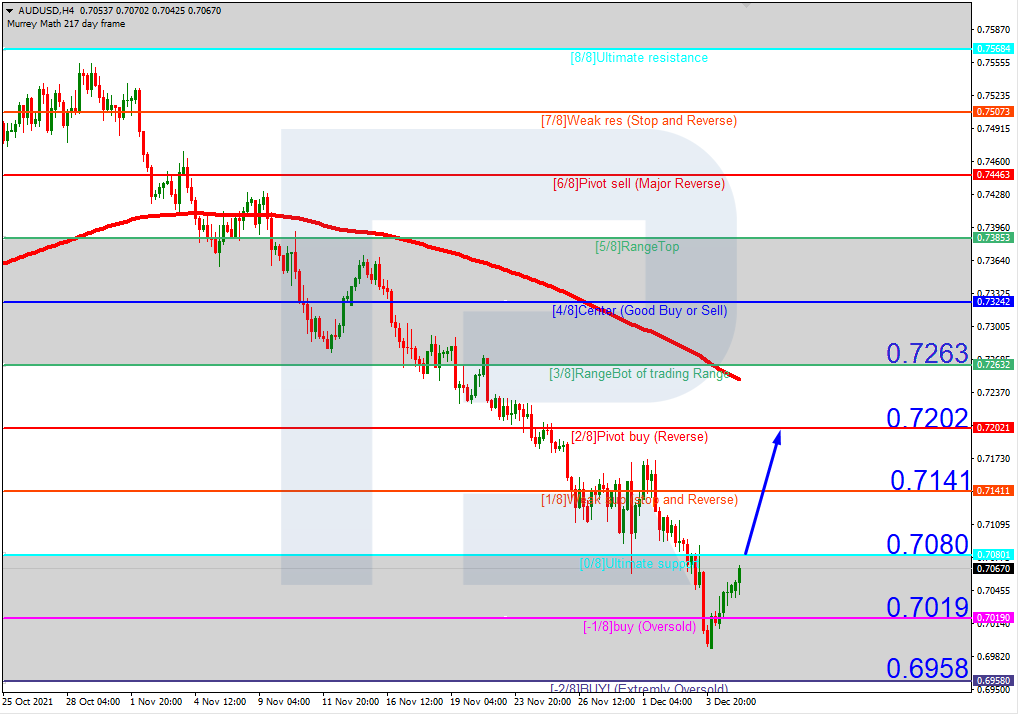
Australian Dollar Futures:
 The Australian Dollar large speculator standing this week reached a net position of -80,185 contracts in the data reported through Tuesday. This was a weekly decline of -16,920 contracts from the previous week which had a total of -63,265 net contracts.
This week’s current strength score (the trader positioning range over the past three years, measured from 0 to 100) shows the speculators are currently Bearish-Extreme with a score of 9.2 percent. The commercials are Bullish-Extreme with a score of 89.6 percent and the small traders (not shown in chart) are Bearish-Extreme with a score of 17.0 percent.
| AUSTRALIAN DOLLAR Statistics | SPECULATORS | COMMERCIALS | SMALL TRADERS |
| – Percent of Open Interest Longs: | 16.4 | 71.6 | 9.0 |
| – Percent of Open Interest Shorts: | 56.1 | 24.7 | 16.2 |
| – Net Position: | -80,185 | 94,709 | -14,524 |
| – Gross Longs: | 33,217 | 144,539 | 18,206 |
| – Gross Shorts: | 113,402 | 49,830 | 32,730 |
| – Long to Short Ratio: | 0.3 to 1 | 2.9 to 1 | 0.6 to 1 |
| NET POSITION TREND: | | | |
| – COT Index Score (3 Year Range Pct): | 9.2 | 89.6 | 17.0 |
| – COT Index Reading (3 Year Range): | Bearish-Extreme | Bullish-Extreme | Bearish-Extreme |
| NET POSITION MOVEMENT INDEX: | | | |
| – 6-Week Change in Strength Index: | -3.9 | 10.0 | -22.6 |
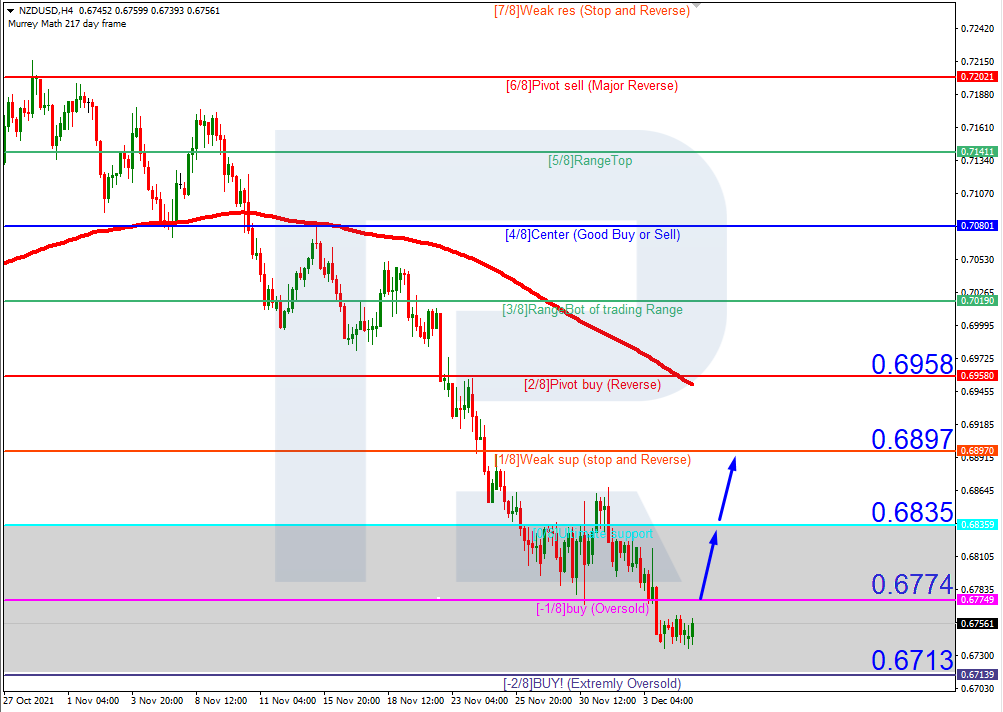
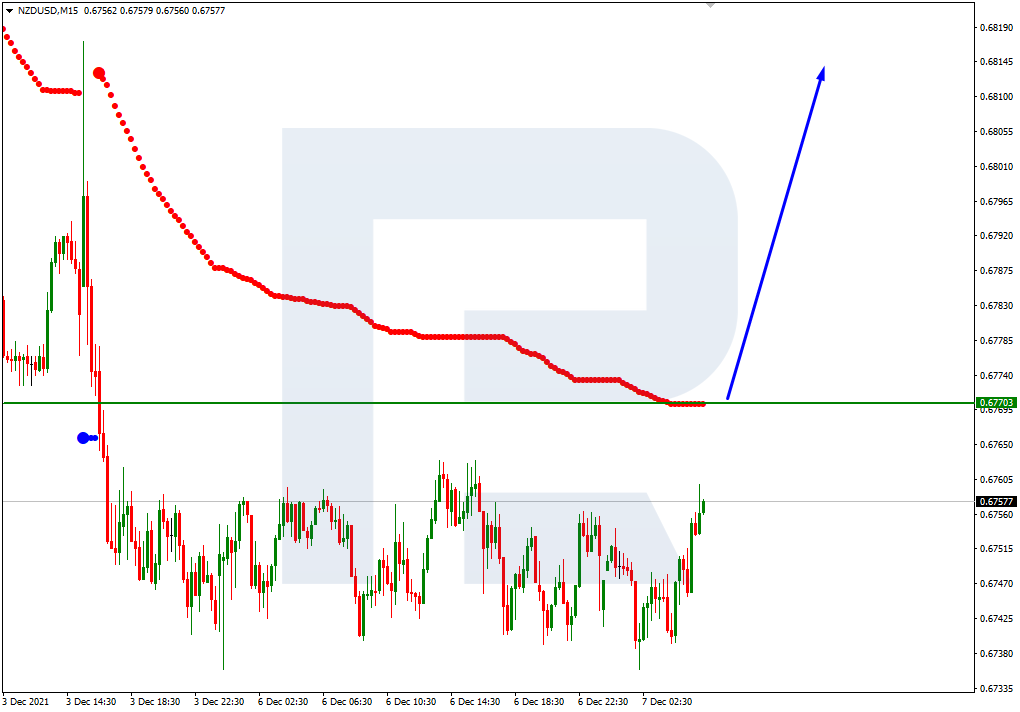
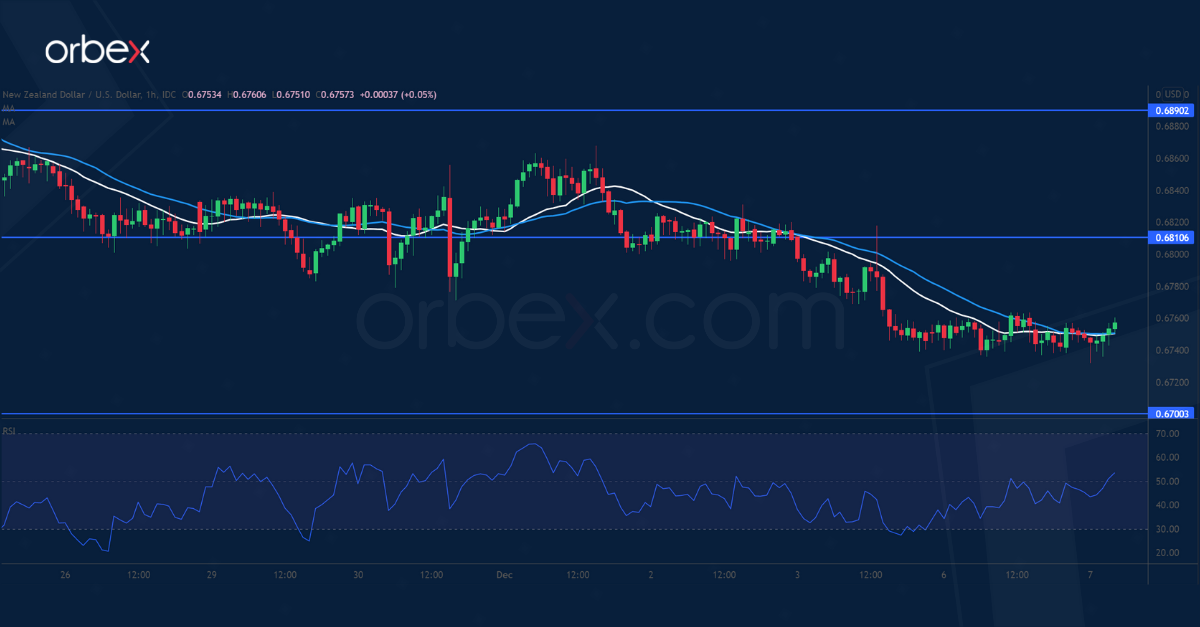
New Zealand Dollar Futures:
 The New Zealand Dollar large speculator standing this week reached a net position of 10,630 contracts in the data reported through Tuesday. This was a weekly decline of -3,309 contracts from the previous week which had a total of 13,939 net contracts.
This week’s current strength score (the trader positioning range over the past three years, measured from 0 to 100) shows the speculators are currently Bullish-Extreme with a score of 89.1 percent. The commercials are Bearish-Extreme with a score of 16.1 percent and the small traders (not shown in chart) are Bearish with a score of 36.6 percent.
| NEW ZEALAND DOLLAR Statistics | SPECULATORS | COMMERCIALS | SMALL TRADERS |
| – Percent of Open Interest Longs: | 61.6 | 29.1 | 6.3 |
| – Percent of Open Interest Shorts: | 40.1 | 47.9 | 8.9 |
| – Net Position: | 10,630 | -9,303 | -1,327 |
| – Gross Longs: | 30,465 | 14,387 | 3,098 |
| – Gross Shorts: | 19,835 | 23,690 | 4,425 |
| – Long to Short Ratio: | 1.5 to 1 | 0.6 to 1 | 0.7 to 1 |
| NET POSITION TREND: | | | |
| – COT Index Score (3 Year Range Pct): | 89.1 | 16.1 | 36.6 |
| – COT Index Reading (3 Year Range): | Bullish-Extreme | Bearish-Extreme | Bearish |
| NET POSITION MOVEMENT INDEX: | | | |
| – 6-Week Change in Strength Index: | 7.0 | -2.6 | -28.5 |
Mexican Peso Futures:
 The Mexican Peso large speculator standing this week reached a net position of -59,747 contracts in the data reported through Tuesday. This was a weekly decrease of -10,286 contracts from the previous week which had a total of -49,461 net contracts.
This week’s current strength score (the trader positioning range over the past three years, measured from 0 to 100) shows the speculators are currently Bearish-Extreme with a score of 0.0 percent. The commercials are Bullish-Extreme with a score of 100.0 percent and the small traders (not shown in chart) are Bearish with a score of 37.2 percent.
| MEXICAN PESO Statistics | SPECULATORS | COMMERCIALS | SMALL TRADERS |
| – Percent of Open Interest Longs: | 43.9 | 53.5 | 2.2 |
| – Percent of Open Interest Shorts: | 74.4 | 22.2 | 2.9 |
| – Net Position: | -59,747 | 61,120 | -1,373 |
| – Gross Longs: | 85,840 | 104,613 | 4,237 |
| – Gross Shorts: | 145,587 | 43,493 | 5,610 |
| – Long to Short Ratio: | 0.6 to 1 | 2.4 to 1 | 0.8 to 1 |
| NET POSITION TREND: | | | |
| – COT Index Score (3 Year Range Pct): | 0.0 | 100.0 | 37.2 |
| – COT Index Reading (3 Year Range): | Bearish-Extreme | Bullish-Extreme | Bearish |
| NET POSITION MOVEMENT INDEX: | | | |
| – 6-Week Change in Strength Index: | -9.2 | 10.5 | -14.8 |
Brazilian Real Futures:
 The Brazilian Real large speculator standing this week reached a net position of -13,842 contracts in the data reported through Tuesday. This was a weekly boost of 962 contracts from the previous week which had a total of -14,804 net contracts.
This week’s current strength score (the trader positioning range over the past three years, measured from 0 to 100) shows the speculators are currently Bullish with a score of 50.1 percent. The commercials are Bullish with a score of 53.5 percent and the small traders (not shown in chart) are Bullish with a score of 52.0 percent.
| BRAZIL REAL Statistics | SPECULATORS | COMMERCIALS | SMALL TRADERS |
| – Percent of Open Interest Longs: | 25.6 | 68.6 | 5.0 |
| – Percent of Open Interest Shorts: | 59.3 | 32.0 | 8.0 |
| – Net Position: | -13,842 | 15,065 | -1,223 |
| – Gross Longs: | 10,531 | 28,205 | 2,060 |
| – Gross Shorts: | 24,373 | 13,140 | 3,283 |
| – Long to Short Ratio: | 0.4 to 1 | 2.1 to 1 | 0.6 to 1 |
| NET POSITION TREND: | | | |
| – COT Index Score (3 Year Range Pct): | 50.1 | 53.5 | 52.0 |
| – COT Index Reading (3 Year Range): | Bullish | Bullish | Bullish |
| NET POSITION MOVEMENT INDEX: | | | |
| – 6-Week Change in Strength Index: | -17.6 | 20.2 | -24.1 |
Russian Ruble Futures:
 The Russian Ruble large speculator standing this week reached a net position of 13,637 contracts in the data reported through Tuesday. This was a weekly decline of -4,427 contracts from the previous week which had a total of 18,064 net contracts.
This week’s current strength score (the trader positioning range over the past three years, measured from 0 to 100) shows the speculators are currently Bearish with a score of 45.7 percent. The commercials are Bearish with a score of 49.7 percent and the small traders (not shown in chart) are Bullish-Extreme with a score of 88.8 percent.
| RUSSIAN RUBLE Statistics | SPECULATORS | COMMERCIALS | SMALL TRADERS |
| – Percent of Open Interest Longs: | 41.7 | 52.1 | 6.1 |
| – Percent of Open Interest Shorts: | 14.4 | 83.5 | 2.1 |
| – Net Position: | 13,637 | -15,633 | 1,996 |
| – Gross Longs: | 20,814 | 25,998 | 3,042 |
| – Gross Shorts: | 7,177 | 41,631 | 1,046 |
| – Long to Short Ratio: | 2.9 to 1 | 0.6 to 1 | 2.9 to 1 |
| NET POSITION TREND: | | | |
| – COT Index Score (3 Year Range Pct): | 45.7 | 49.7 | 88.8 |
| – COT Index Reading (3 Year Range): | Bearish | Bearish | Bullish-Extreme |
| NET POSITION MOVEMENT INDEX: | | | |
| – 6-Week Change in Strength Index: | -20.2 | 20.0 | -4.7 |
Bitcoin Futures:
 The Bitcoin large speculator standing this week reached a net position of -1,691 contracts in the data reported through Tuesday. This was a weekly decline of -1,531 contracts from the previous week which had a total of -160 net contracts.
This week’s current strength score (the trader positioning range over the past three years, measured from 0 to 100) shows the speculators are currently Bullish with a score of 63.7 percent. The commercials are Bullish-Extreme with a score of 97.0 percent and the small traders (not shown in chart) are Bearish with a score of 35.5 percent.
| BITCOIN Statistics | SPECULATORS | COMMERCIALS | SMALL TRADERS |
| – Percent of Open Interest Longs: | 72.2 | 6.2 | 13.7 |
| – Percent of Open Interest Shorts: | 85.0 | 1.0 | 6.2 |
| – Net Position: | -1,691 | 697 | 994 |
| – Gross Longs: | 9,526 | 823 | 1,811 |
| – Gross Shorts: | 11,217 | 126 | 817 |
| – Long to Short Ratio: | 0.8 to 1 | 6.5 to 1 | 2.2 to 1 |
| NET POSITION TREND: | | | |
| – COT Index Score (3 Year Range Pct): | 63.7 | 97.0 | 35.5 |
| – COT Index Reading (3 Year Range): | Bullish | Bullish-Extreme | Bearish |
| NET POSITION MOVEMENT INDEX: | | | |
| – 6-Week Change in Strength Index: | 27.0 | 43.0 | -36.5 |
Article By InvestMacro – Receive our weekly COT Reports by Email
*COT Report: The COT data, released weekly to the public each Friday, is updated through the most recent Tuesday (data is 3 days old) and shows a quick view of how large speculators or non-commercials (for-profit traders) were positioned in the futures markets.
The CFTC categorizes trader positions according to commercial hedgers (traders who use futures contracts for hedging as part of the business), non-commercials (large traders who speculate to realize trading profits) and nonreportable traders (usually small traders/speculators) as well as their open interest (contracts open in the market at time of reporting).See CFTC criteria here.


