
Article By RoboForex.com
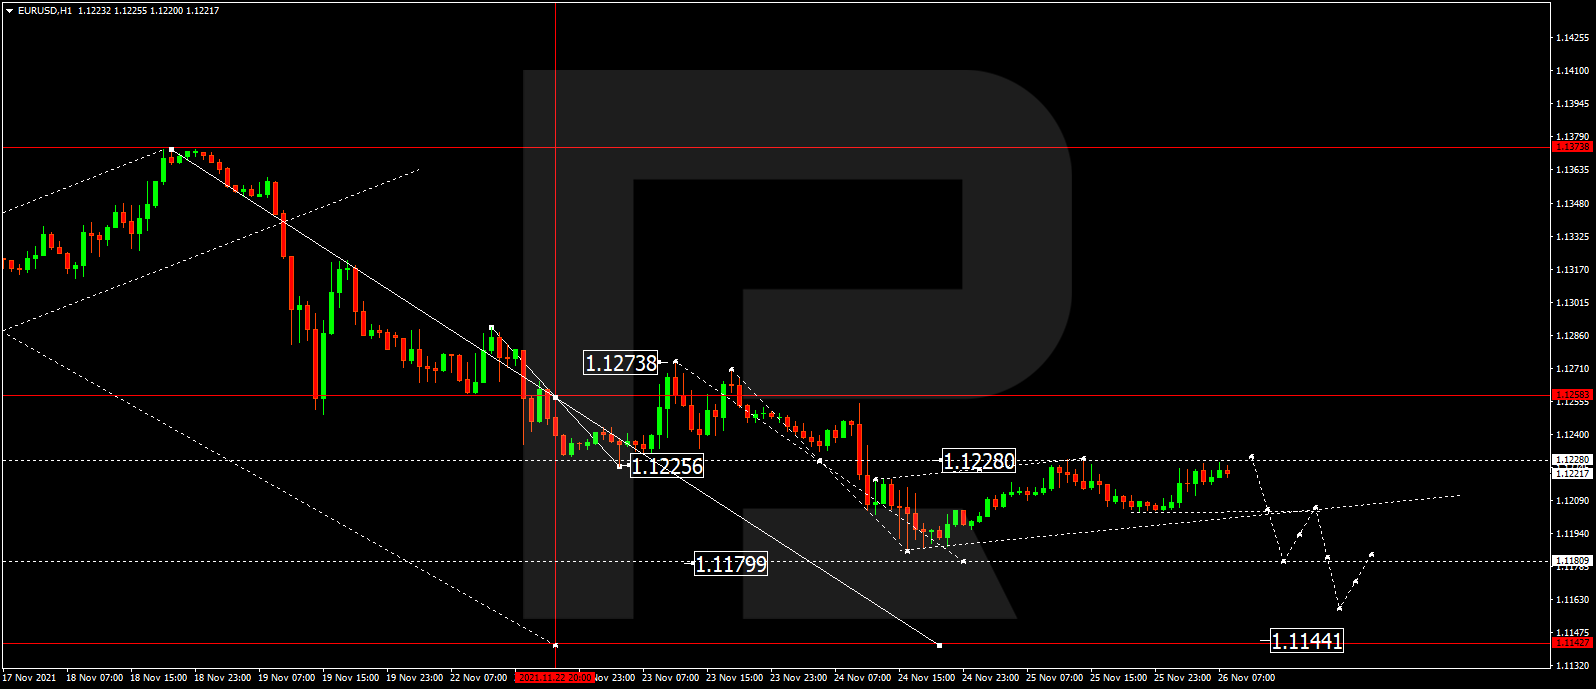
EURUSD, “Euro vs US Dollar”
After completing the correctional wave at 1.1228, EURUSD is consolidating below this level. If later the price breaks this range to the downside, the market may resume trading downwards to reach 1.1180; if to the upside – continue the correction with the target at 1.1257.

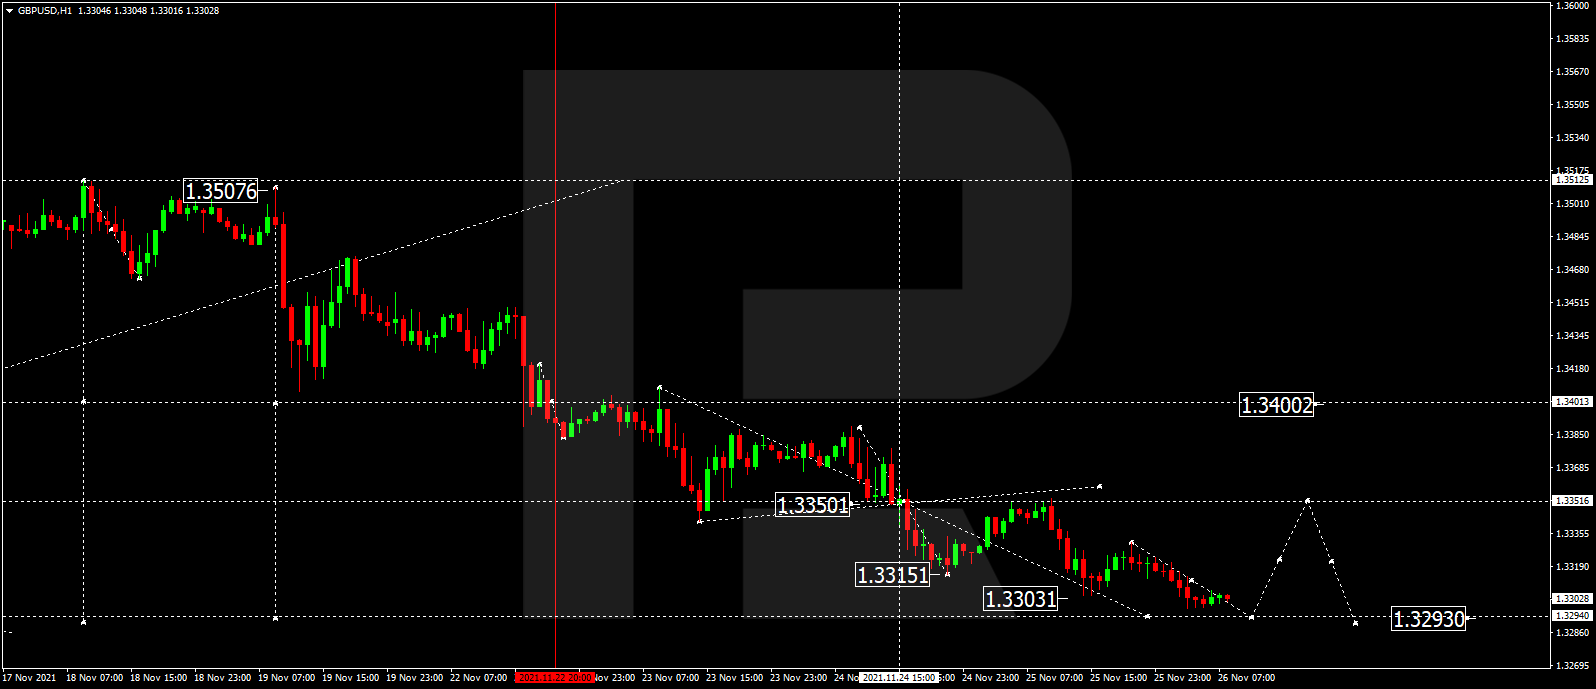
GBPUSD, “Great Britain Pound vs US Dollar”
GBPUSD is still falling towards 1.3295. Later, the market may start a new correction to reach 1.3350 and then resume trading downwards with the target at 1.3290.
Free Reports:
 Sign Up for Our Stock Market Newsletter – Get updated on News, Charts & Rankings of Public Companies when you join our Stocks Newsletter
 Get our Weekly Commitment of Traders Reports - See where the biggest traders (Hedge Funds and Commercial Hedgers) are positioned in the futures markets on a weekly basis.
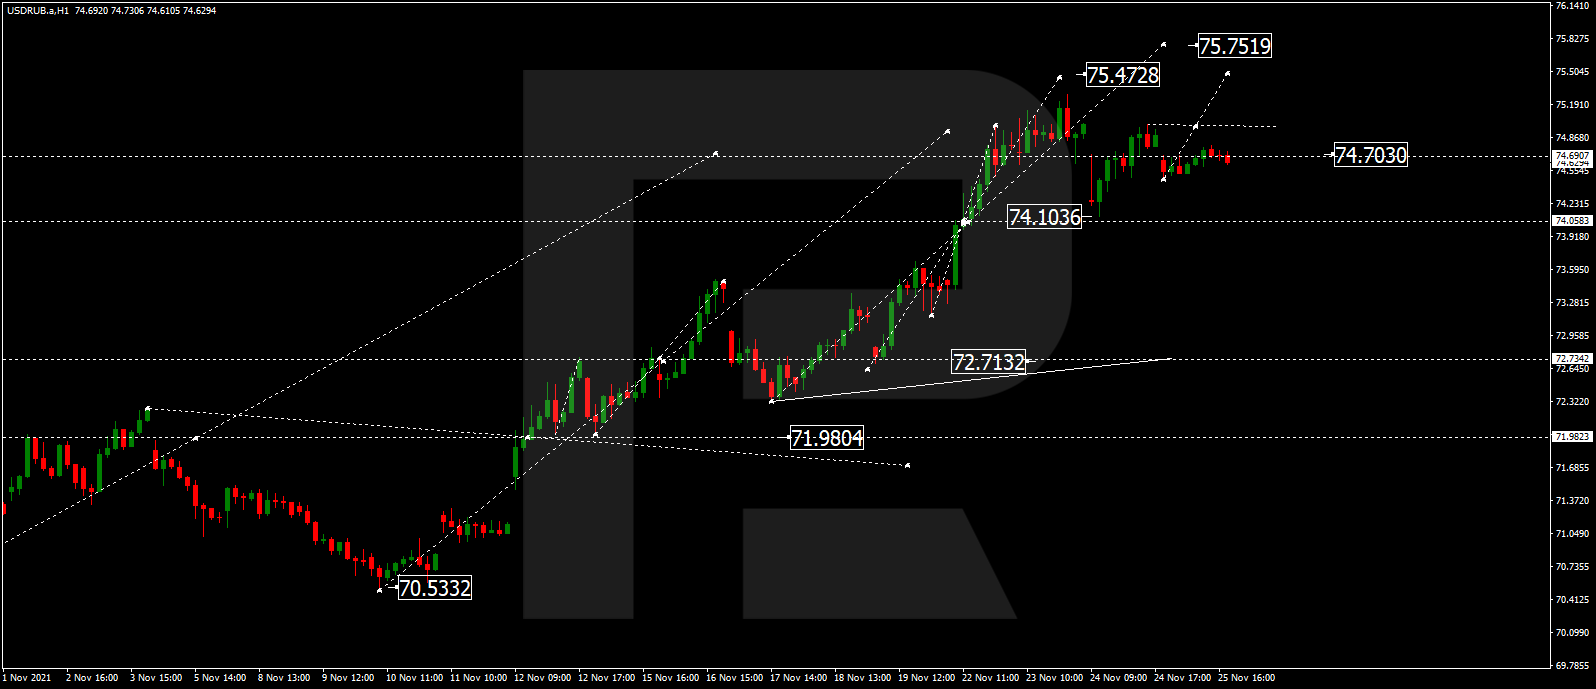
USDRUB, “US Dollar vs Russian Ruble”
USDRUB is still consolidating around 74.70. If later the price breaks this range to the downside, the market may resume trading downwards to reach 74.00; if to the upside – form one more ascending structure with the target at 75.50.
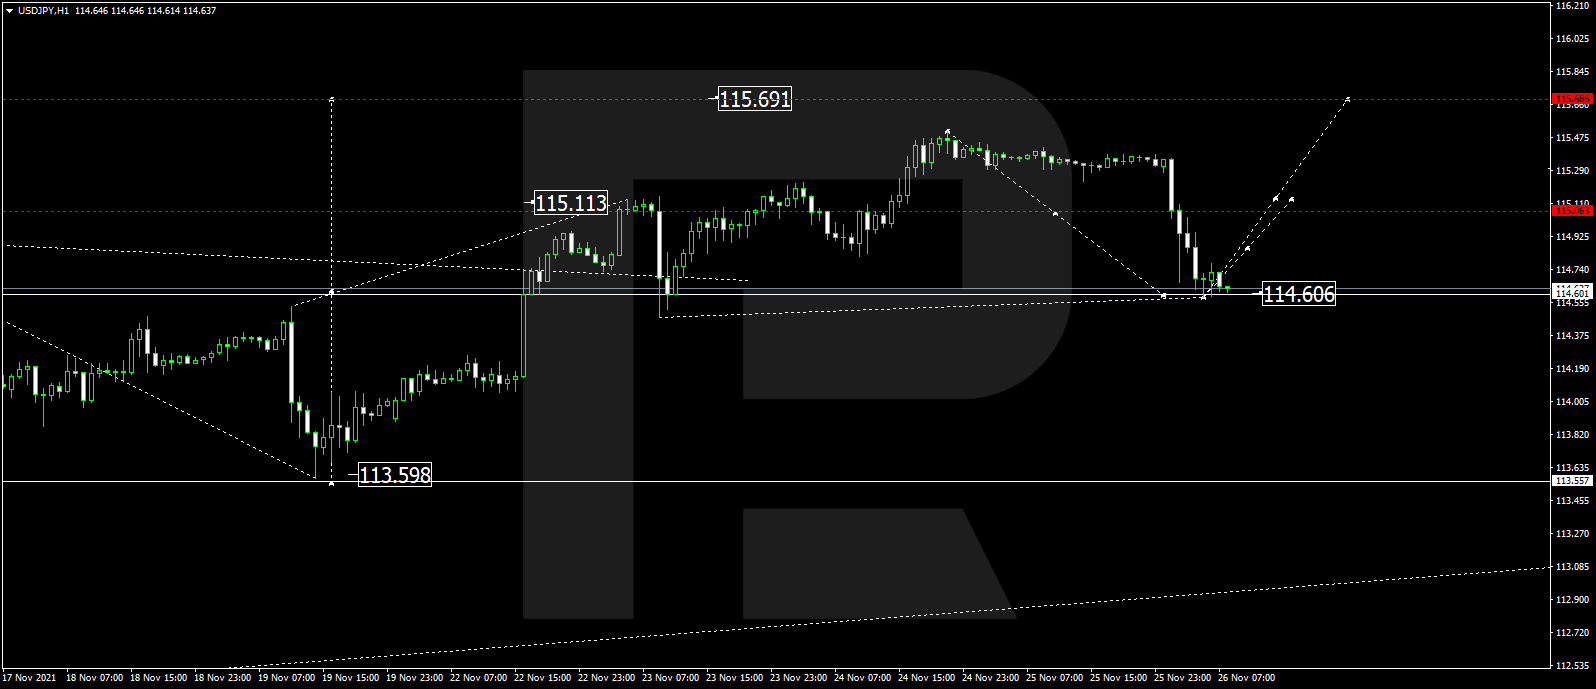
USDJPY, “US Dollar vs Japanese Yen”
USDJPY has finished the correctional wave at 114.60. Possibly, the pair may start a new growth with the target at 115.70 and then resume falling to reach 114.50.
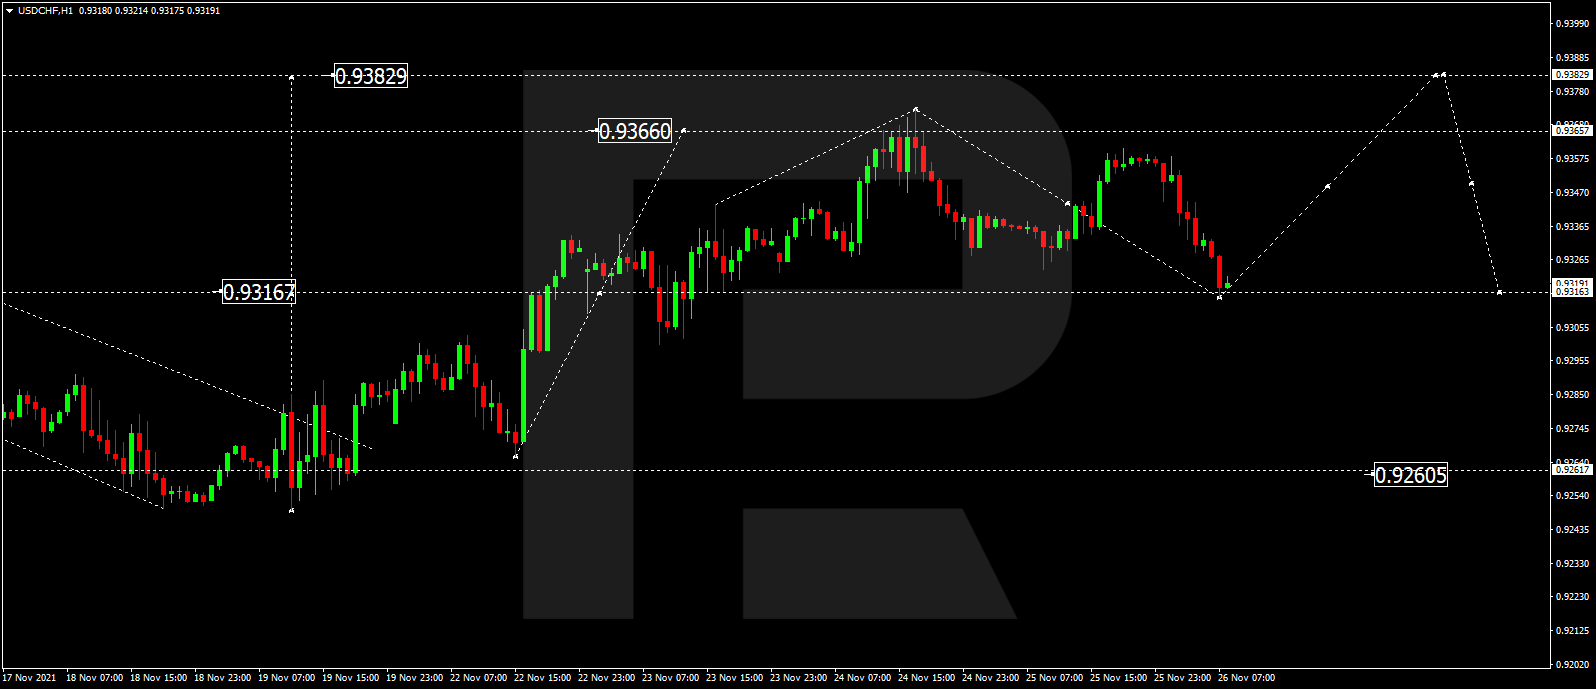
USDCHF, “US Dollar vs Swiss Franc”
After completing the correction at 0.9316, USDCHF is expected to grow and reach 0.9383. Later, the market may start another decline with the target at 0.9315.
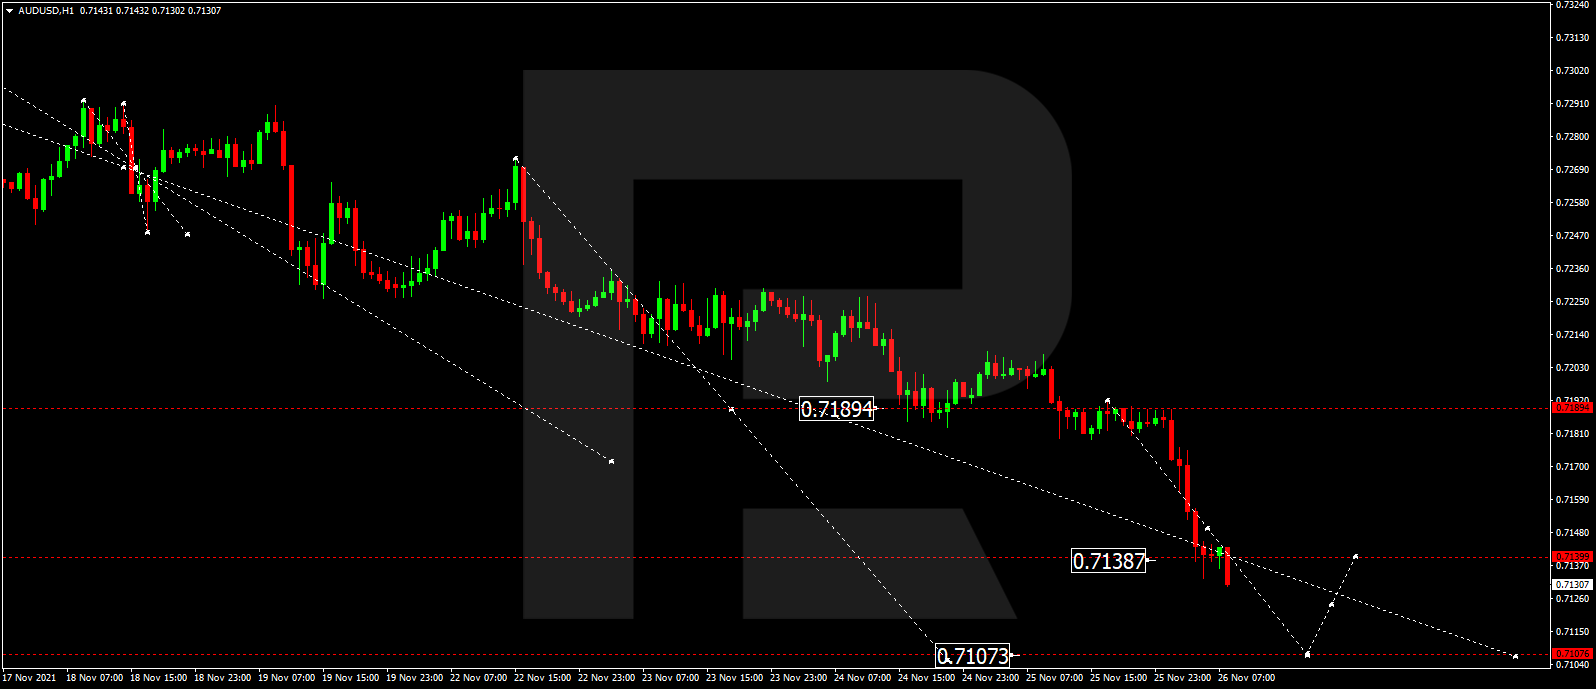
AUDUSD, “Australian Dollar vs US Dollar”
After forming a new consolidation range around 0.7190 and breaking it to the downside, AUDUSD has completed the descending wave at 0.7138. Possibly, today the pair may continue trading downwards with the target at 0.7107.
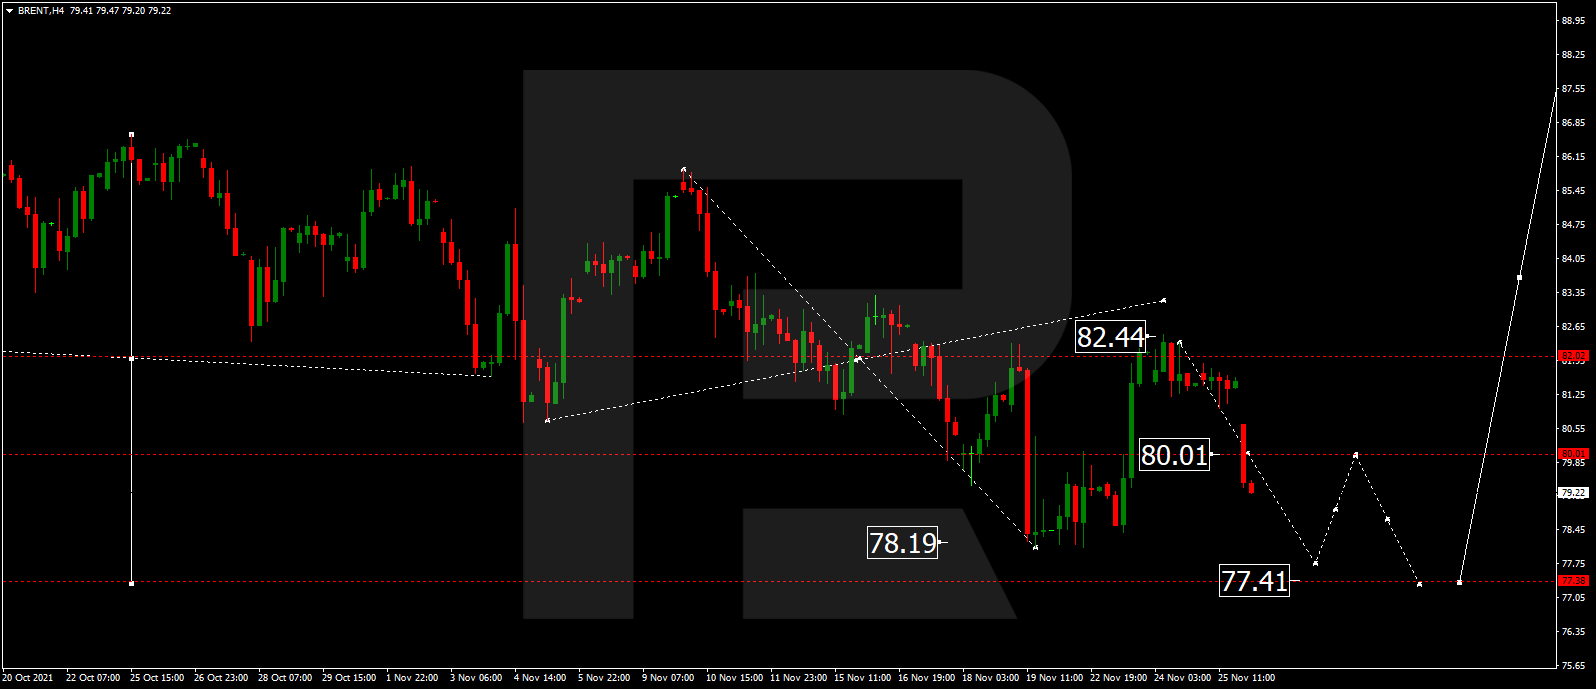
BRENT
After breaking the consolidation range to the downside, Brent is expected to continue falling towards 78.00. Later, the market may grow to reach 80.00 and then resume trading downwards with the target at 77.40.
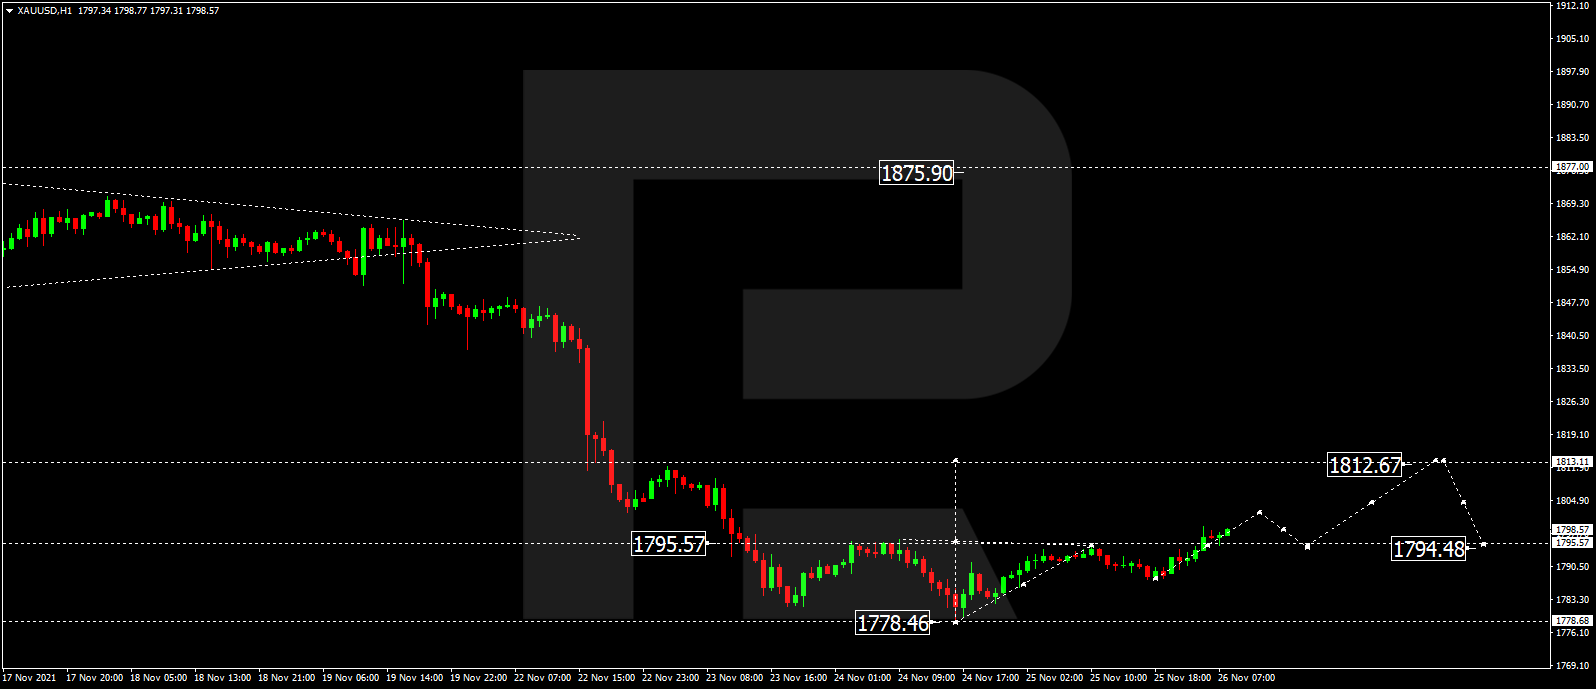
XAUUSD, “Gold vs US Dollar”
Gold has completed the ascending wave at 1800.80. Today, the metal may resume trading downwards to reach 1789.0 and then form one more ascending structure with the target at 1813.30.
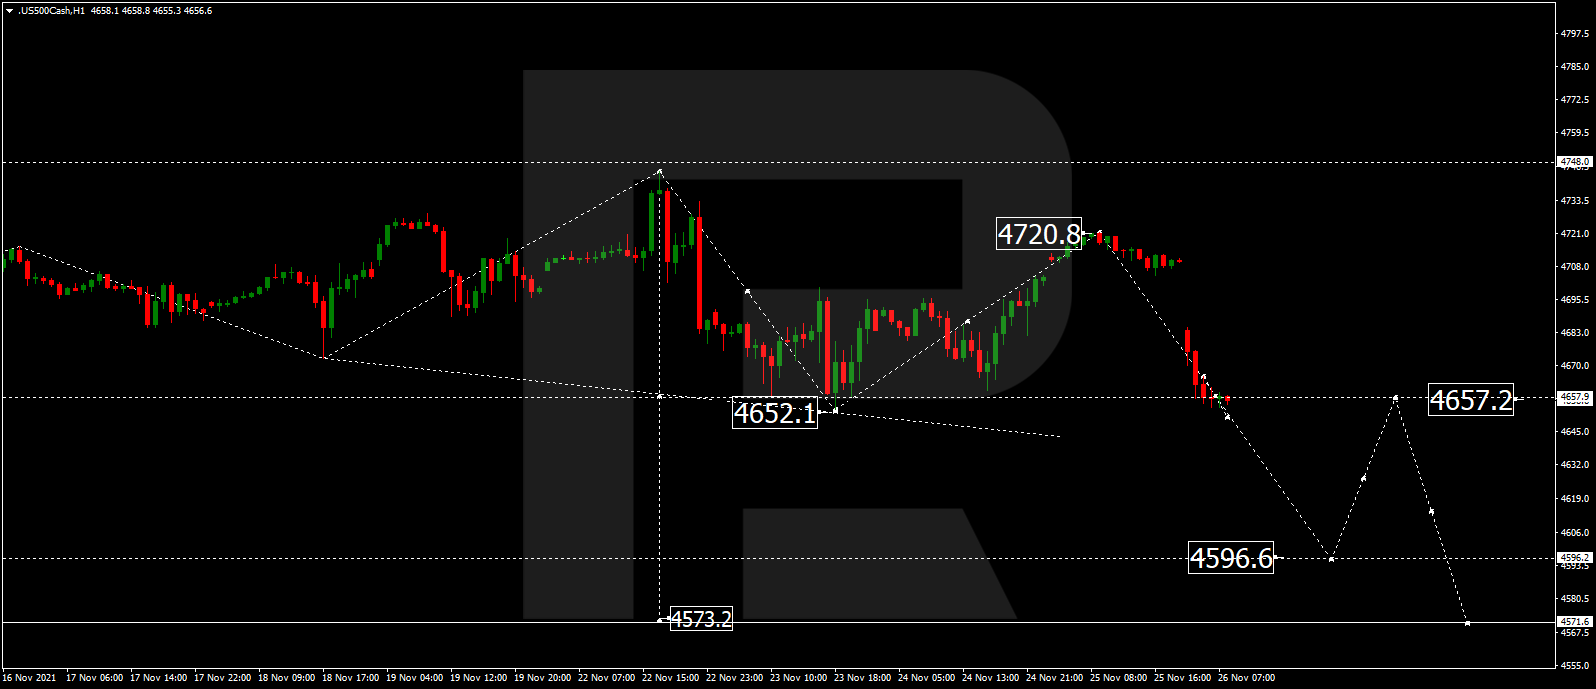
S&P 500
After rebounding from 4720.0 to the downside, the S&P index has completed the descending structure at 4652.0; right now, it is consolidating around the latter level. If later the price breaks this range to the downside, the market may resume trading downwards 4596.6.
Article By RoboForex.com
Attention!
Forecasts presented in this section only reflect the author’s private opinion and should not be considered as guidance for trading. RoboForex LP bears no responsibility for trading results based on trading recommendations described in these analytical reviews.

- Oil prices jumped 4% amid a new wave of escalation between the US and Iran Jul 13, 2026
- EUR/USD: US Inflation Will Determine Everything Jul 13, 2026
- COT Metals Charts: Weekly Speculator Bets see small gains for Silver & Gold Jul 12, 2026
- COT Bonds Charts: Speculator Bets led by SOFR 3-Months & 2-Year Bonds Jul 12, 2026
- COT Energy Charts: Weekly Speculator Changes led by Brent Oil Jul 12, 2026
- COT Soft Commodities Charts: Weekly Speculator Changes led by Sugar, Corn & Soybeans Jul 12, 2026
- The US and European stock indices are rising again amid renewed investor interest in the AI industry. Jul 10, 2026
- USD/JPY Falls as Yen Recovers Weekly Losses Jul 10, 2026
- Crude oil prices surged sharply by 7% in reaction to the rapid escalation of the conflict in the Middle East Jul 9, 2026
- Middle East Tensions Weigh on Gold Jul 9, 2026