
By InvestMacro | COT | Data Tables | COT Leaders | Downloads | COT Newsletter
Here are the latest charts and statistics for the Commitment of Traders (COT) data published by the Commodities Futures Trading Commission (CFTC) on Monday due to the Thanksgiving holiday last week.
The latest COT data is updated through Tuesday November 23rd 2021 and shows a quick view of how large traders (for-profit speculators and commercial entities) were positioned in the futures markets. All currency positions are in direct relation to the US dollar where, for example, a bet for the euro is a bet that the euro will rise versus the dollar while a bet against the euro will be a bet that the euro will decline versus the dollar.
Highlighting last week’s currency data is the US Dollar Index speculator bets continuing to climb higher. The Dollar Index positions rose for the third time in the past four weeks and have now increased for twenty out of the past twenty-three weeks as the net position has risen by a total of 38,078 contracts over that period. The dollar positioning has been over the +34,000 contract level for seven weeks in a row and if the position hits above +40,000 contracts, it would mark the first time since October of 2019 to hit that threshold. The Dollar Index strength index (compared to its three year range of positioning) remains in extreme bullish territory (over 80 percent) at an 87.5 score and has now been above 80 percent for eight consecutive weeks. The last time the Dollar Index had registered a bullish extreme level was also in October of 2019 when it rose as high as 94.5 percent before cooling off.
| Nov-23-2021 | OI | OI-Index | Spec-Net | Spec-Index | Com-Net | COM-Index | Smalls-Net | Smalls-Index |
|---|---|---|---|---|---|---|---|---|
| USD Index | 57,694 | 84 | 35,775 | 87 | -41,146 | 6 | 5,371 | 75 |
| EUR | 711,685 | 88 | -16,452 | 30 | -16,835 | 71 | 33,287 | 30 |
| GBP | 213,313 | 47 | -34,579 | 49 | 45,803 | 57 | -11,224 | 32 |
| JPY | 251,801 | 90 | -97,253 | 8 | 116,225 | 94 | -18,972 | 9 |
| CHF | 52,412 | 31 | -11,376 | 50 | 21,522 | 55 | -10,146 | 34 |
| CAD | 150,275 | 30 | -3,135 | 52 | -11,397 | 45 | 14,532 | 69 |
| AUD | 188,033 | 74 | -63,265 | 25 | 73,423 | 74 | -10,158 | 28 |
| NZD | 44,524 | 33 | 13,939 | 95 | -14,860 | 7 | 921 | 62 |
| MXN | 184,243 | 40 | -49,461 | 1 | 50,588 | 100 | -1,127 | 38 |
| RUB | 51,535 | 56 | 18,064 | 56 | -19,323 | 41 | 1,259 | 69 |
| BRL | 34,375 | 36 | -14,804 | 49 | 15,360 | 54 | -556 | 60 |
| Bitcoin | 14,357 | 83 | -160 | 100 | 729 | 0 | -569 | 0 |
US Dollar Index Futures:
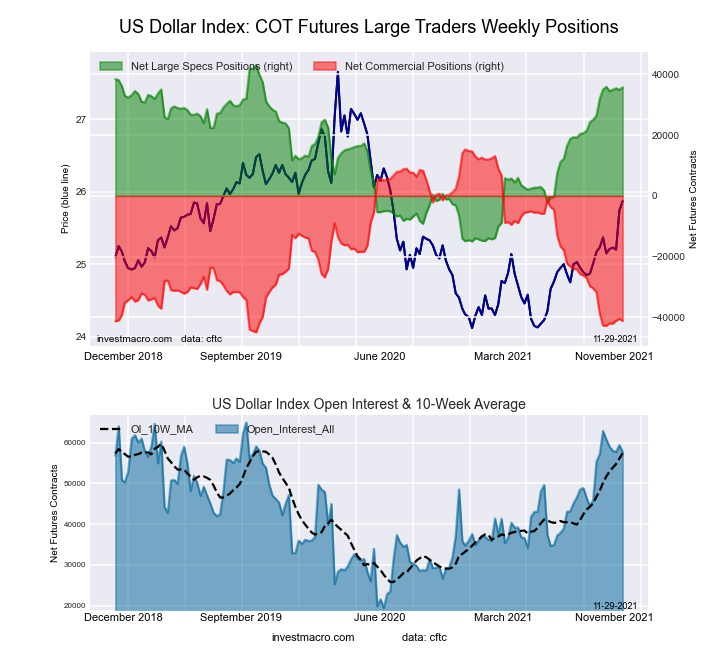 The US Dollar Index large speculator standing this week recorded a net position of 35,775 contracts in the data reported through Tuesday. This was a weekly boost of 867 contracts from the previous week which had a total of 34,908 net contracts.
Free Reports:
 Sign Up for Our Stock Market Newsletter – Get updated on News, Charts & Rankings of Public Companies when you join our Stocks Newsletter
 Get our Weekly Commitment of Traders Reports - See where the biggest traders (Hedge Funds and Commercial Hedgers) are positioned in the futures markets on a weekly basis.
This week’s current strength score (the trader positioning range over the past three years, measured from 0 to 100) shows the speculators are currently Bullish-Extreme with a score of 87.5 percent. The commercials are Bearish-Extreme with a score of 6.2 percent and the small traders (not shown in chart) are Bullish with a score of 75.3 percent.
| US DOLLAR INDEX Statistics | SPECULATORS | COMMERCIALS | SMALL TRADERS |
| – Percent of Open Interest Longs: | 81.7 | 3.0 | 12.8 |
| – Percent of Open Interest Shorts: | 19.7 | 74.3 | 3.4 |
| – Net Position: | 35,775 | -41,146 | 5,371 |
| – Gross Longs: | 47,116 | 1,739 | 7,357 |
| – Gross Shorts: | 11,341 | 42,885 | 1,986 |
| – Long to Short Ratio: | 4.2 to 1 | 0.0 to 1 | 3.7 to 1 |
| NET POSITION TREND: | |||
| – COT Index Score (3 Year Range Pct): | 87.5 | 6.2 | 75.3 |
| – COT Index Reading (3 Year Range): | Bullish-Extreme | Bearish-Extreme | Bullish |
| NET POSITION MOVEMENT INDEX: | |||
| – 6-Week Change in Strength Index: | 1.2 | 2.6 | -24.7 |
Euro Currency Futures:
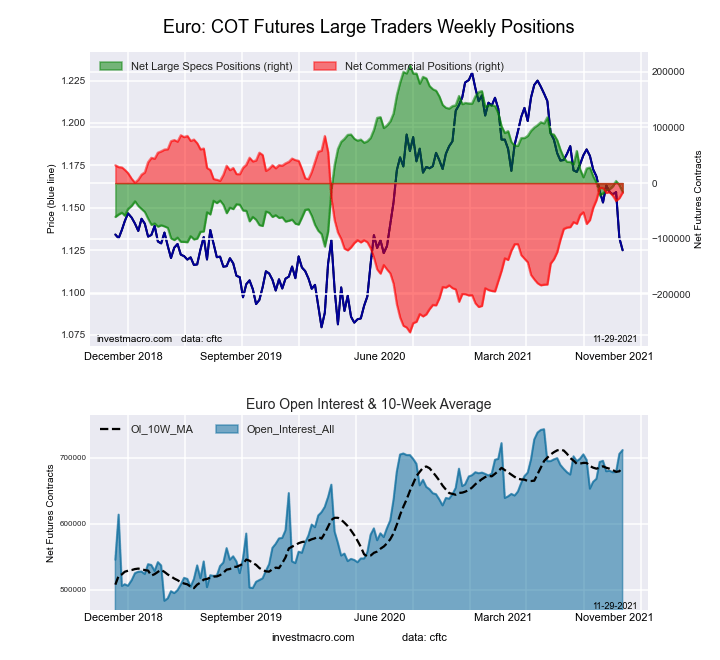 The Euro Currency large speculator standing this week recorded a net position of -16,452 contracts in the data reported through Tuesday. This was a weekly decrease of -12,626 contracts from the previous week which had a total of -3,826 net contracts.
This week’s current strength score (the trader positioning range over the past three years, measured from 0 to 100) shows the speculators are currently Bearish with a score of 29.9 percent. The commercials are Bullish with a score of 71.0 percent and the small traders (not shown in chart) are Bearish with a score of 29.5 percent.
| EURO Currency Statistics | SPECULATORS | COMMERCIALS | SMALL TRADERS |
| – Percent of Open Interest Longs: | 28.7 | 56.7 | 12.7 |
| – Percent of Open Interest Shorts: | 31.0 | 59.1 | 8.1 |
| – Net Position: | -16,452 | -16,835 | 33,287 |
| – Gross Longs: | 204,214 | 403,595 | 90,690 |
| – Gross Shorts: | 220,666 | 420,430 | 57,403 |
| – Long to Short Ratio: | 0.9 to 1 | 1.0 to 1 | 1.6 to 1 |
| NET POSITION TREND: | |||
| – COT Index Score (3 Year Range Pct): | 29.9 | 71.0 | 29.5 |
| – COT Index Reading (3 Year Range): | Bearish | Bullish | Bearish |
| NET POSITION MOVEMENT INDEX: | |||
| – 6-Week Change in Strength Index: | 0.6 | -2.2 | 9.8 |
British Pound Sterling Futures:
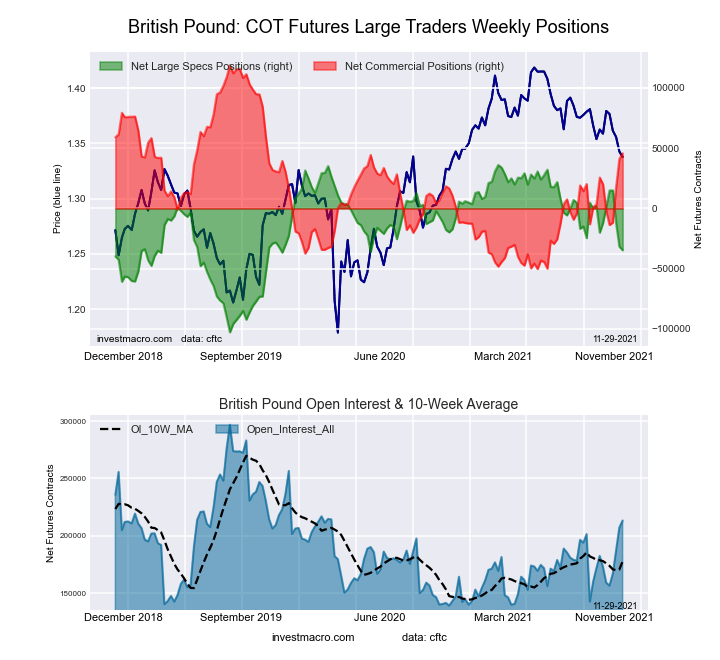 The British Pound Sterling large speculator standing this week recorded a net position of -34,579 contracts in the data reported through Tuesday. This was a weekly decline of -2,980 contracts from the previous week which had a total of -31,599 net contracts.
This week’s current strength score (the trader positioning range over the past three years, measured from 0 to 100) shows the speculators are currently Bearish with a score of 49.1 percent. The commercials are Bullish with a score of 56.8 percent and the small traders (not shown in chart) are Bearish with a score of 32.4 percent.
| BRITISH POUND Statistics | SPECULATORS | COMMERCIALS | SMALL TRADERS |
| – Percent of Open Interest Longs: | 23.5 | 62.8 | 10.5 |
| – Percent of Open Interest Shorts: | 39.7 | 41.3 | 15.8 |
| – Net Position: | -34,579 | 45,803 | -11,224 |
| – Gross Longs: | 50,122 | 133,888 | 22,470 |
| – Gross Shorts: | 84,701 | 88,085 | 33,694 |
| – Long to Short Ratio: | 0.6 to 1 | 1.5 to 1 | 0.7 to 1 |
| NET POSITION TREND: | |||
| – COT Index Score (3 Year Range Pct): | 49.1 | 56.8 | 32.4 |
| – COT Index Reading (3 Year Range): | Bearish | Bullish | Bearish |
| NET POSITION MOVEMENT INDEX: | |||
| – 6-Week Change in Strength Index: | -16.3 | 15.1 | -6.2 |
Japanese Yen Futures:
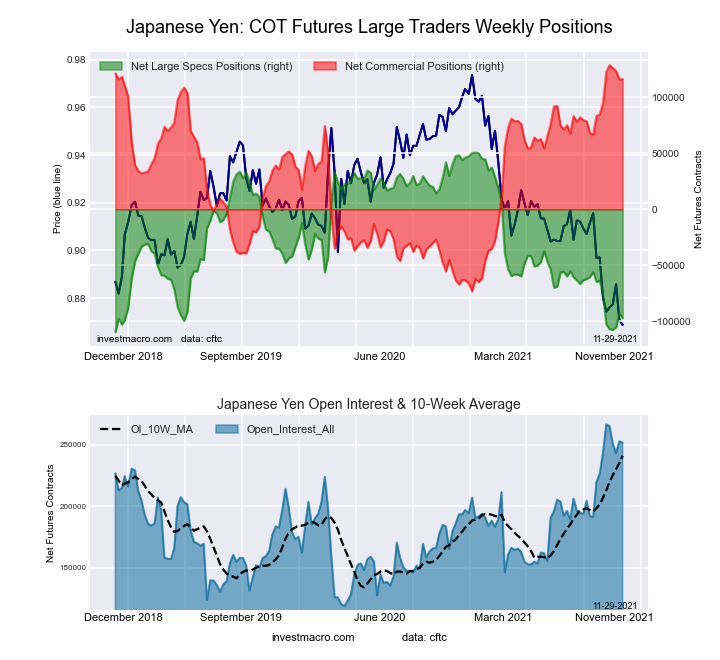 The Japanese Yen large speculator standing this week recorded a net position of -97,253 contracts in the data reported through Tuesday. This was a weekly decline of -4,127 contracts from the previous week which had a total of -93,126 net contracts.
This week’s current strength score (the trader positioning range over the past three years, measured from 0 to 100) shows the speculators are currently Bearish-Extreme with a score of 7.8 percent. The commercials are Bullish-Extreme with a score of 93.9 percent and the small traders (not shown in chart) are Bearish-Extreme with a score of 8.8 percent.
| JAPANESE YEN Statistics | SPECULATORS | COMMERCIALS | SMALL TRADERS |
| – Percent of Open Interest Longs: | 8.1 | 81.8 | 8.9 |
| – Percent of Open Interest Shorts: | 46.7 | 35.6 | 16.4 |
| – Net Position: | -97,253 | 116,225 | -18,972 |
| – Gross Longs: | 20,285 | 205,923 | 22,338 |
| – Gross Shorts: | 117,538 | 89,698 | 41,310 |
| – Long to Short Ratio: | 0.2 to 1 | 2.3 to 1 | 0.5 to 1 |
| NET POSITION TREND: | |||
| – COT Index Score (3 Year Range Pct): | 7.8 | 93.9 | 8.8 |
| – COT Index Reading (3 Year Range): | Bearish-Extreme | Bullish-Extreme | Bearish-Extreme |
| NET POSITION MOVEMENT INDEX: | |||
| – 6-Week Change in Strength Index: | -12.9 | 10.5 | -1.1 |
Swiss Franc Futures:
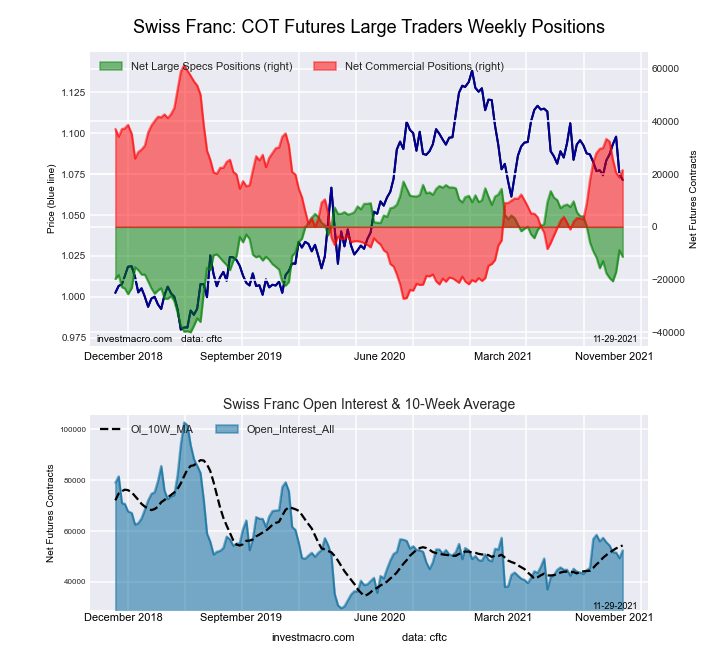 The Swiss Franc large speculator standing this week recorded a net position of -11,376 contracts in the data reported through Tuesday. This was a weekly fall of -2,487 contracts from the previous week which had a total of -8,889 net contracts.
This week’s current strength score (the trader positioning range over the past three years, measured from 0 to 100) shows the speculators are currently Bullish with a score of 50.1 percent. The commercials are Bullish with a score of 55.1 percent and the small traders (not shown in chart) are Bearish with a score of 33.5 percent.
| SWISS FRANC Statistics | SPECULATORS | COMMERCIALS | SMALL TRADERS |
| – Percent of Open Interest Longs: | 11.9 | 65.6 | 22.3 |
| – Percent of Open Interest Shorts: | 33.6 | 24.6 | 41.7 |
| – Net Position: | -11,376 | 21,522 | -10,146 |
| – Gross Longs: | 6,241 | 34,403 | 11,695 |
| – Gross Shorts: | 17,617 | 12,881 | 21,841 |
| – Long to Short Ratio: | 0.4 to 1 | 2.7 to 1 | 0.5 to 1 |
| NET POSITION TREND: | |||
| – COT Index Score (3 Year Range Pct): | 50.1 | 55.1 | 33.5 |
| – COT Index Reading (3 Year Range): | Bullish | Bullish | Bearish |
| NET POSITION MOVEMENT INDEX: | |||
| – 6-Week Change in Strength Index: | 2.8 | -9.5 | 20.1 |
Canadian Dollar Futures:
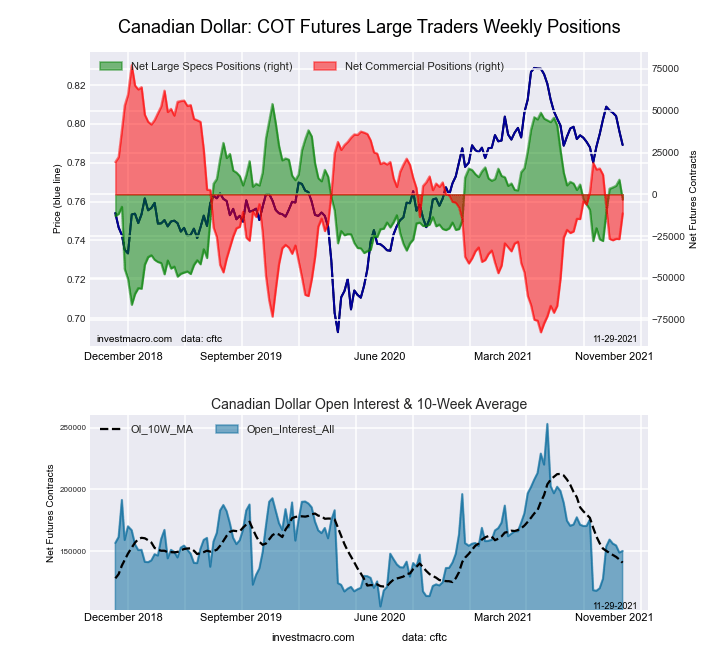 The Canadian Dollar large speculator standing this week recorded a net position of -3,135 contracts in the data reported through Tuesday. This was a weekly decline of -11,844 contracts from the previous week which had a total of 8,709 net contracts.
This week’s current strength score (the trader positioning range over the past three years, measured from 0 to 100) shows the speculators are currently Bullish with a score of 52.4 percent. The commercials are Bearish with a score of 44.5 percent and the small traders (not shown in chart) are Bullish with a score of 68.7 percent.
| CANADIAN DOLLAR Statistics | SPECULATORS | COMMERCIALS | SMALL TRADERS |
| – Percent of Open Interest Longs: | 29.5 | 44.0 | 24.7 |
| – Percent of Open Interest Shorts: | 31.6 | 51.6 | 15.0 |
| – Net Position: | -3,135 | -11,397 | 14,532 |
| – Gross Longs: | 44,320 | 66,164 | 37,111 |
| – Gross Shorts: | 47,455 | 77,561 | 22,579 |
| – Long to Short Ratio: | 0.9 to 1 | 0.9 to 1 | 1.6 to 1 |
| NET POSITION TREND: | |||
| – COT Index Score (3 Year Range Pct): | 52.4 | 44.5 | 68.7 |
| – COT Index Reading (3 Year Range): | Bullish | Bearish | Bullish |
| NET POSITION MOVEMENT INDEX: | |||
| – 6-Week Change in Strength Index: | 20.6 | -14.5 | -2.4 |
Australian Dollar Futures:
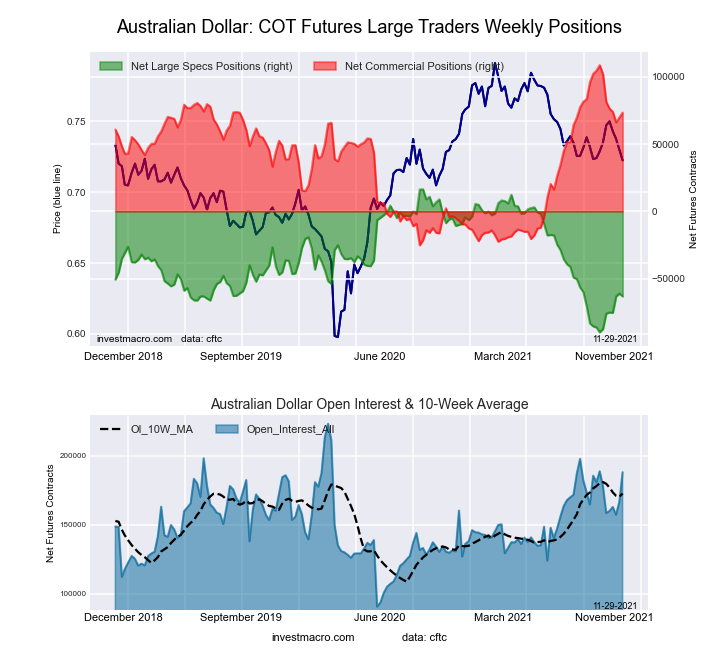 The Australian Dollar large speculator standing this week recorded a net position of -63,265 contracts in the data reported through Tuesday. This was a weekly decline of -2,112 contracts from the previous week which had a total of -61,153 net contracts.
This week’s current strength score (the trader positioning range over the past three years, measured from 0 to 100) shows the speculators are currently Bearish with a score of 25.1 percent. The commercials are Bullish with a score of 73.7 percent and the small traders (not shown in chart) are Bearish with a score of 27.7 percent.
| AUSTRALIAN DOLLAR Statistics | SPECULATORS | COMMERCIALS | SMALL TRADERS |
| – Percent of Open Interest Longs: | 21.6 | 65.4 | 10.1 |
| – Percent of Open Interest Shorts: | 55.2 | 26.3 | 15.5 |
| – Net Position: | -63,265 | 73,423 | -10,158 |
| – Gross Longs: | 40,523 | 122,921 | 18,914 |
| – Gross Shorts: | 103,788 | 49,498 | 29,072 |
| – Long to Short Ratio: | 0.4 to 1 | 2.5 to 1 | 0.7 to 1 |
| NET POSITION TREND: | |||
| – COT Index Score (3 Year Range Pct): | 25.1 | 73.7 | 27.7 |
| – COT Index Reading (3 Year Range): | Bearish | Bullish | Bearish |
| NET POSITION MOVEMENT INDEX: | |||
| – 6-Week Change in Strength Index: | 22.9 | -21.3 | 10.3 |
New Zealand Dollar Futures:
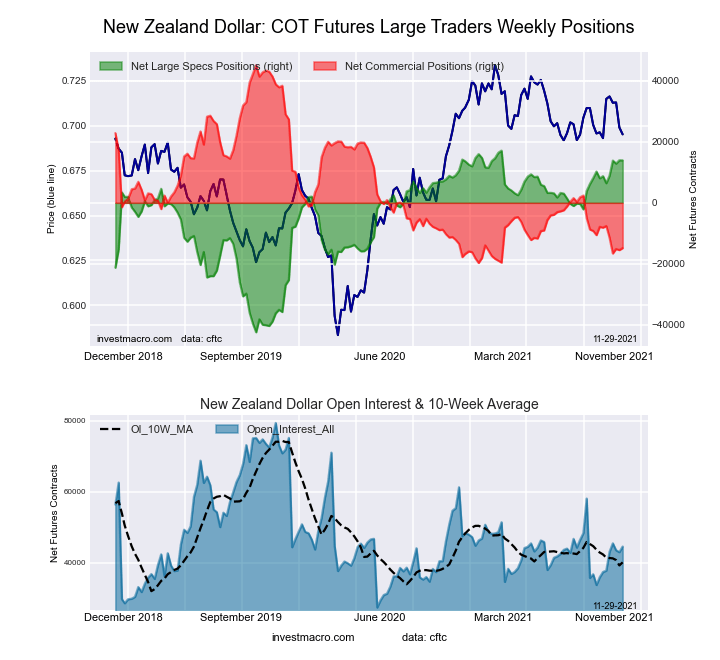 The New Zealand Dollar large speculator standing this week recorded a net position of 13,939 contracts in the data reported through Tuesday. This was a weekly fall of -26 contracts from the previous week which had a total of 13,965 net contracts.
This week’s current strength score (the trader positioning range over the past three years, measured from 0 to 100) shows the speculators are currently Bullish-Extreme with a score of 94.7 percent. The commercials are Bearish-Extreme with a score of 7.5 percent and the small traders (not shown in chart) are Bullish with a score of 62.4 percent.
| NEW ZEALAND DOLLAR Statistics | SPECULATORS | COMMERCIALS | SMALL TRADERS |
| – Percent of Open Interest Longs: | 62.5 | 24.6 | 10.3 |
| – Percent of Open Interest Shorts: | 31.2 | 58.0 | 8.3 |
| – Net Position: | 13,939 | -14,860 | 921 |
| – Gross Longs: | 27,835 | 10,943 | 4,596 |
| – Gross Shorts: | 13,896 | 25,803 | 3,675 |
| – Long to Short Ratio: | 2.0 to 1 | 0.4 to 1 | 1.3 to 1 |
| NET POSITION TREND: | |||
| – COT Index Score (3 Year Range Pct): | 94.7 | 7.5 | 62.4 |
| – COT Index Reading (3 Year Range): | Bullish-Extreme | Bearish-Extreme | Bullish |
| NET POSITION MOVEMENT INDEX: | |||
| – 6-Week Change in Strength Index: | 8.7 | -10.3 | 17.4 |
Mexican Peso Futures:
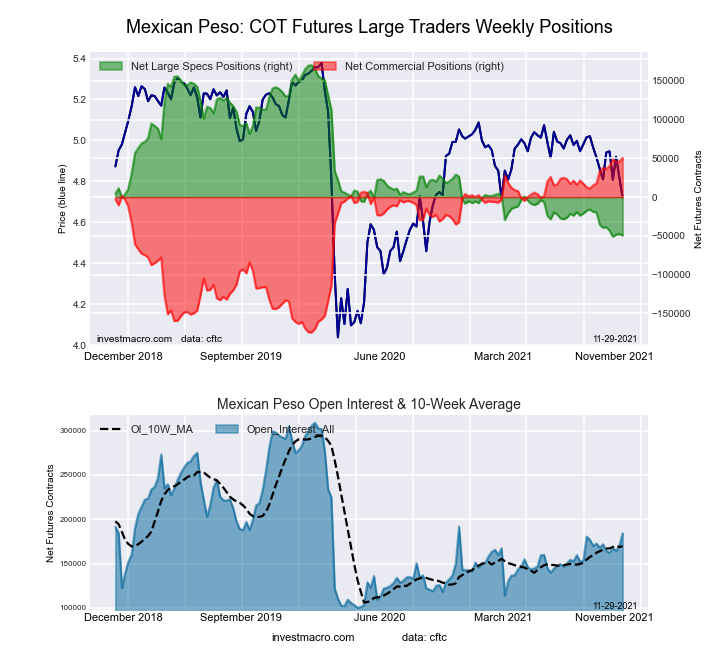 The Mexican Peso large speculator standing this week recorded a net position of -49,461 contracts in the data reported through Tuesday. This was a weekly decline of -1,806 contracts from the previous week which had a total of -47,655 net contracts.
This week’s current strength score (the trader positioning range over the past three years, measured from 0 to 100) shows the speculators are currently Bearish-Extreme with a score of 0.7 percent. The commercials are Bullish-Extreme with a score of 100.0 percent and the small traders (not shown in chart) are Bearish with a score of 38.2 percent.
| MEXICAN PESO Statistics | SPECULATORS | COMMERCIALS | SMALL TRADERS |
| – Percent of Open Interest Longs: | 43.8 | 53.2 | 2.3 |
| – Percent of Open Interest Shorts: | 70.6 | 25.7 | 2.9 |
| – Net Position: | -49,461 | 50,588 | -1,127 |
| – Gross Longs: | 80,691 | 98,029 | 4,234 |
| – Gross Shorts: | 130,152 | 47,441 | 5,361 |
| – Long to Short Ratio: | 0.6 to 1 | 2.1 to 1 | 0.8 to 1 |
| NET POSITION TREND: | |||
| – COT Index Score (3 Year Range Pct): | 0.7 | 100.0 | 38.2 |
| – COT Index Reading (3 Year Range): | Bearish-Extreme | Bullish-Extreme | Bearish |
| NET POSITION MOVEMENT INDEX: | |||
| – 6-Week Change in Strength Index: | -4.4 | 5.7 | -12.7 |
Brazilian Real Futures:
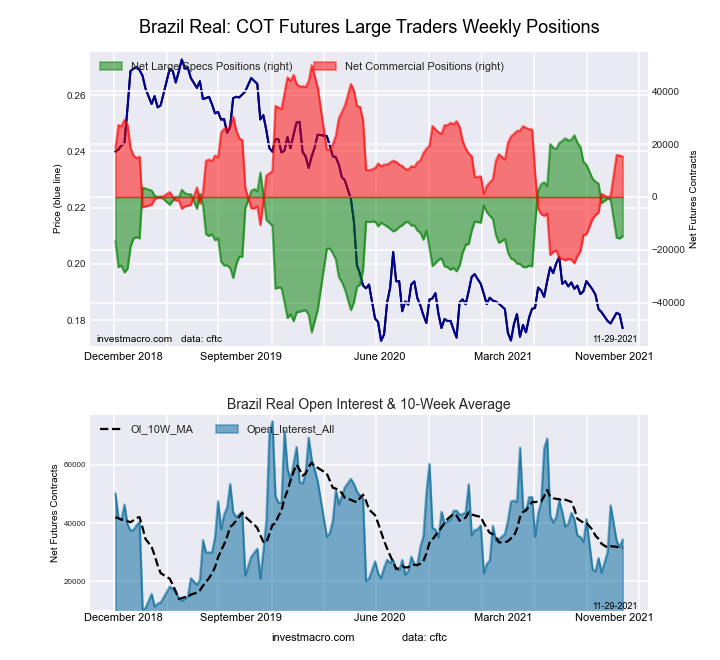 The Brazilian Real large speculator standing this week recorded a net position of -14,804 contracts in the data reported through Tuesday. This was a weekly advance of 894 contracts from the previous week which had a total of -15,698 net contracts.
This week’s current strength score (the trader positioning range over the past three years, measured from 0 to 100) shows the speculators are currently Bearish with a score of 48.8 percent. The commercials are Bullish with a score of 53.9 percent and the small traders (not shown in chart) are Bullish with a score of 60.1 percent.
| BRAZIL REAL Statistics | SPECULATORS | COMMERCIALS | SMALL TRADERS |
| – Percent of Open Interest Longs: | 26.8 | 64.7 | 7.2 |
| – Percent of Open Interest Shorts: | 69.8 | 20.0 | 8.8 |
| – Net Position: | -14,804 | 15,360 | -556 |
| – Gross Longs: | 9,197 | 22,233 | 2,462 |
| – Gross Shorts: | 24,001 | 6,873 | 3,018 |
| – Long to Short Ratio: | 0.4 to 1 | 3.2 to 1 | 0.8 to 1 |
| NET POSITION TREND: | |||
| – COT Index Score (3 Year Range Pct): | 48.8 | 53.9 | 60.1 |
| – COT Index Reading (3 Year Range): | Bearish | Bullish | Bullish |
| NET POSITION MOVEMENT INDEX: | |||
| – 6-Week Change in Strength Index: | -19.3 | 20.6 | -12.5 |
Russian Ruble Futures:
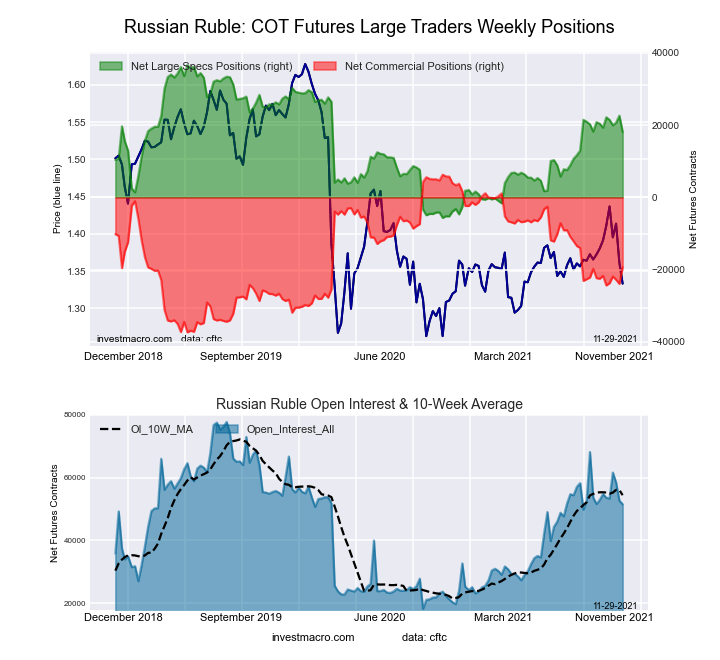 The Russian Ruble large speculator standing this week recorded a net position of 18,064 contracts in the data reported through Tuesday. This was a weekly decline of -4,561 contracts from the previous week which had a total of 22,625 net contracts.
This week’s current strength score (the trader positioning range over the past three years, measured from 0 to 100) shows the speculators are currently Bullish with a score of 56.1 percent. The commercials are Bearish with a score of 41.2 percent and the small traders (not shown in chart) are Bullish with a score of 68.8 percent.
| RUSSIAN RUBLE Statistics | SPECULATORS | COMMERCIALS | SMALL TRADERS |
| – Percent of Open Interest Longs: | 49.7 | 45.2 | 5.0 |
| – Percent of Open Interest Shorts: | 14.7 | 82.7 | 2.6 |
| – Net Position: | 18,064 | -19,323 | 1,259 |
| – Gross Longs: | 25,617 | 23,317 | 2,601 |
| – Gross Shorts: | 7,553 | 42,640 | 1,342 |
| – Long to Short Ratio: | 3.4 to 1 | 0.5 to 1 | 1.9 to 1 |
| NET POSITION TREND: | |||
| – COT Index Score (3 Year Range Pct): | 56.1 | 41.2 | 68.8 |
| – COT Index Reading (3 Year Range): | Bullish | Bearish | Bullish |
| NET POSITION MOVEMENT INDEX: | |||
| – 6-Week Change in Strength Index: | -2.9 | 5.5 | -31.2 |
Bitcoin Futures:
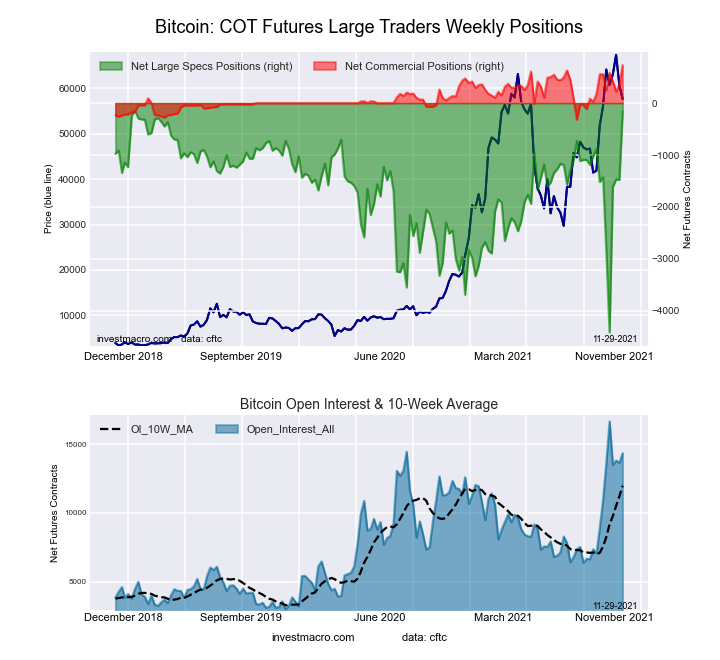 The Bitcoin large speculator standing this week recorded a net position of -160 contracts in the data reported through Tuesday. This was a weekly increase of 1,318 contracts from the previous week which had a total of -1,478 net contracts.
This week’s current strength score (the trader positioning range over the past three years, measured from 0 to 100) shows the speculators are currently Bullish-Extreme with a score of 99.6 percent. The commercials are Bullish-Extreme with a score of 100.0 percent and the small traders (not shown in chart) are Bearish-Extreme with a score of 0.0 percent.
| BITCOIN Statistics | SPECULATORS | COMMERCIALS | SMALL TRADERS |
| – Percent of Open Interest Longs: | 63.1 | 6.7 | 14.6 |
| – Percent of Open Interest Shorts: | 64.2 | 1.7 | 18.5 |
| – Net Position: | -160 | 729 | -569 |
| – Gross Longs: | 9,054 | 966 | 2,094 |
| – Gross Shorts: | 9,214 | 237 | 2,663 |
| – Long to Short Ratio: | 1.0 to 1 | 4.1 to 1 | 0.8 to 1 |
| NET POSITION TREND: | |||
| – COT Index Score (3 Year Range Pct): | 99.6 | 100.0 | 0.0 |
| – COT Index Reading (3 Year Range): | Bullish-Extreme | Bullish-Extreme | Bearish-Extreme |
| NET POSITION MOVEMENT INDEX: | |||
| – 6-Week Change in Strength Index: | 29.6 | 16.6 | -32.7 |
Article By InvestMacro – Receive our weekly COT Reports by Email
*COT Report: The COT data, released weekly to the public each Friday, is updated through the most recent Tuesday (data is 3 days old) and shows a quick view of how large speculators or non-commercials (for-profit traders) were positioned in the futures markets.
The CFTC categorizes trader positions according to commercial hedgers (traders who use futures contracts for hedging as part of the business), non-commercials (large traders who speculate to realize trading profits) and nonreportable traders (usually small traders/speculators) as well as their open interest (contracts open in the market at time of reporting).See CFTC criteria here.

- COT Metals Charts: Weekly Speculator Bets see small gains for Silver & Gold Jul 12, 2026
- COT Bonds Charts: Speculator Bets led by SOFR 3-Months & 2-Year Bonds Jul 12, 2026
- COT Energy Charts: Weekly Speculator Changes led by Brent Oil Jul 12, 2026
- COT Soft Commodities Charts: Weekly Speculator Changes led by Sugar, Corn & Soybeans Jul 12, 2026
- The US and European stock indices are rising again amid renewed investor interest in the AI industry. Jul 10, 2026
- USD/JPY Falls as Yen Recovers Weekly Losses Jul 10, 2026
- Crude oil prices surged sharply by 7% in reaction to the rapid escalation of the conflict in the Middle East Jul 9, 2026
- Middle East Tensions Weigh on Gold Jul 9, 2026
- Pound Awaits Tighter Policy from Bank of England Jul 8, 2026
- The United States carried out airstrikes on Iran after Iran’s attacked tankers in the Strait of Hormuz. The RBNZ raised the interest rate to 2.5% Jul 8, 2026