Archive for Forex and Currency News – Page 195

Fibonacci Retracements Analysis 10.12.2021 (AUDUSD, USDCAD)

Article By RoboForex.com

AUDUSD, “Australian Dollar vs US Dollar”

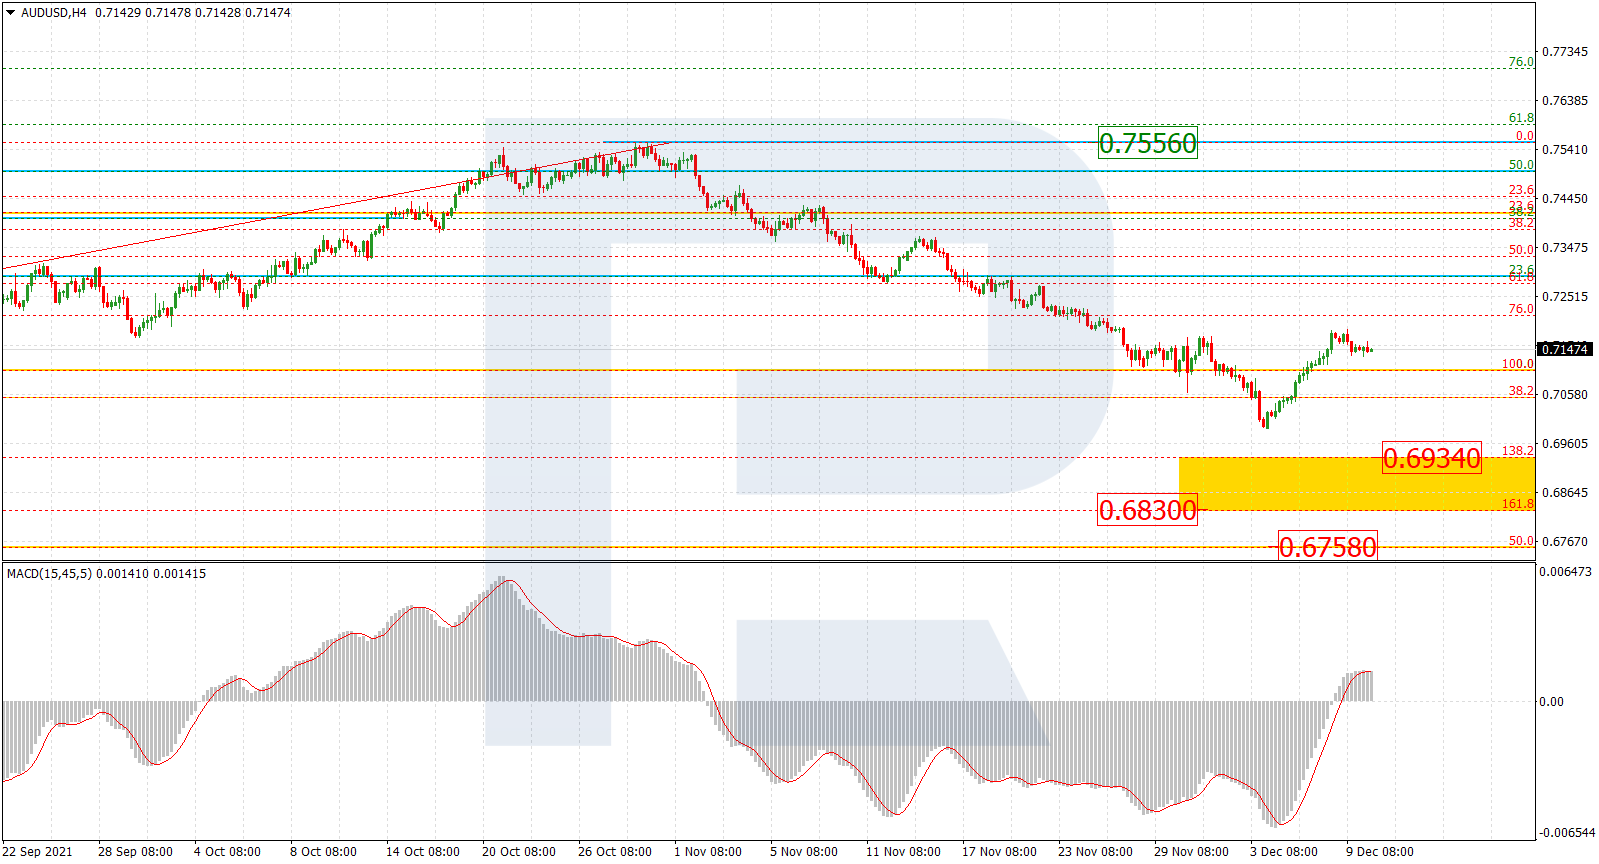
As we can see in the H4 chart, after breaking the low and reaching 38.2% fibo, the descending wave has been followed by a new pullback. After the pullback is over, AUDUSD may resume trading downwards to reach the post-correctional extension area between 138.2% and 161.8% fibo at 0.6934 and 0.6830 respectively, and then the long-term 50.0% fibo at 0.6758.

AUDUSD_H4
Risk Warning: the result of previous trading operations do not guarantee the same results in the future

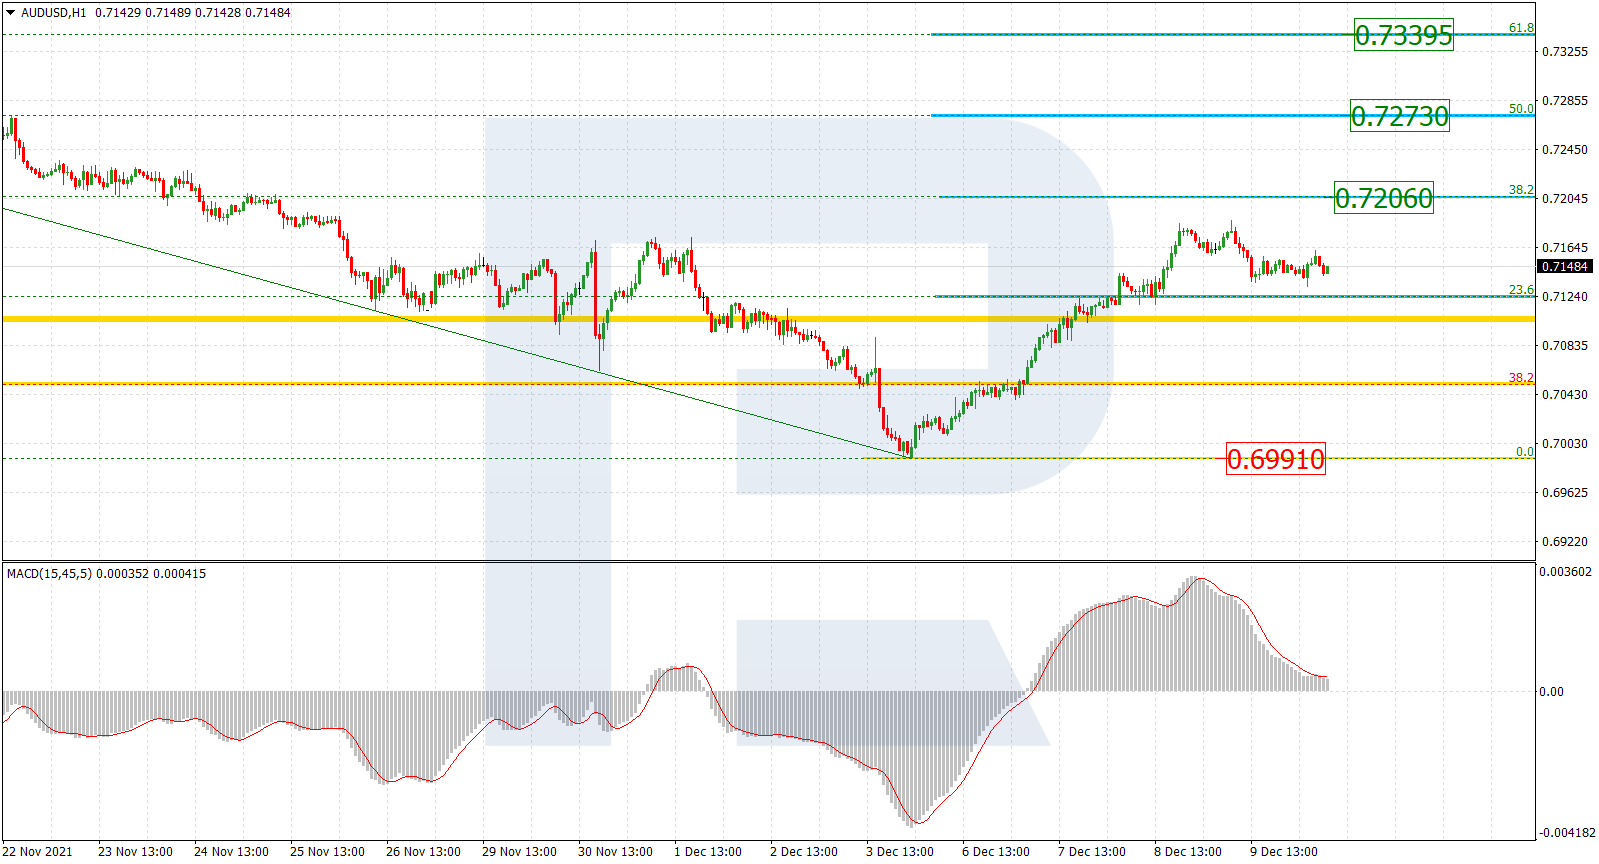
The H1 chart shows a more detailed structure of the current correction. The first wave has reached 23.6% fibo, while the next one may be heading towards 38.2%, 50.0%, and 61.8% fibo at 0.7206, 0.7273, and 0.7339 respectively. The support is the low at 0.6991.

AUDUSD_H1
Risk Warning: the result of previous trading operations do not guarantee the same results in the future

USDCAD

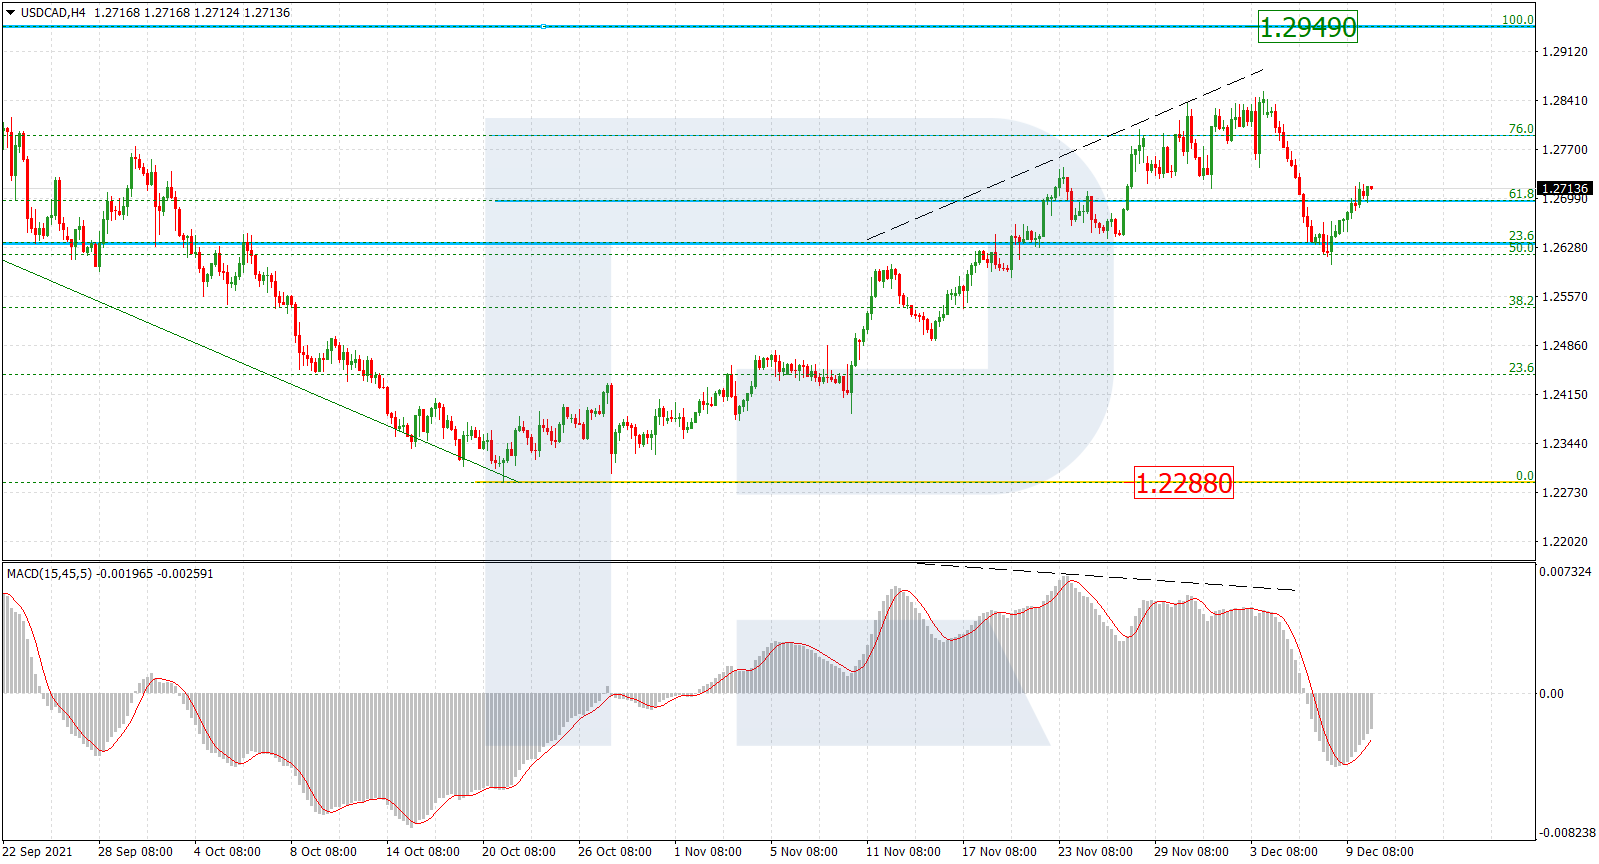
As we can see in the H4 chart, divergence on MACD made the pair stop its growth at 76.0% fibo and start a new correctional downtrend. The next upside target is still the high at 1.2949. Moreover, a breakout of the high will lead to a further uptrend to reach the long-term 38.2% fibo at 1.3022. The support remains the low at 1.2288.

USDCAD_H4
Risk Warning: the result of previous trading operations do not guarantee the same results in the future

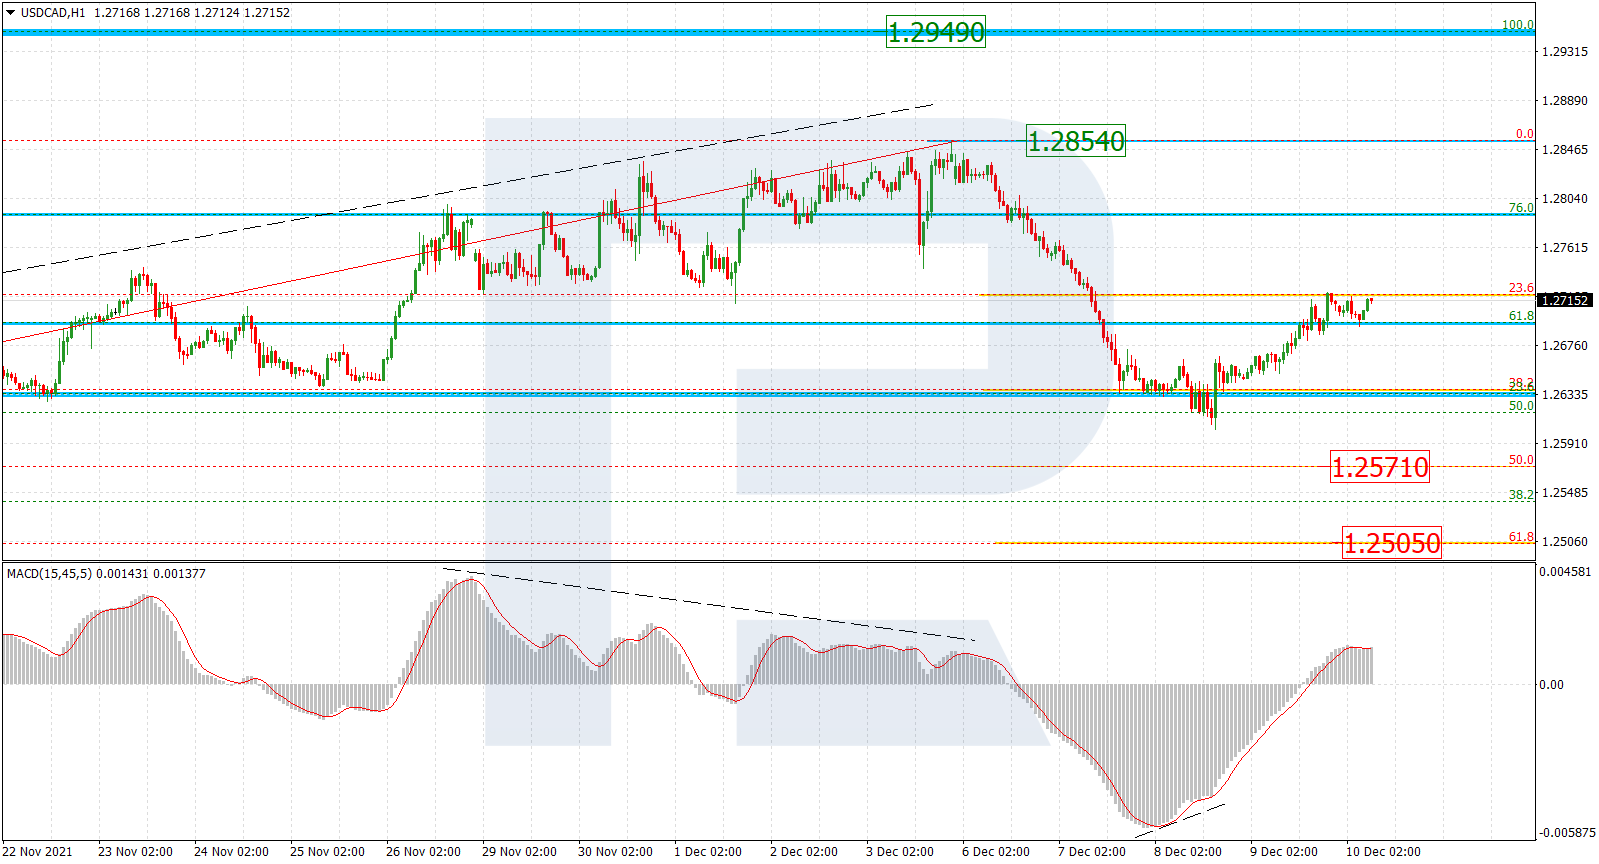
In the H1 chart, the decline reached 38.2% fibo after divergence on MACD, but was later followed by local convergence and a new decline. However, it doesn’t exclude a possibility of another descending impulse towards 50.0% and 61.8% fibo at 1.2571 and 1.2505 respectively. A breakout of the local resistance at 1.2854 will result in a further uptrend.

USDCAD_H1

Article By RoboForex.com

Attention!
Forecasts presented in this section only reflect the author’s private opinion and should not be considered as guidance for trading. RoboForex LP bears no responsibility for trading results based on trading recommendations described in these analytical reviews.

Murrey Math Lines 10.12.2021 (Brent, S&P 500)

Article By RoboForex.com

BRENT

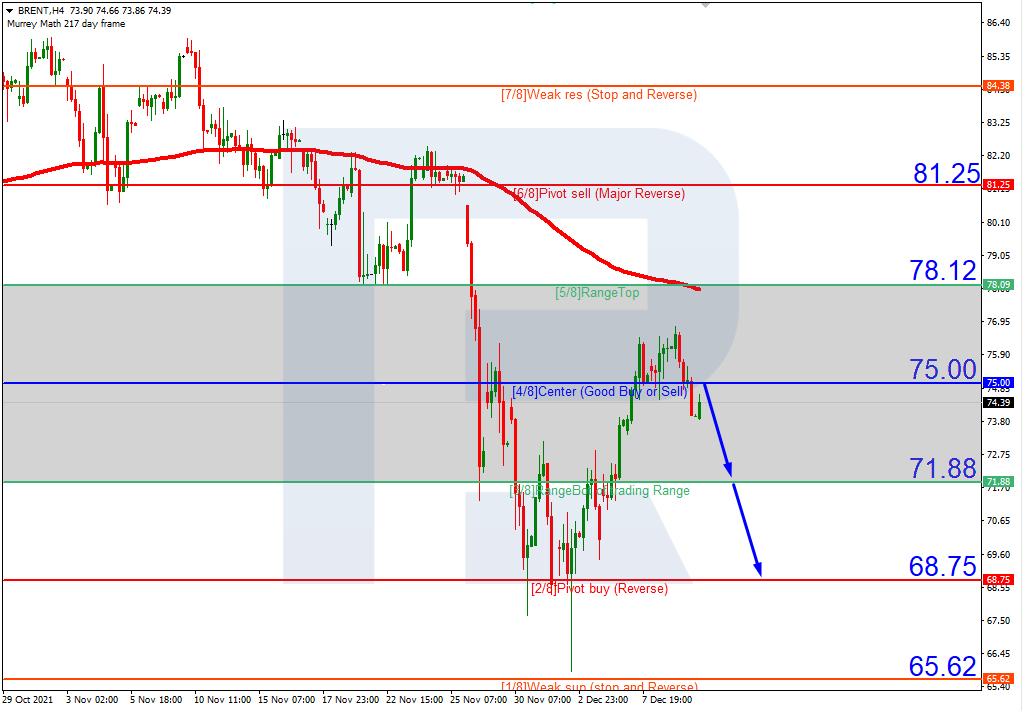
In the H4 chart, Brent is trading below the 200-day Moving Average, thus indicating a descending tendency. In this case, the price is expected to test 4/8, rebound from it, and then resume falling towards the support at 2/8. However, this scenario may no longer be valid if the asset breaks 4/8 to the upside. After that, the instrument may continue growing and reach the resistance at 5/8.

BRENTH4
Risk Warning: the result of previous trading operations do not guarantee the same results in the future

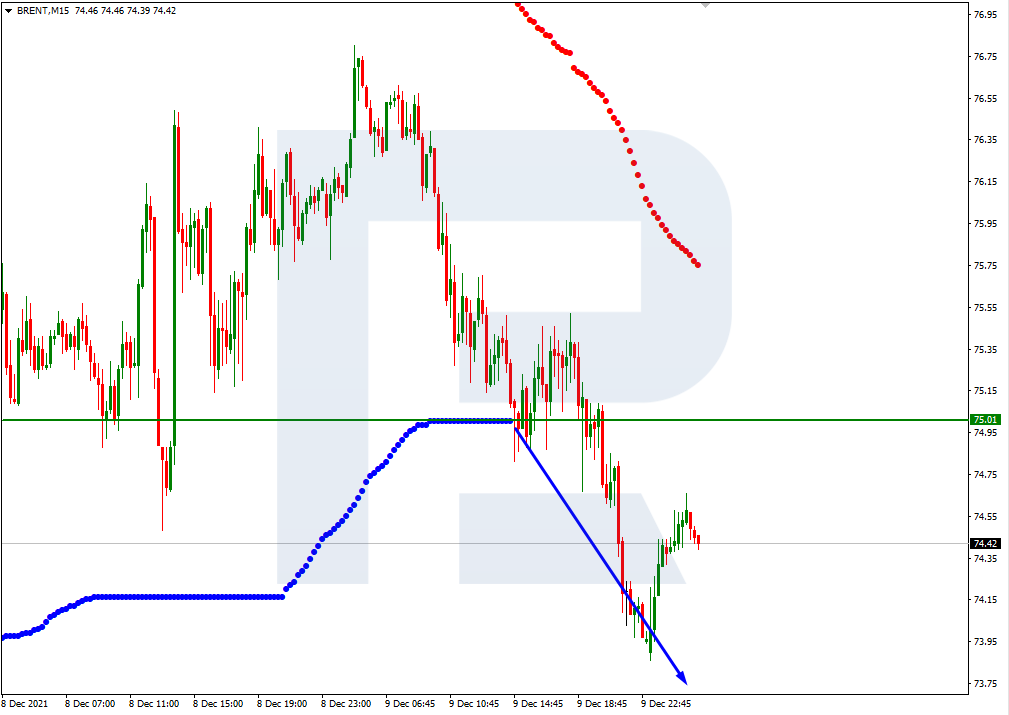
As we can see in the M15 chart, the pair has broken the downside line of the VoltyChannel indicator and, as a result, may continue trading downwards.

BRENT_M15
Risk Warning: the result of previous trading operations do not guarantee the same results in the future

S&P 500

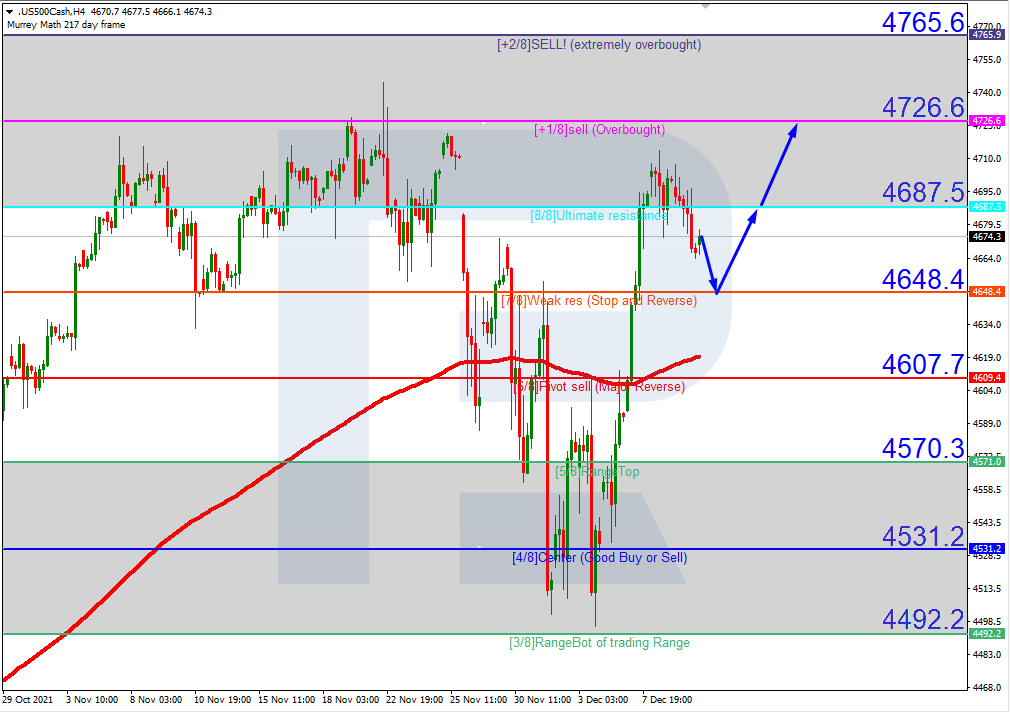
In the H4 chart, the S&P Index is trading above the 200-day Moving Average, thus indicating an ascending tendency. In this case, the price is expected to test 7/8, rebound from it, and then resume trading upwards to reach the resistance at +1/8. However, this scenario may no longer be valid if the asset breaks 7/8 to the downside. After that, the instrument may correct and reach the support at 6/8.

S&P 500_H4
Risk Warning: the result of previous trading operations do not guarantee the same results in the future

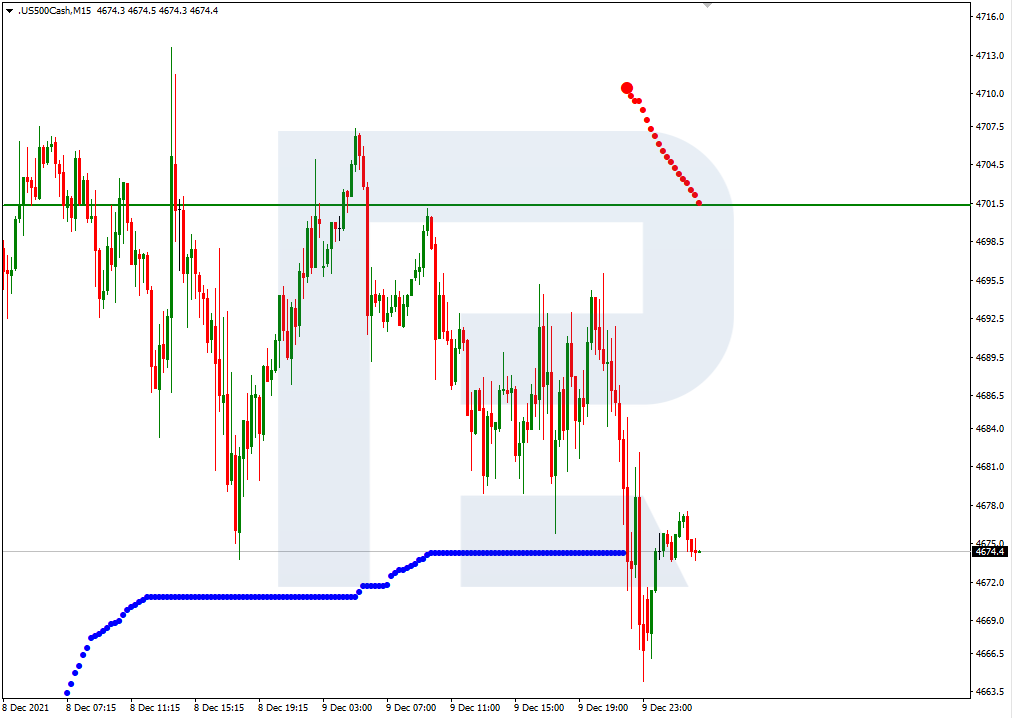
As we can see in the M15 chart, the upside line of the VoltyChannel indicator is pretty far away from the price, that’s why the pair may resume trading upwards only after rebounding from 7/8 in the H4 chart.

S&P 500_M15

Article By RoboForex.com

Attention!
Forecasts presented in this section only reflect the author’s private opinion and should not be considered as guidance for trading. RoboForex LP bears no responsibility for trading results based on trading recommendations described in these analytical reviews.

The Analytical Overview of the Main Currency Pairs on 2021.12.10

by JustForex

The EUR/USD currency pair

Technical indicators of the currency pair:
  • Prev Open: 1.1341
  • Prev Close: 1.1292
  • % chg. over the last day: -0.44%

The euro may fall sharply today on inflation data in Germany and the United States. Analysts expect a -0.2% decline in German inflation, while the US is expected to see a 0.7-0.9% increase in consumer prices. A rise in inflation usually leads to an increase in the national currency, expecting that the central bank will tighten its monetary policy.

Trading recommendations
  • Support levels: 1.1265, 1.1230, 1.1168
  • Resistance levels: 1.1360, 1.1436, 1.1535, 1.1613, 1.1667, 1.1717

From a technical point of view, the EUR/USD on the hour time frame is still bearish. Sellers’ initiatives replaced buyers’ initiatives. The MACD indicator has become inactive. Under such market conditions, traders should consider sell positions from the priority change level of 1.1360. Buy trades can be considered on lower time frames, but only with short targets.

Alternative scenario: if the price breaks out through the 1.1360 resistance level and fixes above, the mid-term uptrend will likely resume.

EUR/USD
News feed for 2021.12.10:
  • – Germany Consumer Price Index (m/m) at 09:00 (GMT+2);
  • – ECB President Lagarde’s Speech at 11:05 (GMT+2);
  • – US Consumer Price Index (m/m) at 15:30 (GMT+2);
  • – US Michigan Consumer Sentiment (m/m) at 17:00 (GMT+2).

The GBP/USD currency pair

Technical indicators of the currency pair:
  • Prev Open: 1.3193
  • Prev Close: 1.3218
  • % chg. over the last day: +0.19%

Goldman Sachs canceled its forecast for the first Bank of England rate hike at the December meeting, amid uncertainty caused by the Omicron option and after new restrictions imposed across the country. The US inflation report for November may trigger a new sell-off in the pound today since analysts expect a strong rise in consumer prices.

Trading recommendations
  • Support levels: 1.3188
  • Resistance levels: 1.3232, 1.3289, 1.3326, 1.3434, 1.3507, 1.3575, 1.3685

On the hourly time frame, the trend on GBP/USD is bearish. The British pound is trading in a narrow corridor with the range of 1.3188-1.3232. The MACD indicator has become inactive, but there are still signs of divergence on several time frames. Under such market conditions, traders should consider sell positions from the resistance levels around the moving average or from the upper border of the descending channel. Buy trades should be considered from the support level of the higher time frame, but only with additional confirmation.

Alternative scenario: if the price breaks out through the 1.3326 resistance level and consolidates above, the bullish scenario will likely resume.

GBP/USD
News feed for 2021.12.10:
  • – UK GDP (q/q) at 09:00 (GMT+2);
  • – UK Industrial Production (m/m) at 09:00 (GMT+2);
  • – UK Manufacturing Production (m/m) at 09:00 (GMT+2);
  • – US Consumer Price Index (m/m) at 15:30 (GMT+2).

The USD/JPY currency pair

Technical indicators of the currency pair:
  • Prev Open: 113.65
  • Prev Close: 113.45
  • % chg. over the last day: -0.18%

In Japan, the Producer Price Index, which shows the rate of inflation between companies and factories, increased from 8.3% to 9%. These are the first signs that investors should expect consumer inflation to rise soon. But against the backdrop of massive central bank stimulation of the economy, such a picture looks quite normal. The dollar index may jump up sharply today since inflation in the US is rising. If this happens, the USD/JPY quotes might go up sharply.

Trading recommendations
  • Support levels: 112.62, 112.30
  • Resistance levels: 113.94, 114.17, 115.15, 115.50

The global trend on the USD/JPY currency pair is bearish. But the pressure of buyers is increasing, and the price is approaching the priority change level. Under such market conditions, traders are better to look for sales from the priority change level, but with additional confirmation. Buy positions should be considered from the lower border of the corridor, but with additional confirmation in the form of a buyers’ initiative.

Alternative scenario: if the price rises above 114.17, the uptrend will likely resume.

USD/JPY
News feed for 2021.12.10:
  • – Japan Producer Price Index (m/m) at 01:50 (GMT+2);
  • – US Consumer Price Index (m/m) at 15:30 (GMT+2).

The USD/CAD currency pair

Technical indicators of the currency pair:
  • Prev Open: 1.2647
  • Prev Close: 1.2714
  • % chg. over the last day: +0.53%

After the oil price stabilized, the USD/CAD quotes started rising again. The Canadian dollar is a commodity currency, as it is highly correlated with oil prices. Technically, the price of oil may drop to the area of $68 a barrel, so the Canadian dollar will be under sellers’ pressure, especially if the dollar index rises sharply today on the background of the expected growth of inflation in the United States.

Trading recommendations
  • Support levels: 1.2638, 1.2597, 1.2502, 1.2416
  • Resistance levels: 1.2726, 1.2776, 1.2828

From a technical point of view, the USD/CAD currency trend is bearish. The MACD indicator has become positive. Under such market conditions, it is better to look for buy trades from the 1.2638 support level, but only after additional confirmation in the form of a buyers’ initiative. It is better to consider sell deals from the resistance levels near the moving average.

Alternative scenario: if the price breaks out through the 1.2776 resistance level and fixes above, the downtrend will likely be broken.

USD/CAD
News feed for 2021.12.10:
  • – US Consumer Price Index (m/m) at 15:30 (GMT+2).

by JustForex


This article reflects a personal opinion and should not be interpreted as an investment advice, and/or offer, and/or a persistent request for carrying out financial transactions, and/or a guarantee, and/or a forecast of future events.

Japanese Candlesticks Analysis 09.12.2021 (USDCAD, AUDUSD, USDCHF)

Article By RoboForex.com

USDCAD, “US Dollar vs Canadian Dollar”

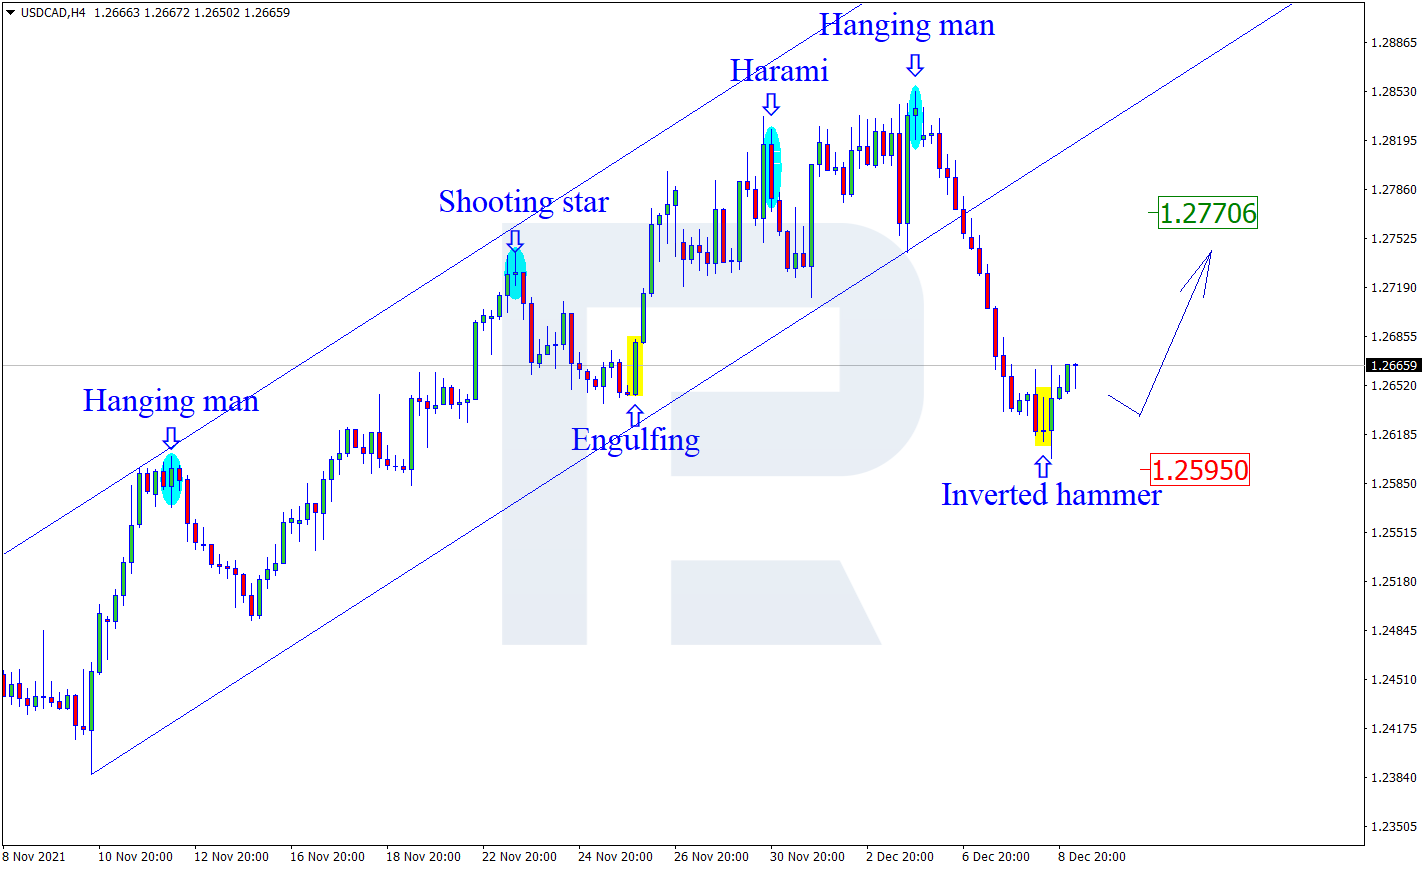
As we can see in the H4 chart, after forming several reversal patterns, including Inverted Hammer, close to the support level, USDCAD may reverse in the form of another rising wave. In this case, the upside target may be the resistance area at 1.2770. However, an alternative scenario implies that the asset may continue falling to reach 1.2595 first and then resume trading upwards.

USDCAD
Risk Warning: the result of previous trading operations do not guarantee the same results in the future

AUDUSD, “Australian Dollar vs US Dollar”

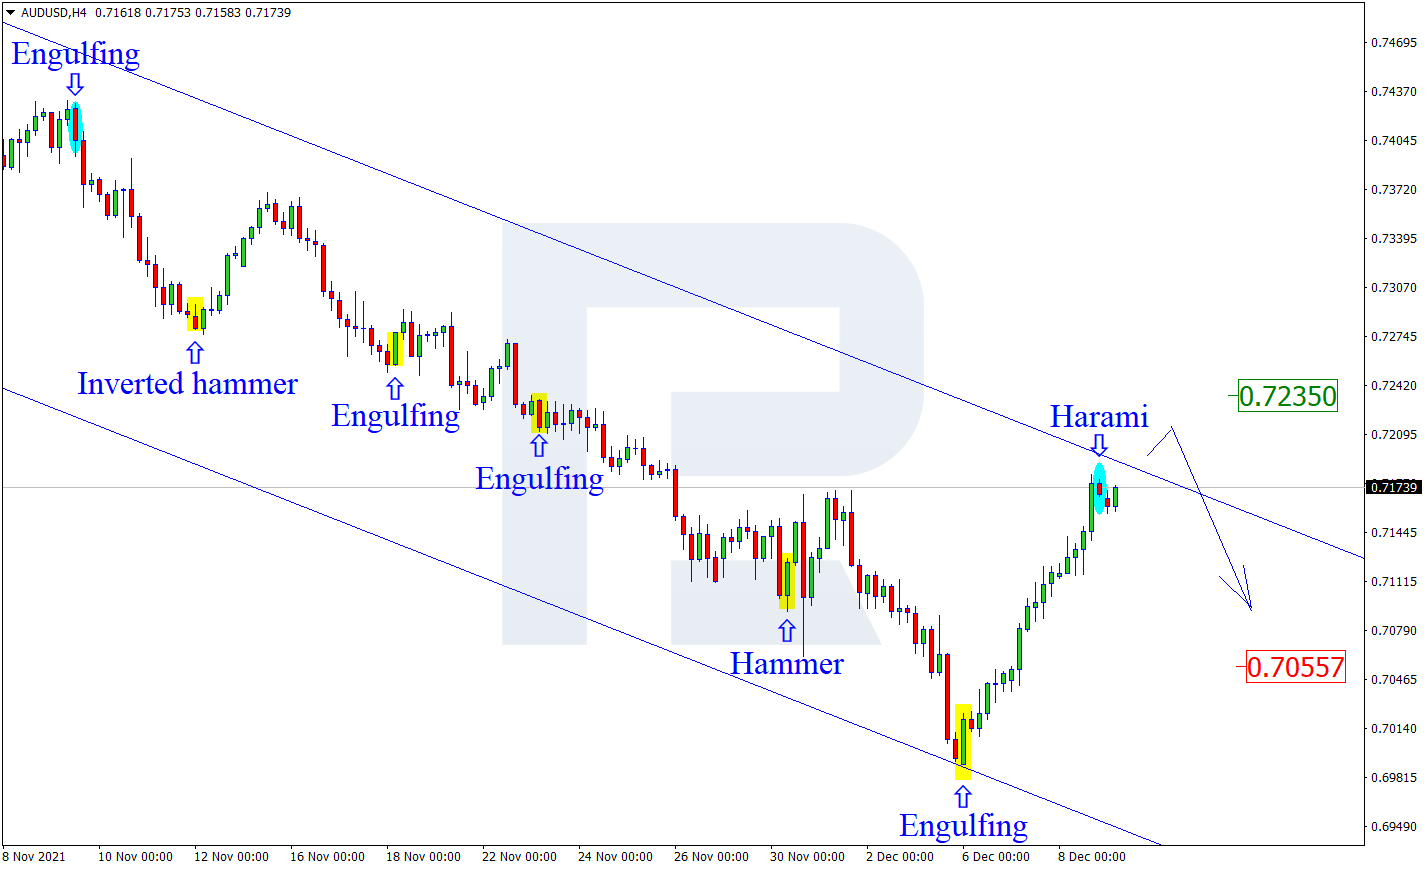
As we can see in the H4 chart, AUDUSD has formed several reversal patterns, such as Harami, near the channel’s upside border. At the moment, the asset may reverse in the form of another descending impulse. In this case, the downside target may be the support area at 0.7155. At the same time, an opposite scenario implies that the price may continue growing to reach 0.7235 before resuming its descending tendency.

AUDUSD
Risk Warning: the result of previous trading operations do not guarantee the same results in the future

USDCHF, “US Dollar vs Swiss Franc”

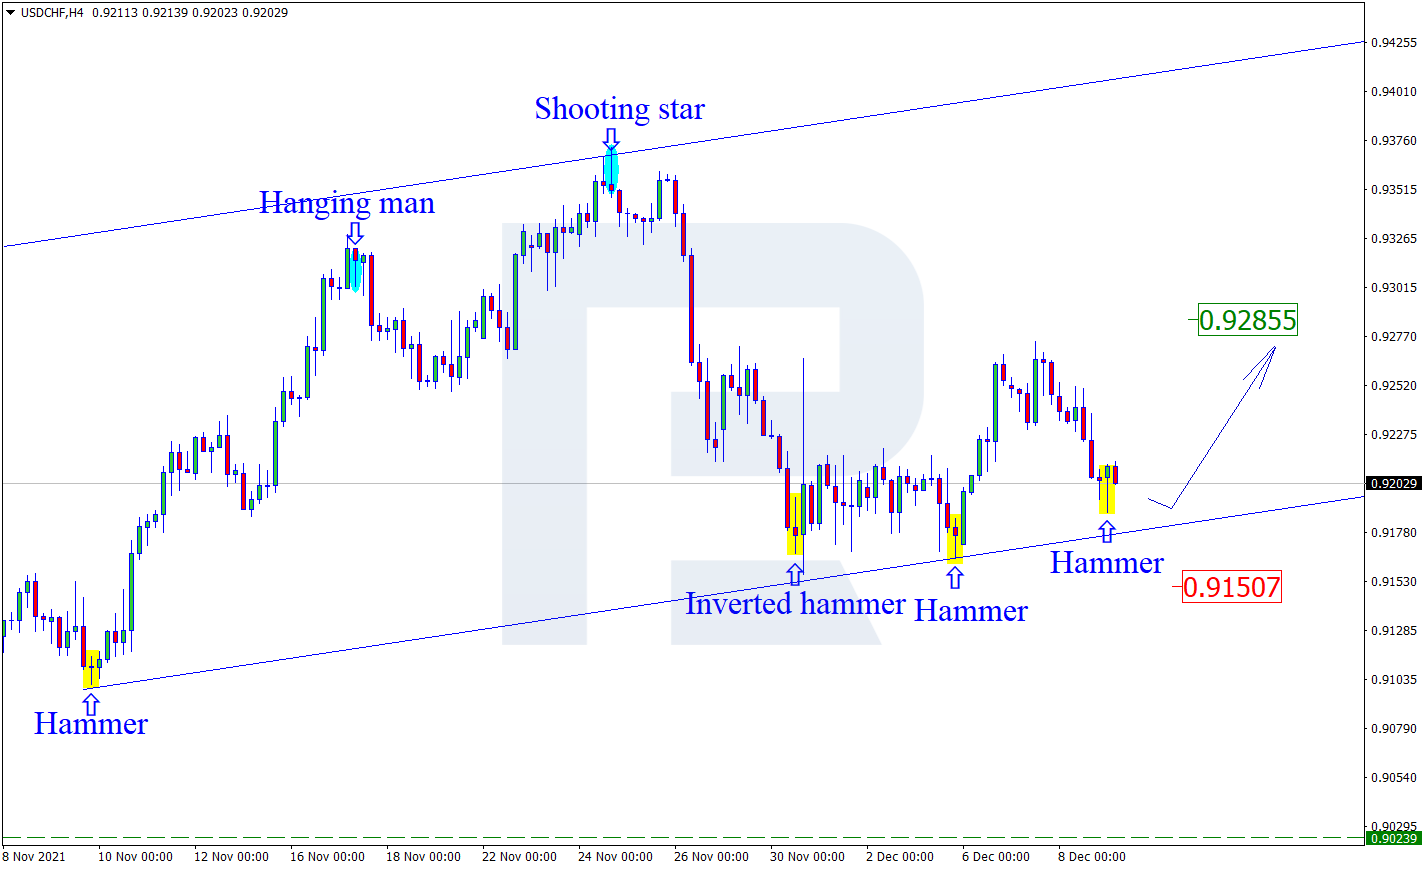
As we can see in the H4 chart, after testing the support area, the pair has formed several reversal patterns, for example, Hammer. At the moment, USDCHF is reversing in the form of a new rising wave towards the resistance level. In this case, the upside target may be at 0.9285. Still, there might be an alternative scenario, according to which the asset may continue falling to reach 0.9150 before resuming its ascending tendency.

USDCHF

Article By RoboForex.com

Attention!
Forecasts presented in this section only reflect the author’s private opinion and should not be considered as guidance for trading. RoboForex LP bears no responsibility for trading results based on trading recommendations described in these analytical reviews.

Murrey Math Lines 09.12.2021 (USDCHF, GOLD)

Article By RoboForex.com

USDCHF, “US Dollar vs Swiss Franc”

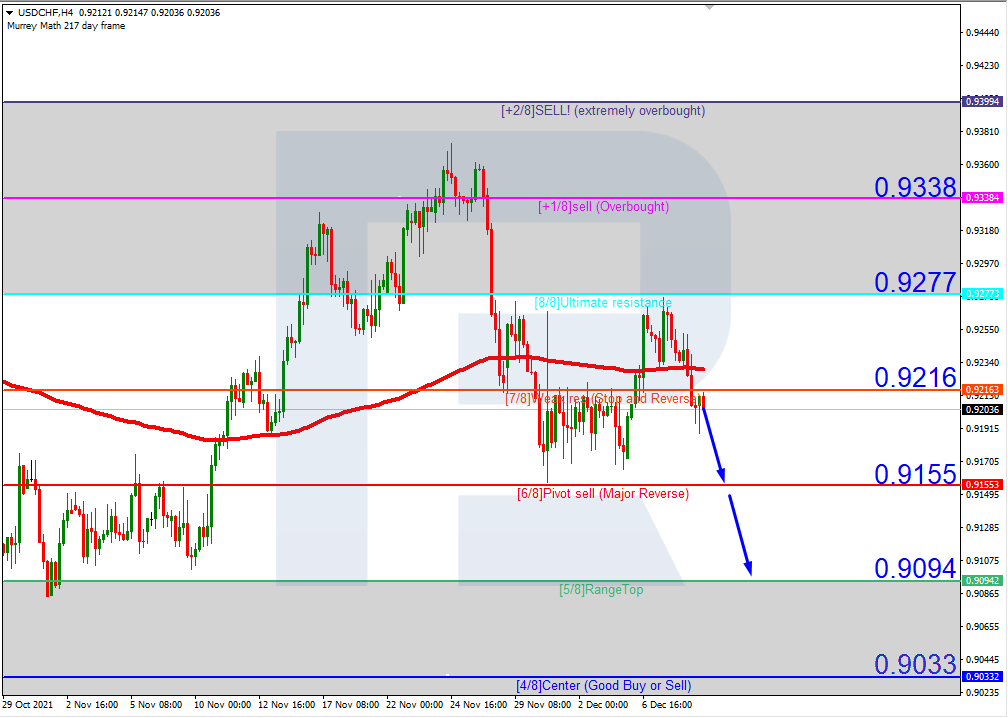
In the H4 chart, after breaking the 200-day Moving Average again, USDCHF is trading below it, thus indicating a possible descending tendency. In this case, the price is expected to test 6/8, break it, and then continue falling to reach the support at 5/8. However, this scenario may be cancelled if the price breaks the resistance at 7/8 to the upside. After that, the instrument may head towards the “overbought area” and reach 8/8.

USDCHFH4
Risk Warning: the result of previous trading operations do not guarantee the same results in the future

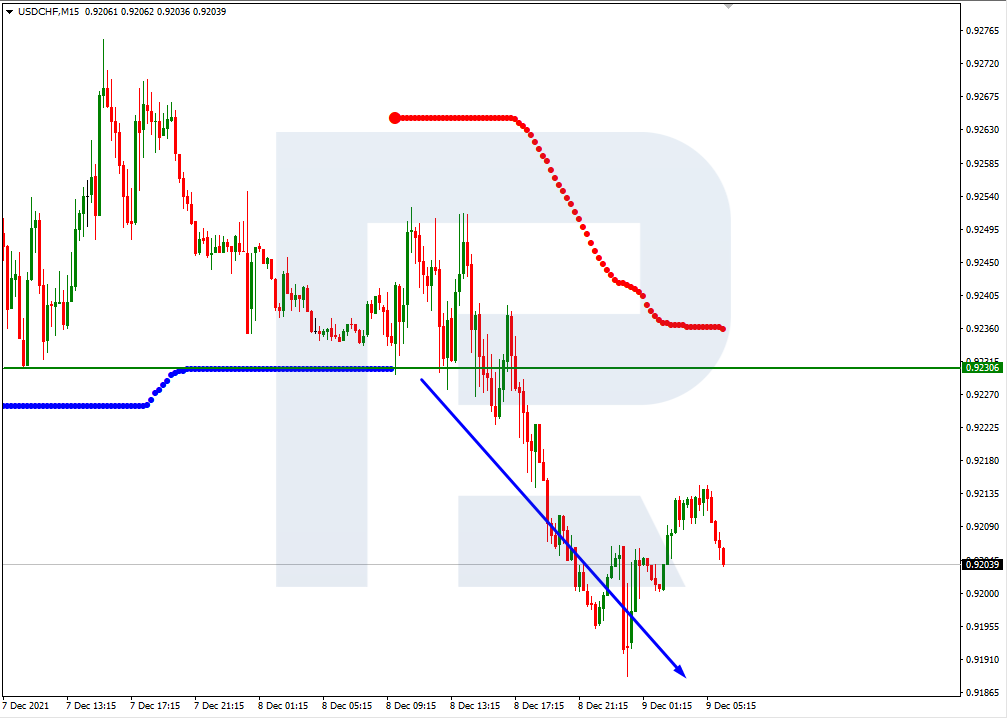
As we can see in the M15 chart, the pair has broken the downside line of the VoltyChannel indicator and, as a result, may continue trading downwards.

USDCHF_M15
Risk Warning: the result of previous trading operations do not guarantee the same results in the future

XAUUSD, “Gold vs US Dollar”

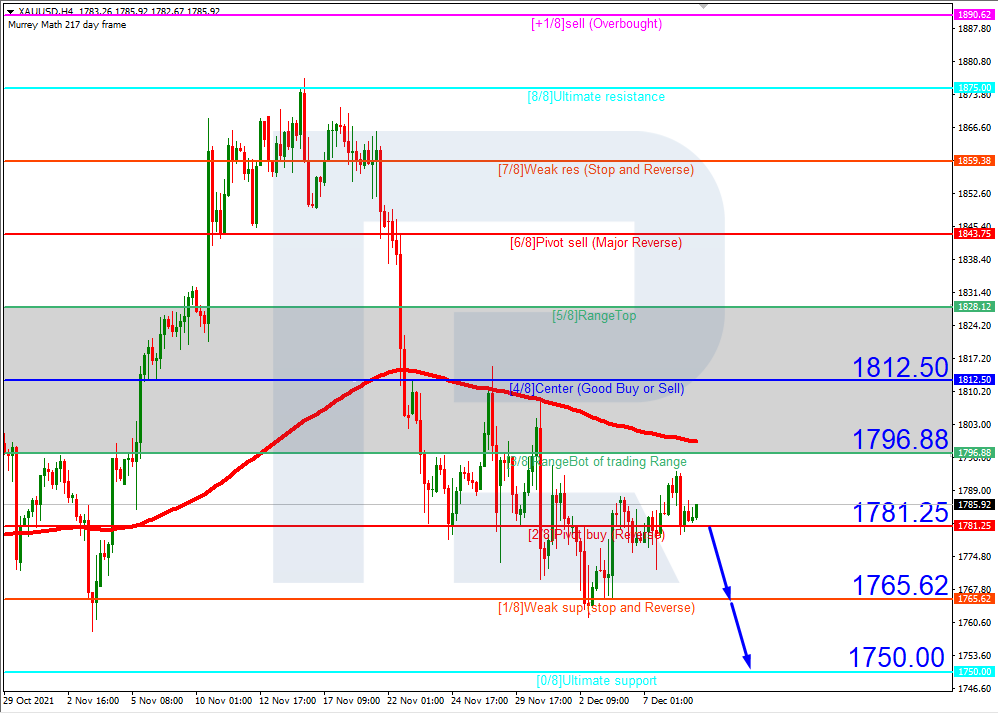
As we can see in the H4 chart, XAUUSD is trading below the 200-day Moving Average, thus indicating a possible descending tendency. In this case, the price is expected to break 2/8 and then move downwards to reach the support at 0/8. However, this scenario may no longer be valid if the price breaks the resistance at 3/8 to the upside. After that, the instrument may reverse and grow towards the next resistance at 5/8.

USDCAD_H4
Risk Warning: the result of previous trading operations do not guarantee the same results in the future

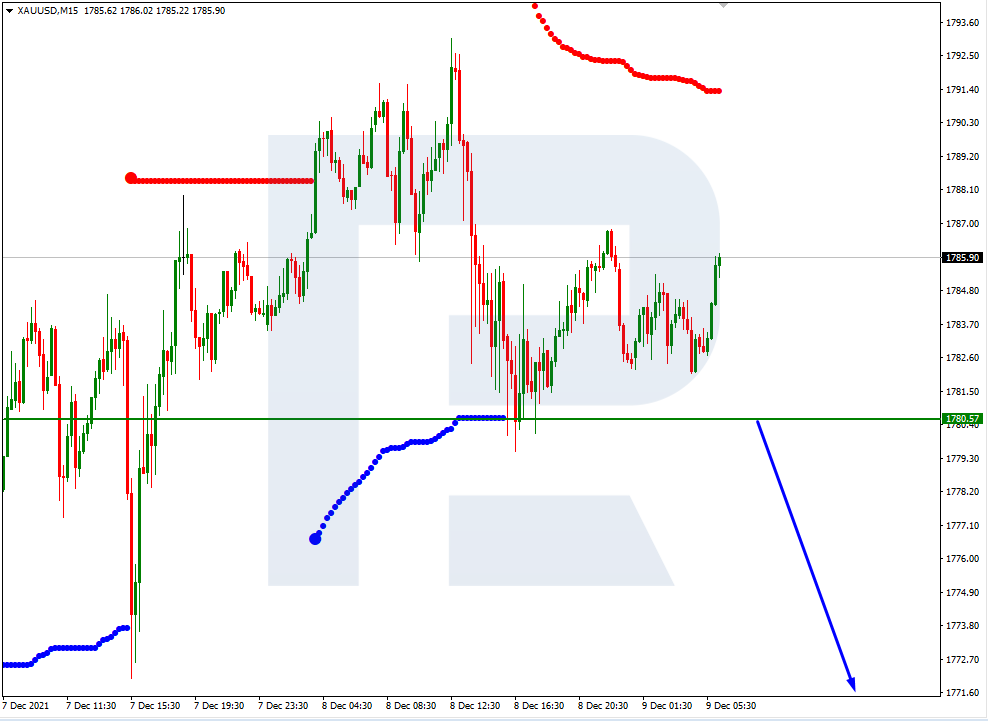
In the M15 chart, the pair may break the downside line of the VoltyChannel indicator and, as a result, continue its decline.

USDCAD_M15

Article By RoboForex.com

Attention!
Forecasts presented in this section only reflect the author’s private opinion and should not be considered as guidance for trading. RoboForex LP bears no responsibility for trading results based on trading recommendations described in these analytical reviews.

USDJPY Has The Intervening Wave Ⓧ Ended?

By Orbex

USDJPY

In the current structure of USDJPY a large triple zigzag consisting of primary sub-waves Ⓦ-Ⓧ-Ⓨ-Ⓧ-Ⓩ is developing.

Most likely, the four parts of this triple zigzag have ended. The last actionary wave Ⓩ is currently under development. This wave will most probably take the form of an intermediate double zigzag (W)-(X)-(Y).

We could be in the final part of the intermediate actionary wave (Y), which could take the form of a triple zigzag W-X-Y-X-Z. Its end is expected near 117.17. At that level, wave Ⓩ will be at 200% of wave Ⓨ.

After reaching the highest point, the market could begin to build a new bearish trend, which will update the previous low of 109.10. The intermediate intervening wave (X) formed this.

USDJPY

Let’s look at an alternative scenario. Perhaps the construction of the bearish primary is still ongoing.

It seems to take the form of a double zigzag (W)-(X)-(Y) of the intermediate degree. The first actionary sub-wave (W) is complete, even though it is not visible on the current chart. Not so long ago, the ascending intervening wave (X) was completed, consisting of minor sub-waves A-B-C.

In the near future, prices could lower towards the 109.74 area.


Orbex-LogoArticle by Orbex

Orbex is a fully licensed broker that was established in 2011. Founded with a mission to serve its traders responsibly and provides traders with access to the world’s largest and most liquid financial markets. www.orbex.com

The Analytical Overview of the Main Currency Pairs on 2021.12.09

by JustForex

The EUR/USD currency pair

Technical indicators of the currency pair:
  • Prev Open: 1.1266
  • Prev Close: 1.1340
  • % chg. over the last day: +0.65%

Yesterday, the European currency strengthened on the back of the dollar index decline, but the situation in the Eurozone remains tense. First, analysts predict a rise in inflation in the region next year as well. Secondly, the energy crisis leads to the bankruptcy of businesses and raises the prices of electricity and natural gas to new highs. Third, supply problems haven’t gone anywhere. Fourth, the ECB has no plans to cut the PEPP program until March 2022. All this suggests that there are no reasons for the Euro strengthening now from a fundamental point of view.

Trading recommendations
  • Support levels: 1.1265, 1.1230, 1.1168
  • Resistance levels: 1.1360, 1.1436, 1.1535, 1.1613, 1.1667, 1.1717

From a technical point of view, the EUR/USD on the hour time frame is still bearish, but the price is approaching the priority change level. Buyers continue to show initiative. At the moment, the price has already been trading above the moving average. The MACD indicator is in the positive zone, with no signs of reversal. Under such market conditions, traders should consider sell positions from the priority change level of 1.1360. Buy trades can be considered on lower time frames, but only with short targets.

Alternative scenario: if the price breaks out through the 1.1360 resistance level and fixes above, the mid-term uptrend will likely resume.

EUR/USD
News feed for 2021.12.09:
  • – US Initial Jobless Claims (w/w) at 15:30 (GMT+2).

The GBP/USD currency pair

Technical indicators of the currency pair:
  • Prev Open: 1.3231
  • Prev Close: 1.3203
  • % chg. over the last day: -0.21%

The British pound fell to a one-year low Wednesday after British Prime Minister Boris Johnson imposed tighter restrictions in England to counter the spread of the Omicron variant. Now people need to work from home, wear masks in public places, and use vaccination passes.

Trading recommendations
  • Support levels: 1.3188
  • Resistance levels: 1.3232, 1.3289, 1.3326, 1.3434, 1.3507, 1.3575, 1.3685

On the hourly time frame, the trend on GBP/USD is bearish. The British pound is under sellers’ pressure. The MACD indicator is in the negative zone, but there are signs of divergence on several time frames, which means that a technical rebound should be expected. Under such market conditions, traders should consider sell positions from the resistance levels around the moving average or from the upper border of the descending channel. Buy trades should be considered from the support level of the higher time frame, but only with additional confirmation.

Alternative scenario: if the price breaks out through the 1.3326 resistance level and consolidates above, the bullish scenario will likely resume.

GBP/USD
There is no news feed for today.

The USD/JPY currency pair

Technical indicators of the currency pair:
  • Prev Open: 113.55
  • Prev Close: 113.68
  • % chg. over the last day: +0.11%

From a fundamental point of view, there is no reason for the JPY to strengthen right now. Firstly, Japan has downgraded GDP in Q3 due to a bigger drop in consumer spending. Second, the risks associated with the Omicron option are decreasing, causing investors to shift assets from the safe haven currency to other riskier and more profitable assets. Third, Japan’s central bank introduced a record $490 billion stimulus package to support the economy.

Trading recommendations
  • Support levels: 112.62, 112.30
  • Resistance levels: 113.94, 114.17, 115.15, 115.50

The global trend on the USD/JPY currency pair is bearish. But the pressure of buyers is increasing, and the price is approaching the priority change level. Under such market conditions, traders can look for sales from the priority change level but with additional confirmation. Buy positions should be considered from the lower border of the corridor, but with additional confirmation in the form of a buyers’ initiative.

Alternative scenario: if the price rises above 114.17, the uptrend will likely resume.

USD/JPY
There is no news feed for today.

The USD/CAD currency pair

Technical indicators of the currency pair:
  • Prev Open: 1.2636
  • Prev Close: 1.2650
  • % chg. over the last day: +0.11%

Canada’s central bank left its key interest rate unchanged as expected. The statement also said the bank does not plan to raise its key rate until April-September of next year. But the Bank of Canada is keeping a close eye on inflation expectations and labor costs in order to control the growth.

Trading recommendations
  • Support levels: 1.2638, 1.2597, 1.2502, 1.2416
  • Resistance levels: 1.2726, 1.2776, 1.2828

From a technical point of view, the USD/CAD currency trend has changed to bearish. The MACD indicator has become inactive. Under such market conditions, it is better to look for buy trades from the 1.2638 support level, but only after additional confirmation in the form of a buyers’ initiative. It is better to consider sell deals from the resistance levels near the moving average.

Alternative scenario: if the price breaks out through the 1.2776 resistance level and fixes above, the downtrend will likely be broken.

USD/CAD
There is no news feed for today.

by JustForex


This article reflects a personal opinion and should not be interpreted as an investment advice, and/or offer, and/or a persistent request for carrying out financial transactions, and/or a guarantee, and/or a forecast of future events.

Intraday Market Analysis – USD Continues To Soften

By Orbex

USDCAD tests key support

USDCAD

The Canadian dollar inched lower after the BOC left its interest rate unchanged as expected. The pair has met stiff selling pressure at the supply zone around 1.2850, a triple top on the daily chart.

A drop below 1.2720 has forced out short-term buyers. 1.2580 is the next support and it sits on the 30-day moving average. A bearish breakout would deepen the correction to the psychological level of 1.2500.

On the upside, the bulls will need to clear 1.2770 before they could have another attempt at the supply zone.

USOIL rebounds from demand zone

US OIL

WTI crude bounces back on signs that the new virus strain has a limited impact on demand.

Price action met strong buying interest near last August’s lows at 62.00, a major support from the daily chart to keep the uptrend intact. A bullish RSI divergence in this congestion area indicates a loss of momentum in the bearish drive.

Then a rally above 69.30 forced the sellers to exit, opening the door for an extension towards 79.00. The initial surge has pushed the RSI into the overbought territory. 68.00 is an immediate support.

GER 40 to test major resistance

GER 40

The Dax 40 recoups losses as fears of the omicron variant start to subside.

Last October’s lows near 14900 have proven to be a solid support. The rally above 15520 stirred up volatility as the last sellers rushed to the exit. The bulls are pushing towards 15920, where the index took a nosedive in late November.

A bullish breakout could attract more buying interest and turn market sentiment around. Meanwhile, an overbought RSI has caused a pullback, giving time for the bulls to accumulate. 15300 is the closest support.


Orbex-LogoArticle by Orbex

Orbex is a fully licensed broker that was established in 2011. Founded with a mission to serve its traders responsibly and provides traders with access to the world’s largest and most liquid financial markets. www.orbex.com

China’s Inflation And The Impact On Global Currencies

By Orbex

– The general turnaround in risk sentiment this week has largely been attributed to the latest studies pointing to the omicron variant being less virulent than prior variants.

But what also gave the market a push early on Monday was the PBOC cutting their Reserve Requirement Ratio, or triple-R. That saw the start of the rally in markets in Asia. And it has some interesting effects on commodity currencies in particular.

Unlike other central banks which regulate policy through interest rates, the PBOC uses their RRR facility to maintain the monetary policy. Cutting reserve requirements is equivalent to monetary policy easing.

Usually, these moves come as a surprise to the market, since the PBOC doesn’t make these decisions as part of regular meetings. Nonetheless, the situation in China was such that most of the market was already expecting it.

Things aren’t getting better yet

The RRR cut was equivalent to injecting CNY1.2T into the Chinese financial system. The central bank followed up with a further cut directed specifically towards SMEs.

However, they stressed that this isn’t more “easing”. Analysts expected that response, given the constraints on lending due to the housing crisis.

Throughout Monday and Tuesday, we also got reports from major Chinese construction firms on their contracted sales data. They all reported a dramatic drop in housing sales.

Evergrande, for example, saw sales dropping almost by 60%, compared to the same period last year. Sunshine 100 saw the most dramatic results, with their November sales dropping well over 90% compared to last year.

More money, but at what price?

More and more Chinese builders warn they won’t be able to make payments (the latest being Aoyuan Property Group, with monthly sales in excess of CNY7.0B). So the credit situation in China remains tight. This means that the PBOC will likely need to continue to provide liquidity injections.

On another note, China reports inflation data tomorrow. Analysts project the annual November China CPI change to come in at 2.5%. That is a dramatic increase from the 1.5% recorded in October and it would be the highest rate since July of last year.

Therefore, the PBOC is forced to increase liquidity while inflation is already on the rise, suggesting that there isn’t a stopgap for inflation moving higher.

Back to normal might not be such a good thing

Inflation in China was on the rise before the pandemic, breaking above the annual 5.0% in January of last year. Then the subsequent recession naturally cut inflation back. But it has been creeping higher all this year, as the world economy moves back to normal.

During the pandemic, the Chinese government provided ample stimulus to the economy which contributed to the run-up in raw material prices. It would be surprising if China didn’t have a run-up in inflation just like the rest of the world.

Nonetheless, given the housing situation, the PBOC could be in a very uncomfortable position to do something about it, unlike other central banks.

Higher inflation might imply a weaker yuan over the coming months. With less purchasing power, Chinese firms might lose their appetite for commodities. Also, the AUD and NZD might finally run out of steam and could react negatively to increased inflation in China.


Orbex-LogoArticle by Orbex

Orbex is a fully licensed broker that was established in 2011. Founded with a mission to serve its traders responsibly and provides traders with access to the world’s largest and most liquid financial markets. www.orbex.com

Intraday Market Analysis – USD Edges Lower

By Orbex

EURUSD seeks support

EURUSD

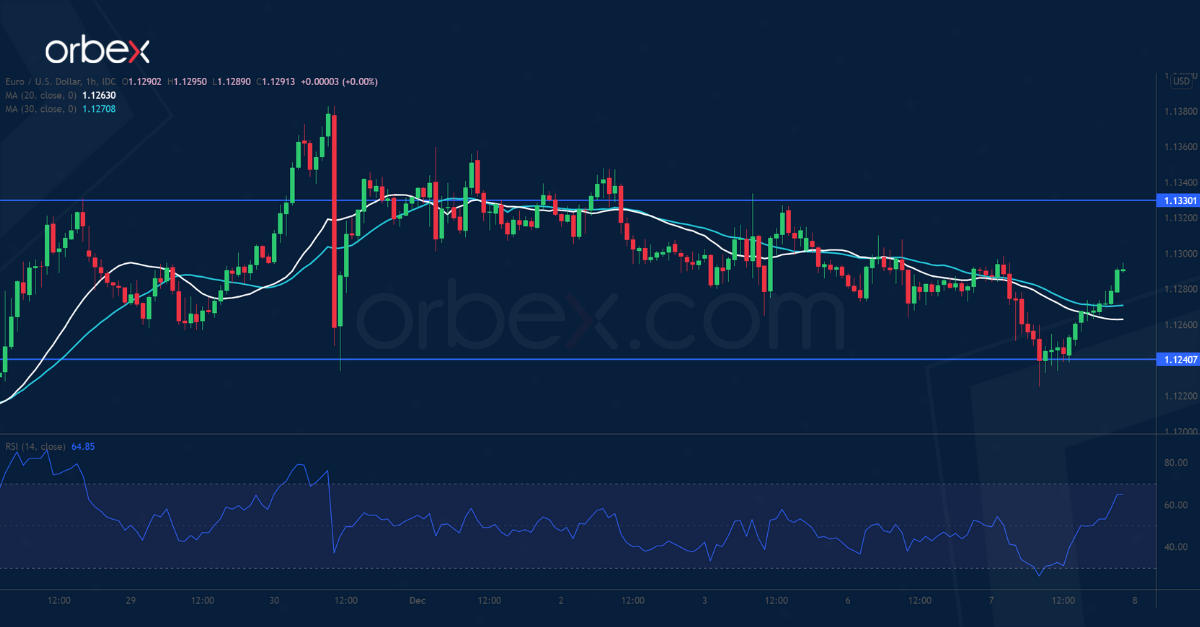
The euro bounced higher after the bloc’s Q3 GDP beat expectations. A previous rebound was capped by the 20-day moving average, suggesting that the bearish sentiment still prevails.

The RSI’s double top in the overbought area has prompted short-term buyers to take profit. The pair has met support above 1.1240. The bulls will need to lift offers around 1.1330 before they could attract momentum buyers.

A bearish breakout would send the price to the floor at 1.1190. Its breach would trigger a new round of sell-off.

AUDUSD breaks higher

AUDUSD

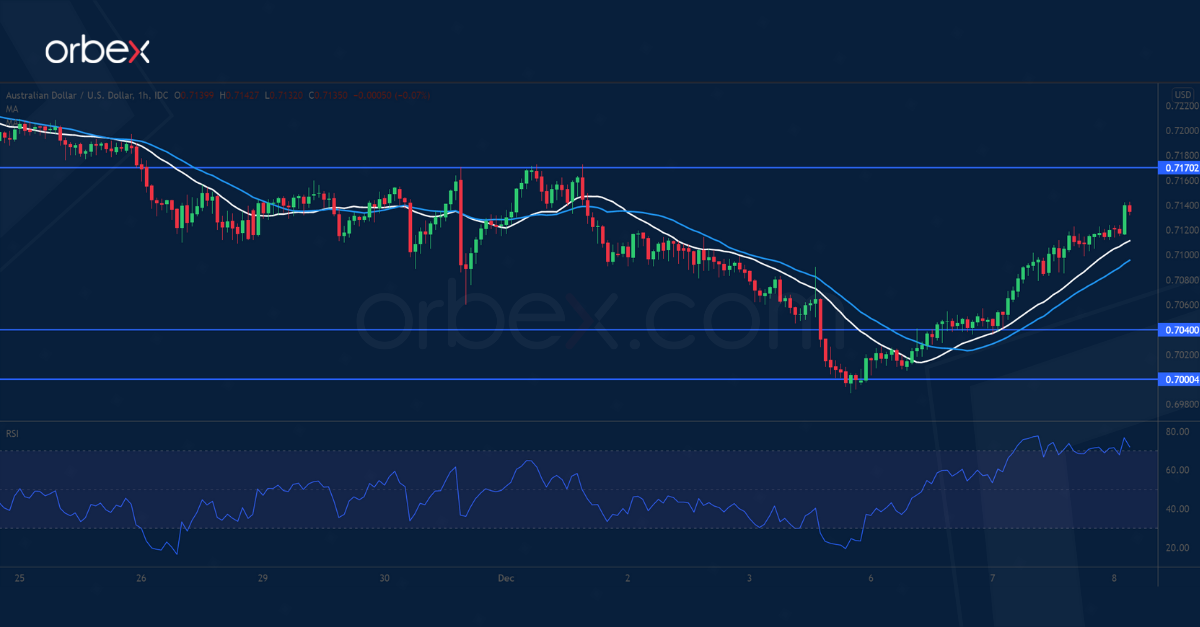
The Australian dollar soared after the RBA remained optimistic about the economic recovery. The pair saw strong buying interest at the psychological level of 0.7000, which also sits near November 2020’s lows.

An oversold RSI on the daily chart compounds the ‘buying-the-dips’ behavior. An initial pop above 0.7070 forced bearish trend followers to cover their latest bets.

0.7170 would be the next target though the RSI’s overbought situation may limit the surge. 0.7040 is the first support for buyers to regroup and accumulate.

USDJPY attempts to rebound

USDJPY

The yen stalled after Japan’s GDP showed an unexpected contraction in Q3.

A break below the daily support at 112.70 has put the bulls on the defensive. The latest consolidation is a sign of indecision as to whether the correction would continue.

The greenback found support over 112.50 and a close above 113.95 could help the bulls regain the upper hand. Then the psychological level of 115.00 would be the next step before the uptrend could resume.

On the downside, a fall below 113.10 would retest the key support at 112.50.


Orbex-LogoArticle by Orbex

Orbex is a fully licensed broker that was established in 2011. Founded with a mission to serve its traders responsibly and provides traders with access to the world’s largest and most liquid financial markets. www.orbex.com