Article By RoboForex.com
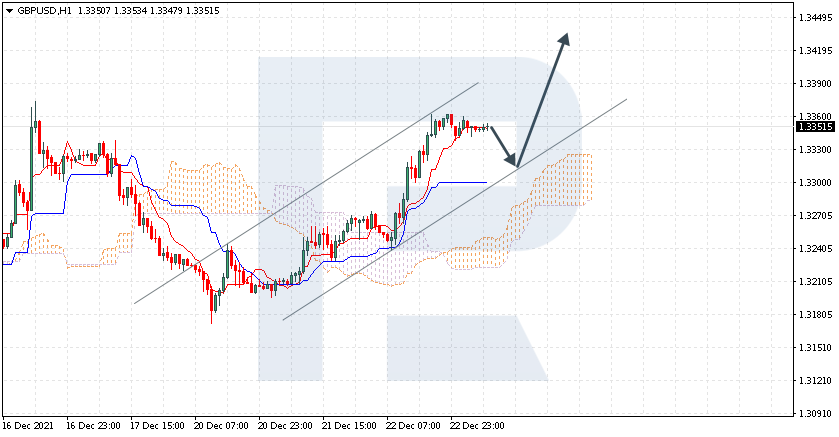
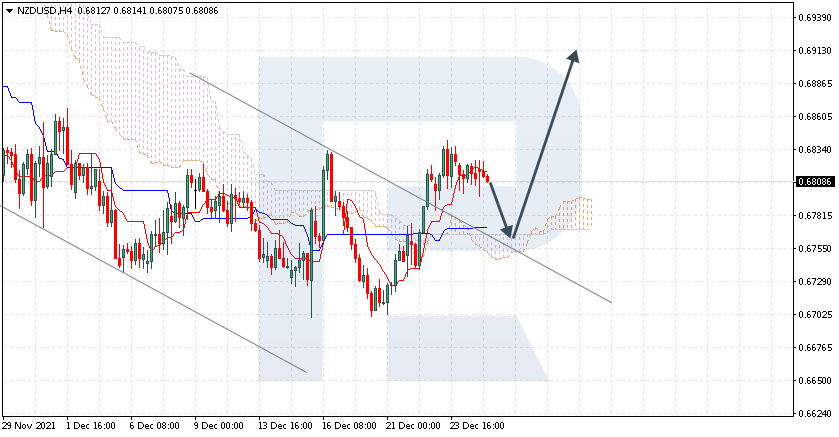
NZDUSD, “New Zealand Dollar vs US Dollar”
NZDUSD is trading at 0.6808; the instrument is moving above Ichimoku Cloud, thus indicating an ascending tendency. The markets could indicate that the price may test the cloud’s upside border at 0.6765 and then resume moving upwards to reach 0.6915. Another signal in favour of a further uptrend will be a rebound from the descending channel’s upside border. However, the bullish scenario may no longer be valid if the price breaks the cloud’s downside border and fixes below 0.6720. In this case, the pair may continue falling towards 0.6635. To confirm further growth, the asset must break the resistance level and fix above 0.6845; so far, bulls haven’t been able to break this area.

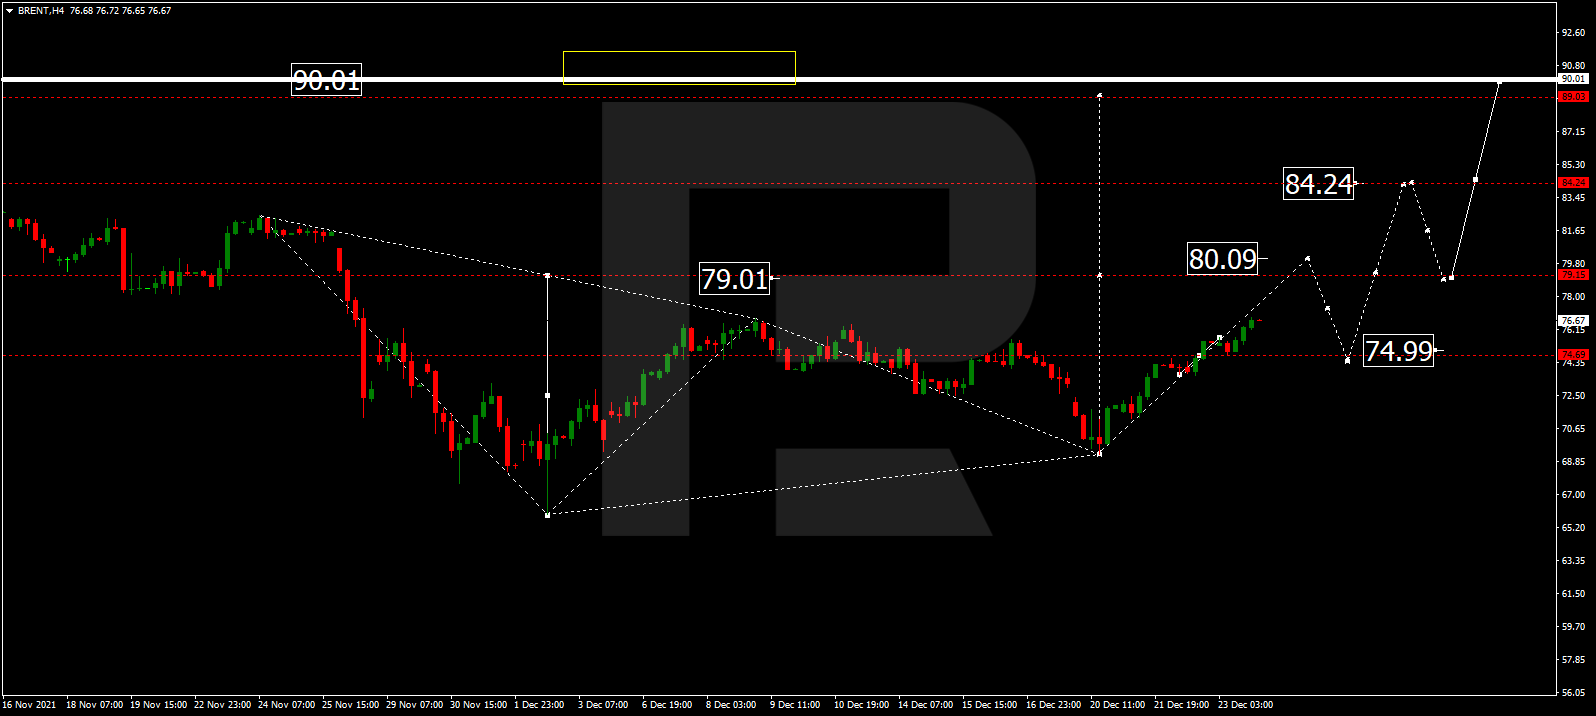
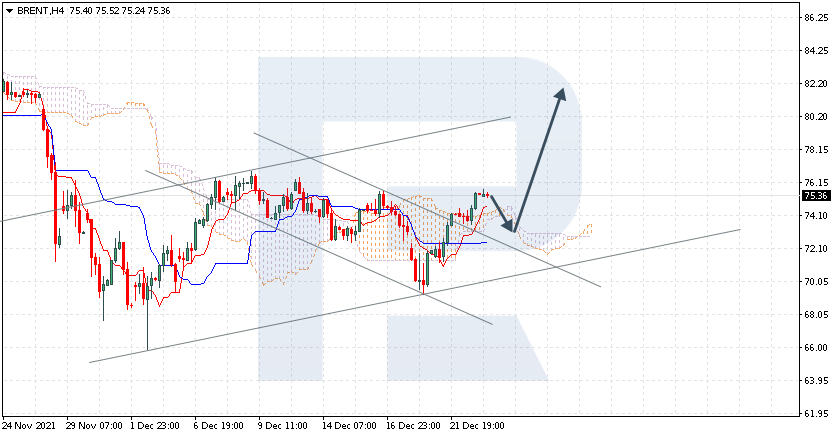
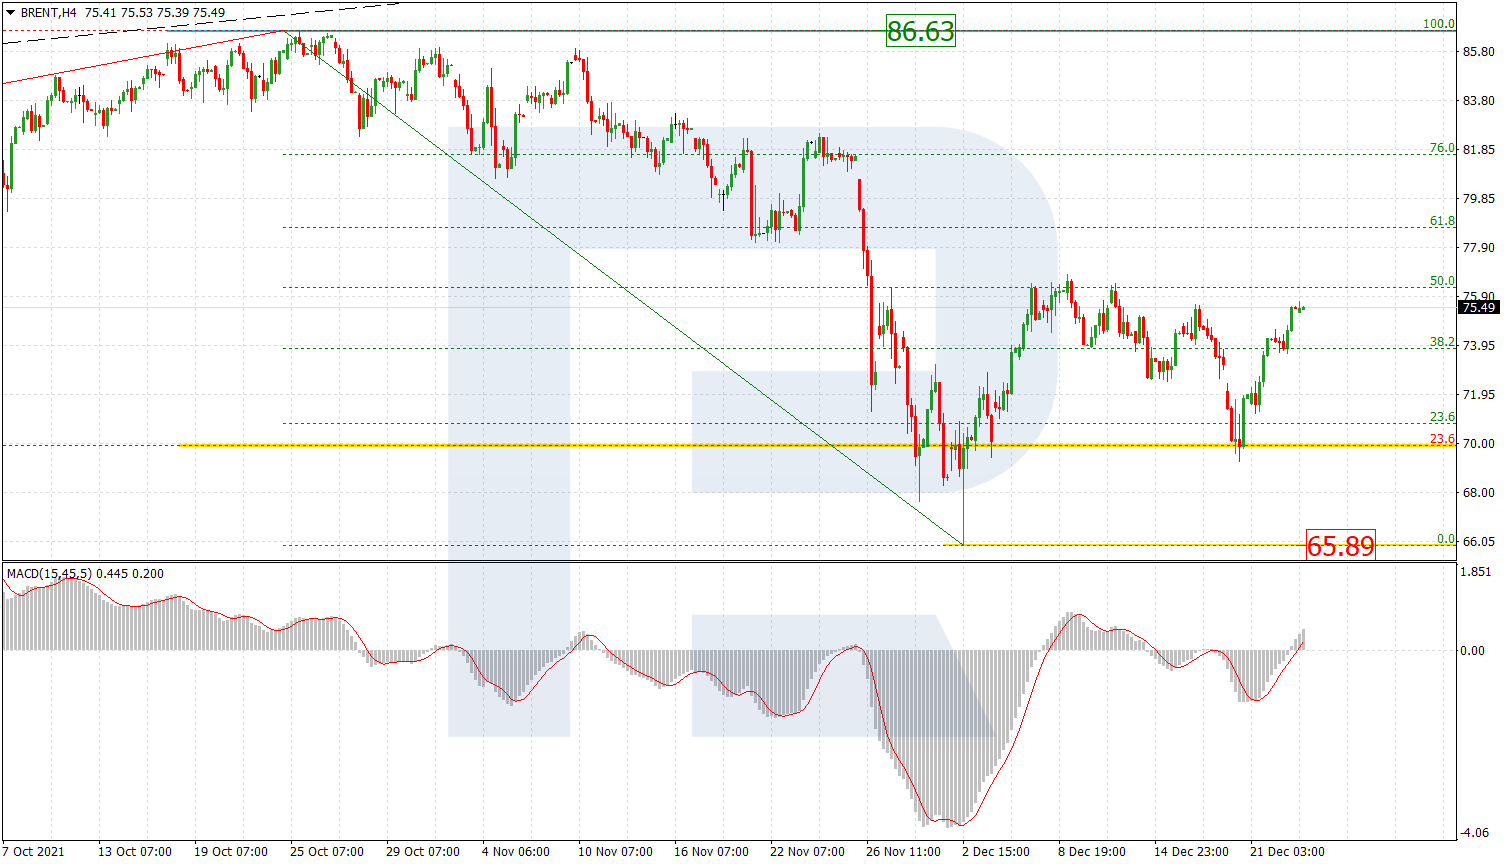
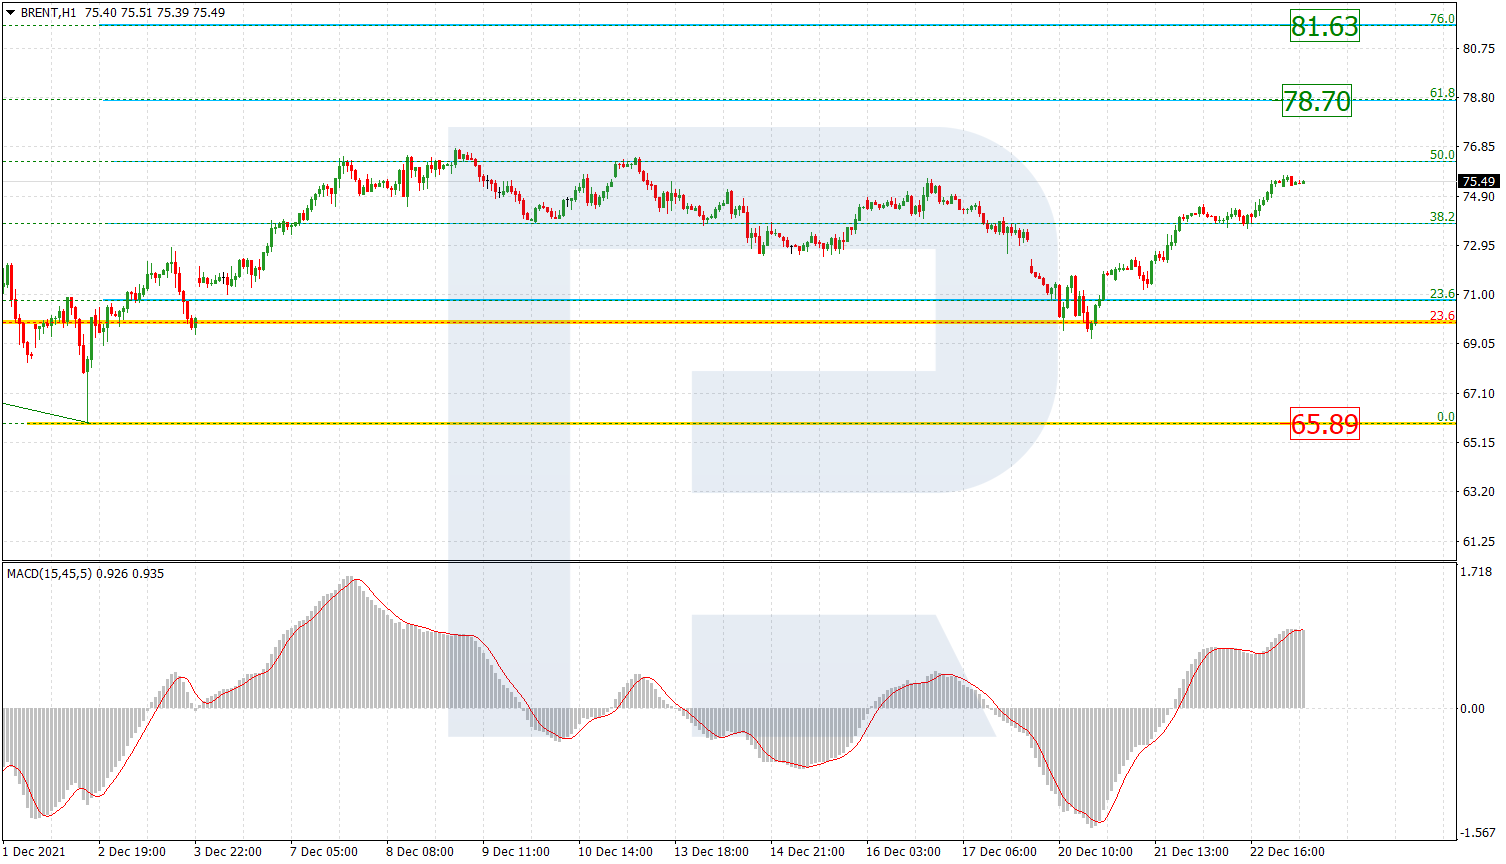
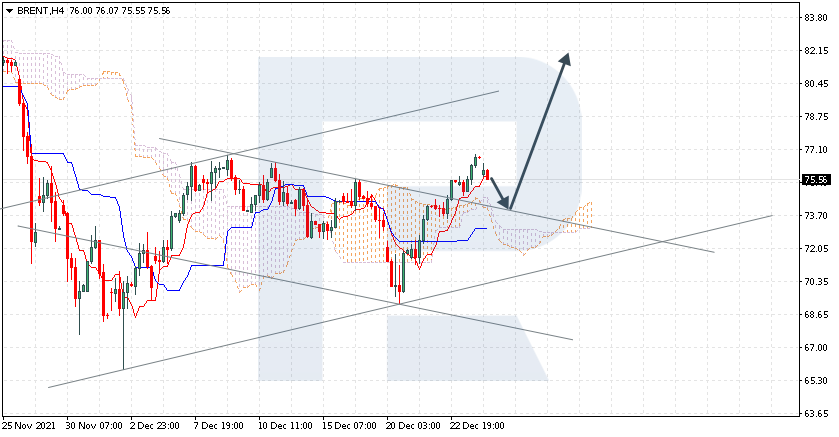
BRENT
Brent is trading at 75.56; the instrument is moving above Ichimoku Cloud, thus indicating an ascending tendency. The markets could indicate that the price may test the cloud’s upside border at 73.70 and then resume moving upwards to reach 82.15. Another signal in favour of a further uptrend will be a rebound from the descending channel’s upside border. However, the bullish scenario may no longer be valid if the price breaks the cloud’s downside border and fixes below 70.35. In this case, the pair may continue falling towards 67.65.
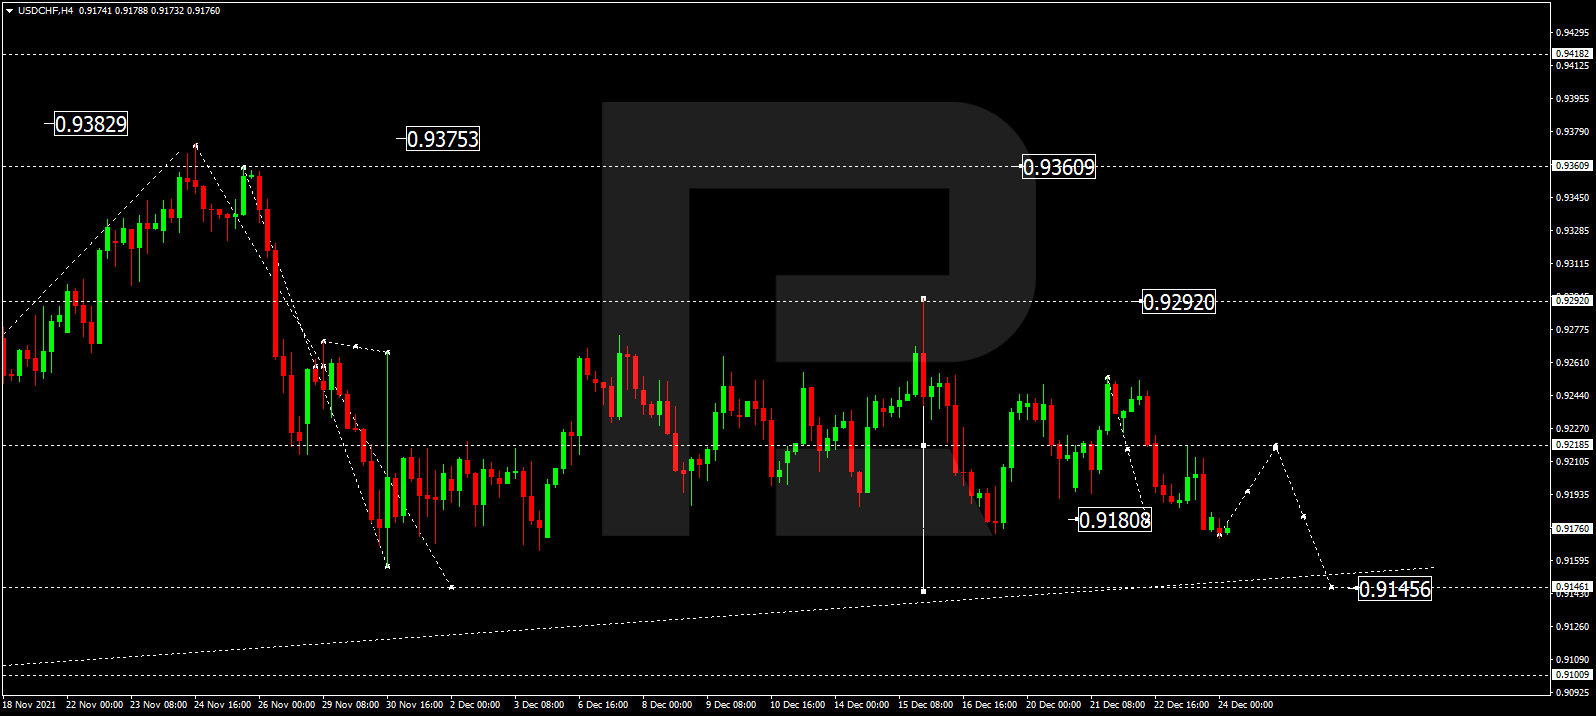
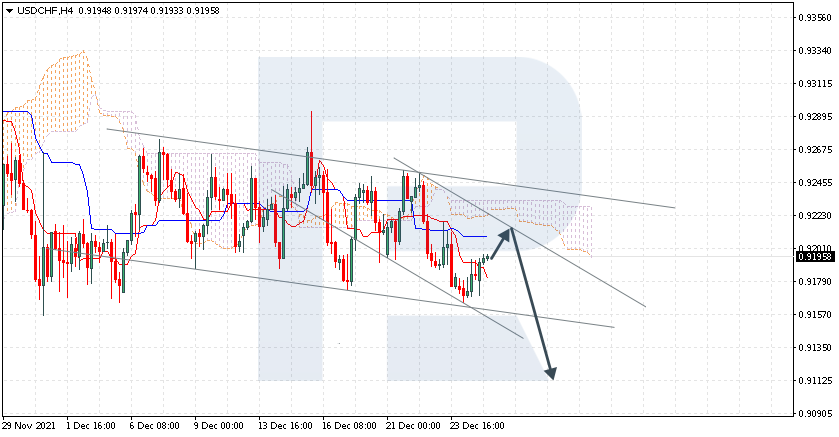
USDCHF, “US Dollar vs Swiss Franc”
USDCHF is trading at 0.9195; the instrument is moving below Ichimoku Cloud, thus indicating a descending tendency. The markets could indicate that the price may test Tenkan-Sen and Kijun-Sen at 0.9205 and then resume moving downwards to reach 0.9115. Another signal in favour of a further downtrend will be a rebound from the descending channel’s upside border. However, the bearish scenario may no longer be valid if the price breaks the cloud’s upside border and fixes above 0.9250. In this case, the pair may continue growing towards 0.9340. To confirm further decline, the asset must break the descending channel’s downside border and fix below 0.9140; in this case, the asset may continue falling and cover the distance equal to the descending channel’s width.
Article By RoboForex.com
Attention!
Forecasts presented in this section only reflect the author’s private opinion and should not be considered as guidance for trading. RoboForex LP bears no responsibility for trading results based on trading recommendations described in these analytical reviews.