By InvestMacro | COT | Data Tables | COT Leaders | Downloads | COT Newsletter
Here are the latest charts and statistics for the Commitment of Traders (COT) data published by the Commodities Futures Trading Commission (CFTC). The latest release was delayed by the CFTC due to the Christmas holiday.
The latest COT data is updated through Tuesday December 21st 2021 and shows a quick view of how large traders (for-profit speculators and commercial entities) were positioned in the futures markets. All currency positions are in direct relation to the US dollar where, for example, a bet for the euro is a bet that the euro will rise versus the dollar while a bet against the euro will be a bet that the euro will decline versus the dollar.
Highlighting the COT currency data was the bounce back in the US Dollar Index bullish positions after two straight down weeks. The speculative bets for the dollar index rose by the largest one-week total of the past eleven weeks and brought the overall bullish position back over the +35,000 level. Overall, the dollar index positioning has now been continually bullish since July 6th, a span of twenty-five straight weeks. The last twelve weeks have seen positions above +30,000 net contracts which is the first time that has happened since early 2019.
Joining the US Dollar Index (3,874 contracts) with positive changes last week were the yen (1,237 contracts), Mexican peso (5,881 contracts), Euro (1,717 contracts) and the Canadian dollar (3,251 contracts).
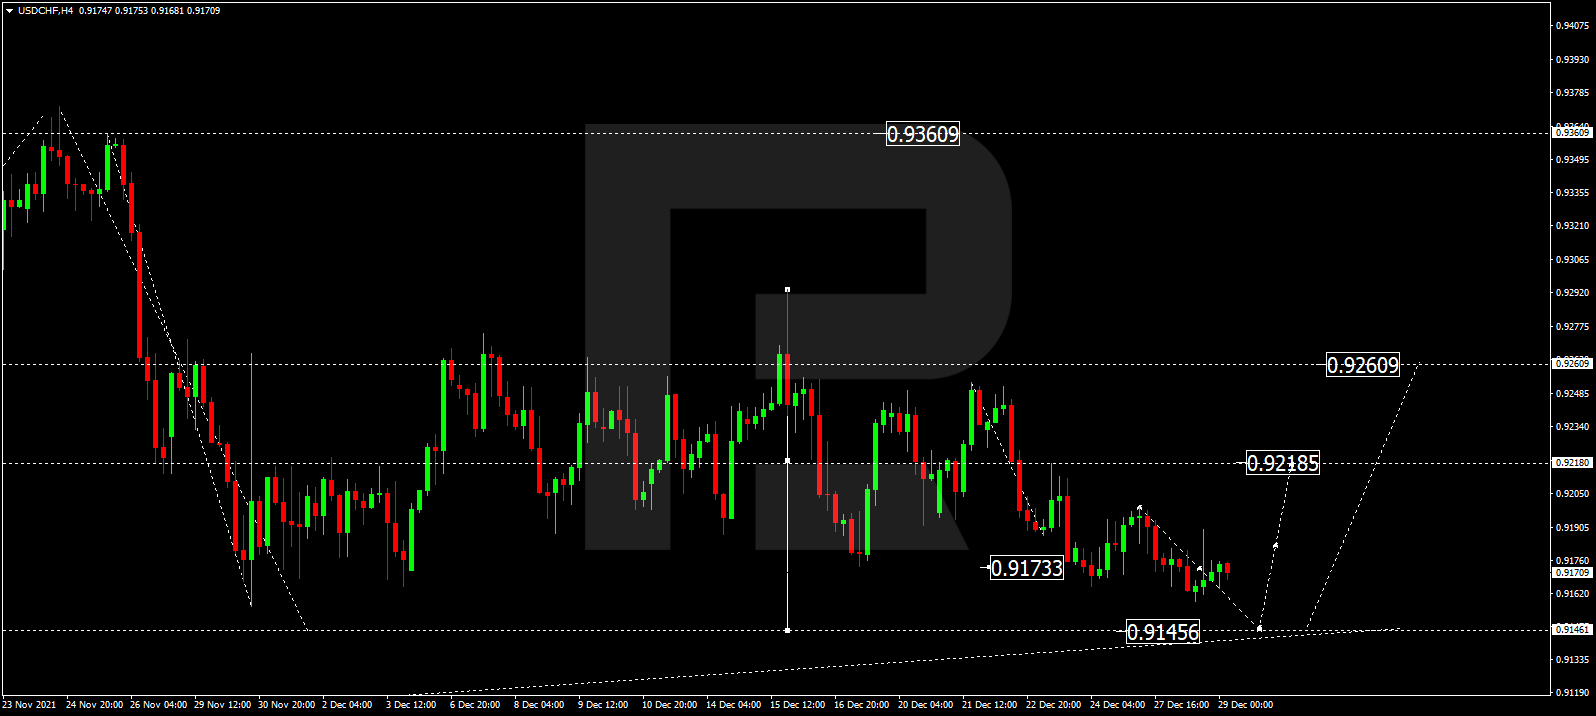
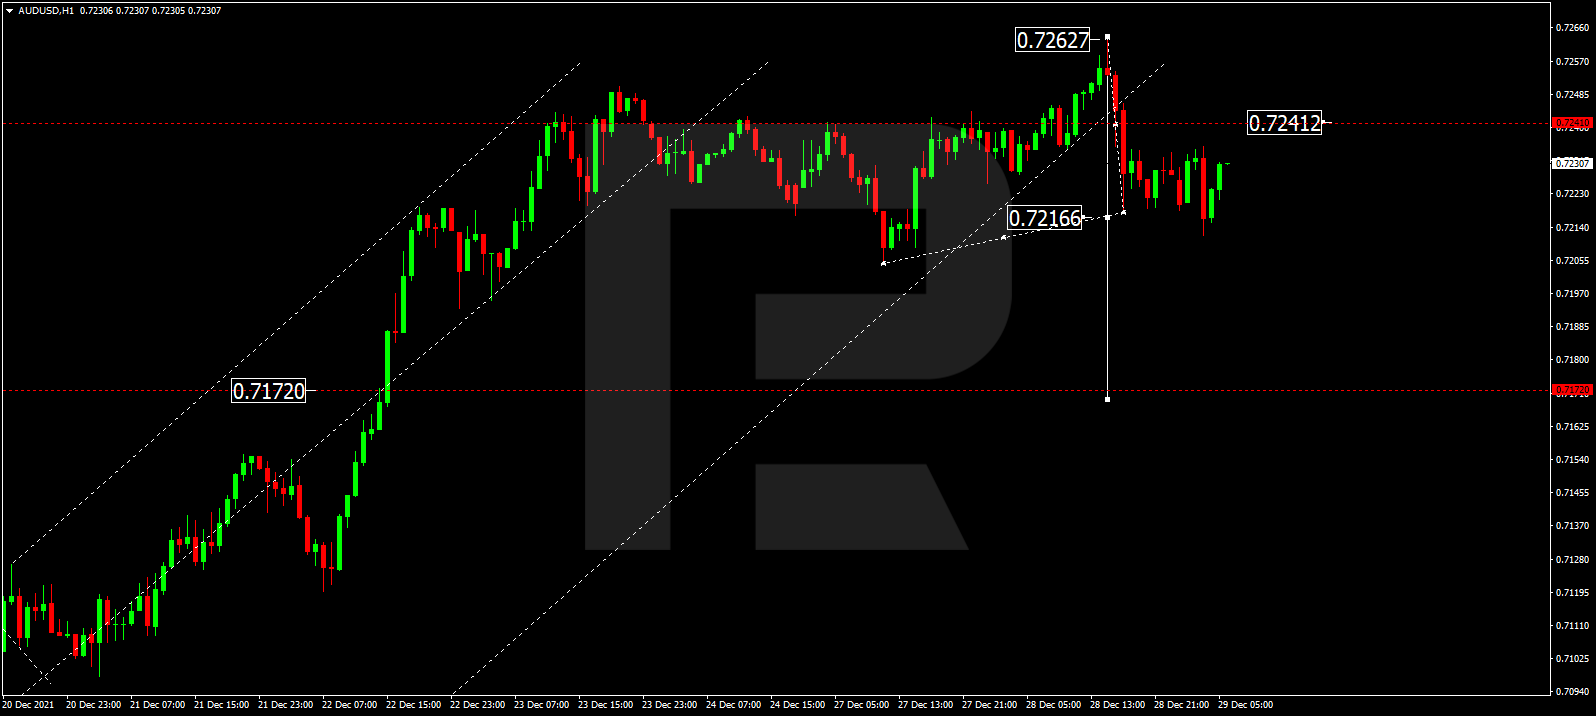
The currencies with declining bets last week were the Russian ruble (-7,903 contracts), Bitcoin (-106 contracts), Brazil real (-1,930 contracts), Swiss franc (-891 contracts), British pound sterling (-6,938 contracts), New Zealand dollar (-275 contracts) and the Australian dollar (-1,451 contracts).
| Dec-21-2021 | OI | OI-Index | Spec-Net | Spec-Index | Com-Net | COM-Index | Smalls-Net | Smalls-Index |
|---|
| USD Index | 56,162 | 81 | 35,115 | 86 | -40,331 | 8 | 5,216 | 74 |
| EUR | 672,239 | 73 | -10,162 | 32 | -15,626 | 71 | 25,788 | 17 |
| GBP | 207,747 | 44 | -57,686 | 32 | 71,124 | 72 | -13,438 | 28 |
| JPY | 183,743 | 44 | -52,286 | 35 | 71,159 | 72 | -18,873 | 9 |
| CHF | 40,920 | 15 | -9,227 | 54 | 15,945 | 49 | -6,718 | 44 |
| CAD | 145,562 | 27 | -9,877 | 47 | 7,440 | 56 | 2,437 | 35 |
| AUD | 191,309 | 76 | -80,354 | 9 | 98,033 | 92 | -17,679 | 9 |
| NZD | 41,354 | 27 | -6,136 | 61 | 8,866 | 44 | -2,730 | 21 |
| MXN | 94,469 | 0 | -4,792 | 25 | 6,382 | 75 | -1,590 | 36 |
| RUB | 45,372 | 46 | 8,621 | 34 | -9,877 | 63 | 1,256 | 69 |
| BRL | 30,811 | 28 | -6,547 | 60 | 7,228 | 43 | -681 | 59 |
| Bitcoin | 12,852 | 72 | -878 | 83 | 39 | 0 | 839 | 32 |
US Dollar Index Futures:
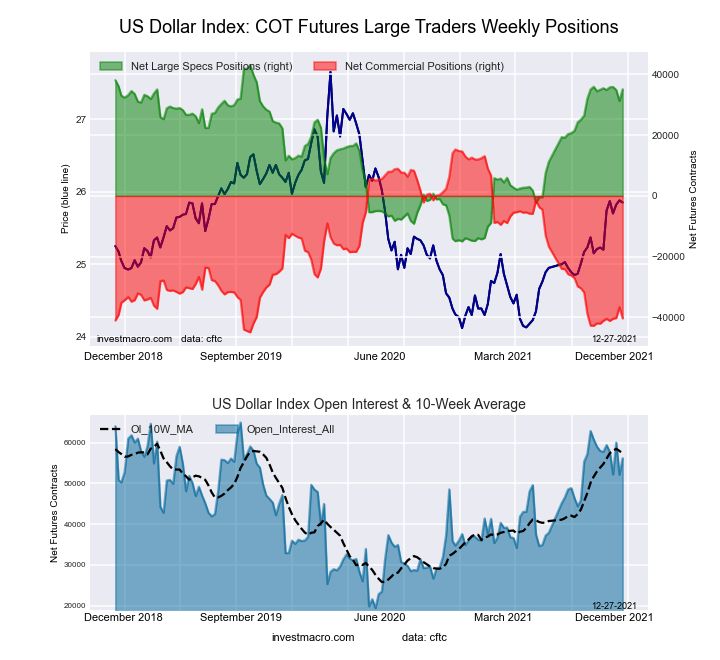 The US Dollar Index large speculator standing this week totaled a net position of 35,115 contracts in the data reported through Tuesday. This was a weekly lift of 3,874 contracts from the previous week which had a total of 31,241 net contracts.
This week’s current strength score (the trader positioning range over the past three years, measured from 0 to 100) shows the speculators are currently Bullish-Extreme with a score of 86.4 percent. The commercials are Bearish-Extreme with a score of 7.6 percent and the small traders (not shown in chart) are Bullish with a score of 73.6 percent.
| US DOLLAR INDEX Statistics | SPECULATORS | COMMERCIALS | SMALL TRADERS |
| – Percent of Open Interest Longs: | 82.3 | 3.5 | 12.3 |
| – Percent of Open Interest Shorts: | 19.8 | 75.3 | 3.0 |
| – Net Position: | 35,115 | -40,331 | 5,216 |
| – Gross Longs: | 46,222 | 1,941 | 6,886 |
| – Gross Shorts: | 11,107 | 42,272 | 1,670 |
| – Long to Short Ratio: | 4.2 to 1 | 0.0 to 1 | 4.1 to 1 |
| NET POSITION TREND: | | | |
| – Strength Index Score (3 Year Range Pct): | 86.4 | 7.6 | 73.6 |
| – Strength Index Reading (3 Year Range): | Bullish-Extreme | Bearish-Extreme | Bullish |
| NET POSITION MOVEMENT INDEX: | | | |
| – 6-Week Change in Strength Index: | -0.6 | 1.3 | -4.7 |
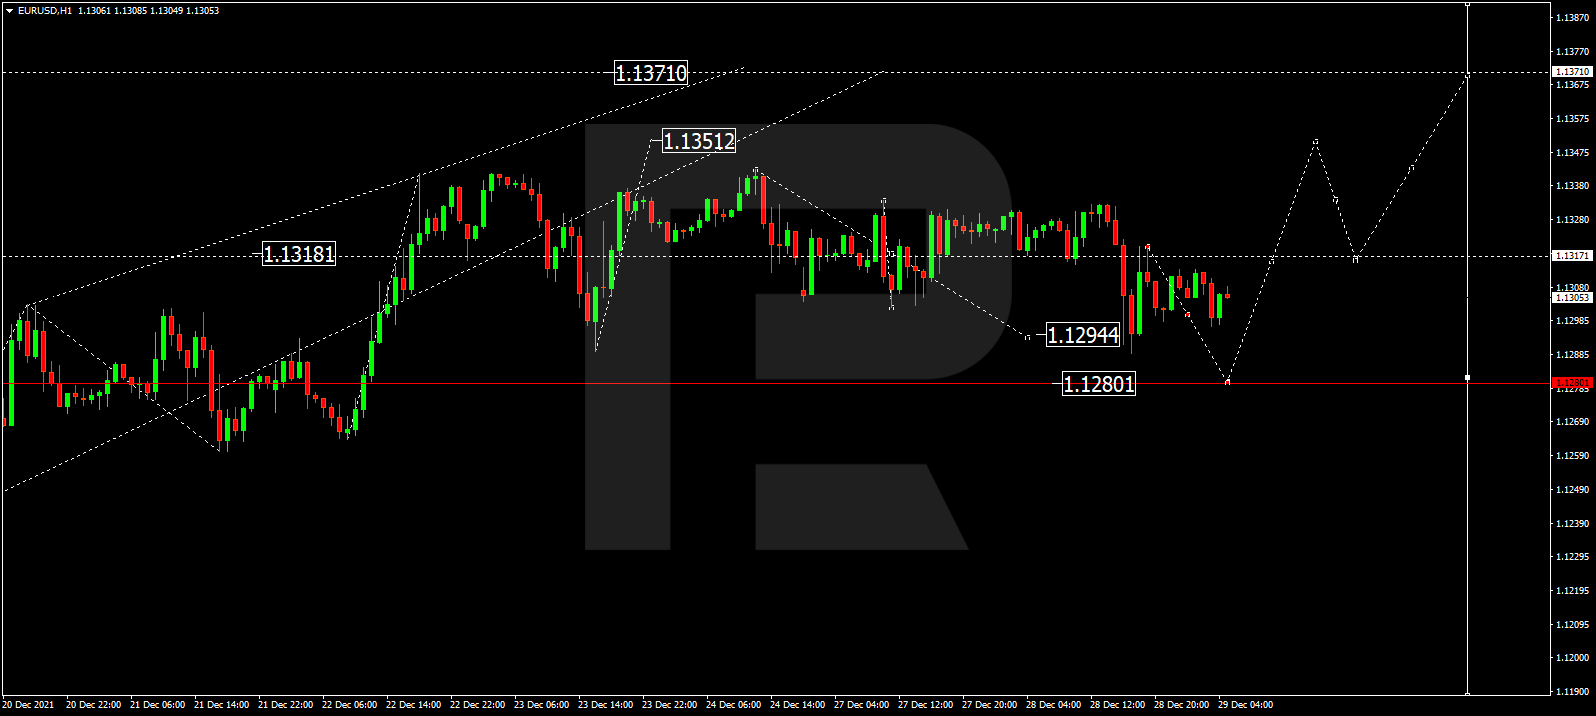
Euro Currency Futures:
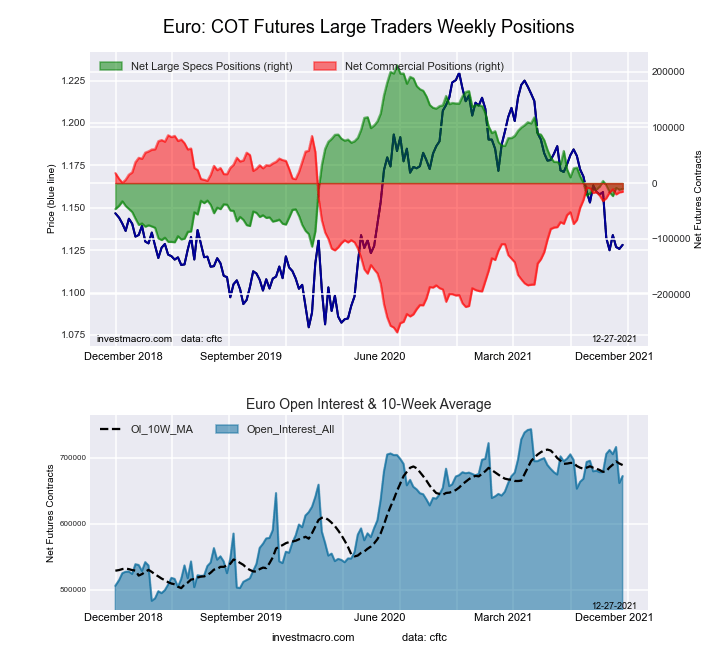 The Euro Currency large speculator standing this week totaled a net position of -10,162 contracts in the data reported through Tuesday. This was a weekly rise of 1,717 contracts from the previous week which had a total of -11,879 net contracts.
This week’s current strength score (the trader positioning range over the past three years, measured from 0 to 100) shows the speculators are currently Bearish with a score of 31.9 percent. The commercials are Bullish with a score of 71.3 percent and the small traders (not shown in chart) are Bearish-Extreme with a score of 17.1 percent.
| EURO Currency Statistics | SPECULATORS | COMMERCIALS | SMALL TRADERS |
| – Percent of Open Interest Longs: | 29.2 | 56.8 | 11.8 |
| – Percent of Open Interest Shorts: | 30.8 | 59.1 | 7.9 |
| – Net Position: | -10,162 | -15,626 | 25,788 |
| – Gross Longs: | 196,595 | 381,670 | 79,101 |
| – Gross Shorts: | 206,757 | 397,296 | 53,313 |
| – Long to Short Ratio: | 1.0 to 1 | 1.0 to 1 | 1.5 to 1 |
| NET POSITION TREND: | | | |
| – Strength Index Score (3 Year Range Pct): | 31.9 | 71.3 | 17.1 |
| – Strength Index Reading (3 Year Range): | Bearish | Bullish | Bearish-Extreme |
| NET POSITION MOVEMENT INDEX: | | | |
| – 6-Week Change in Strength Index: | -4.3 | 4.6 | -4.1 |
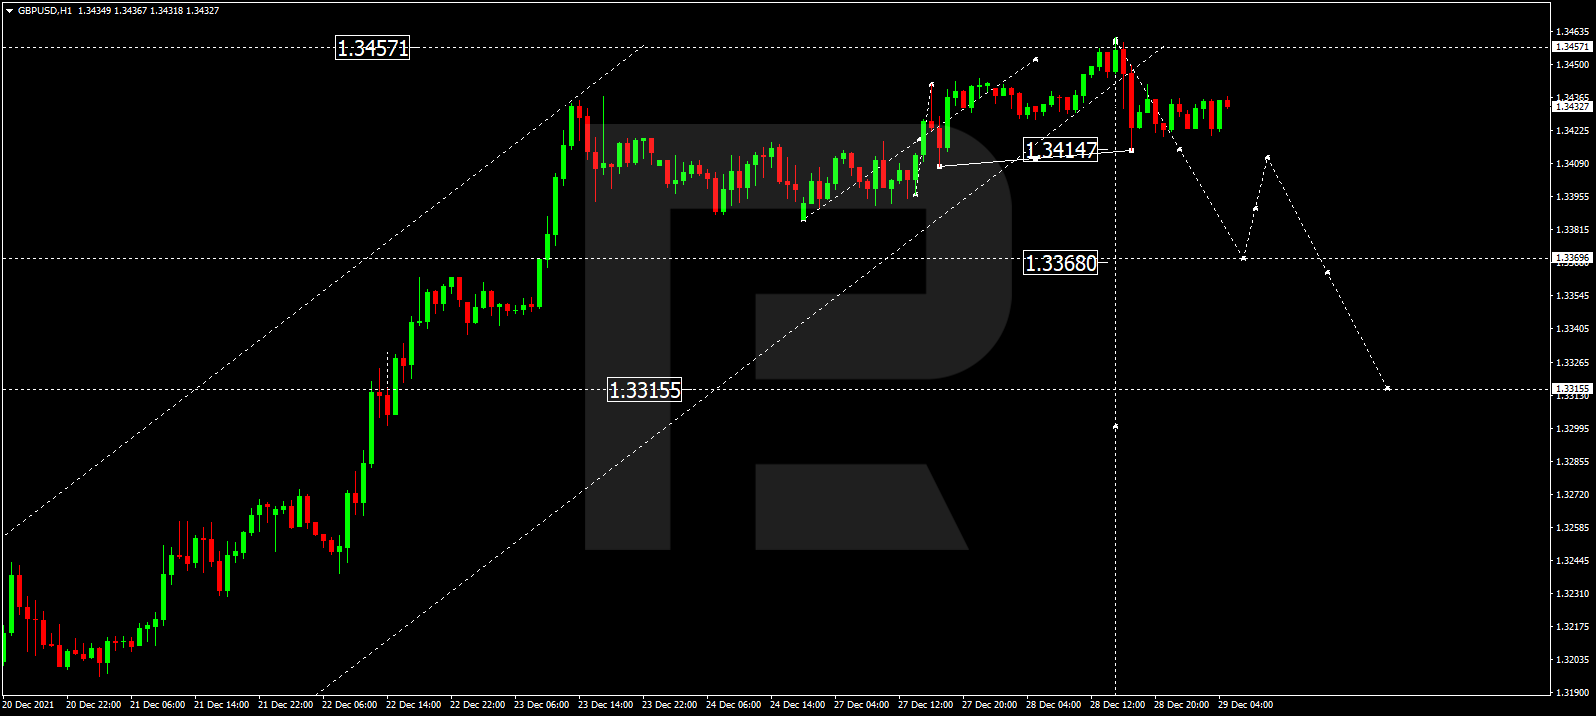
British Pound Sterling Futures:
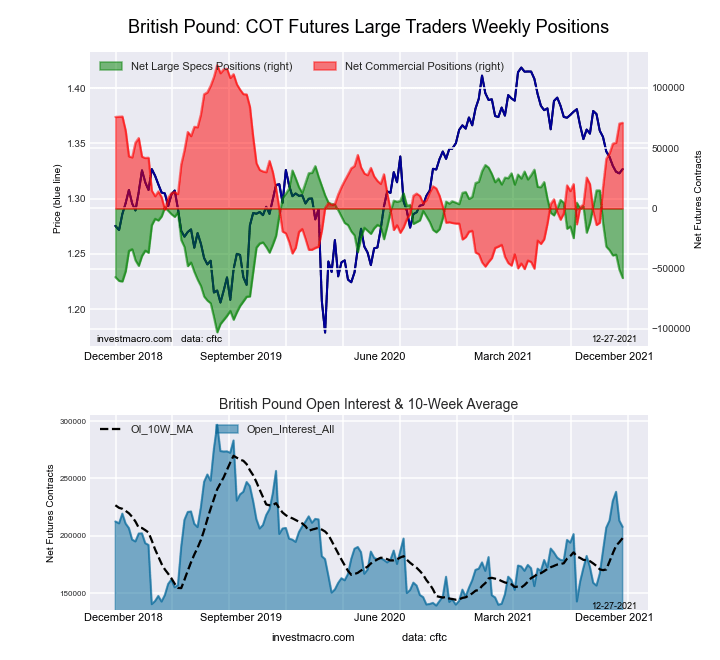 The British Pound Sterling large speculator standing this week totaled a net position of -57,686 contracts in the data reported through Tuesday. This was a weekly reduction of -6,938 contracts from the previous week which had a total of -50,748 net contracts.
This week’s current strength score (the trader positioning range over the past three years, measured from 0 to 100) shows the speculators are currently Bearish with a score of 32.4 percent. The commercials are Bullish with a score of 71.7 percent and the small traders (not shown in chart) are Bearish with a score of 27.8 percent.
| BRITISH POUND Statistics | SPECULATORS | COMMERCIALS | SMALL TRADERS |
| – Percent of Open Interest Longs: | 10.0 | 78.8 | 10.2 |
| – Percent of Open Interest Shorts: | 37.8 | 44.5 | 16.7 |
| – Net Position: | -57,686 | 71,124 | -13,438 |
| – Gross Longs: | 20,824 | 163,619 | 21,240 |
| – Gross Shorts: | 78,510 | 92,495 | 34,678 |
| – Long to Short Ratio: | 0.3 to 1 | 1.8 to 1 | 0.6 to 1 |
| NET POSITION TREND: | | | |
| – Strength Index Score (3 Year Range Pct): | 32.4 | 71.7 | 27.8 |
| – Strength Index Reading (3 Year Range): | Bearish | Bullish | Bearish |
| NET POSITION MOVEMENT INDEX: | | | |
| – 6-Week Change in Strength Index: | -32.9 | 31.7 | -16.5 |
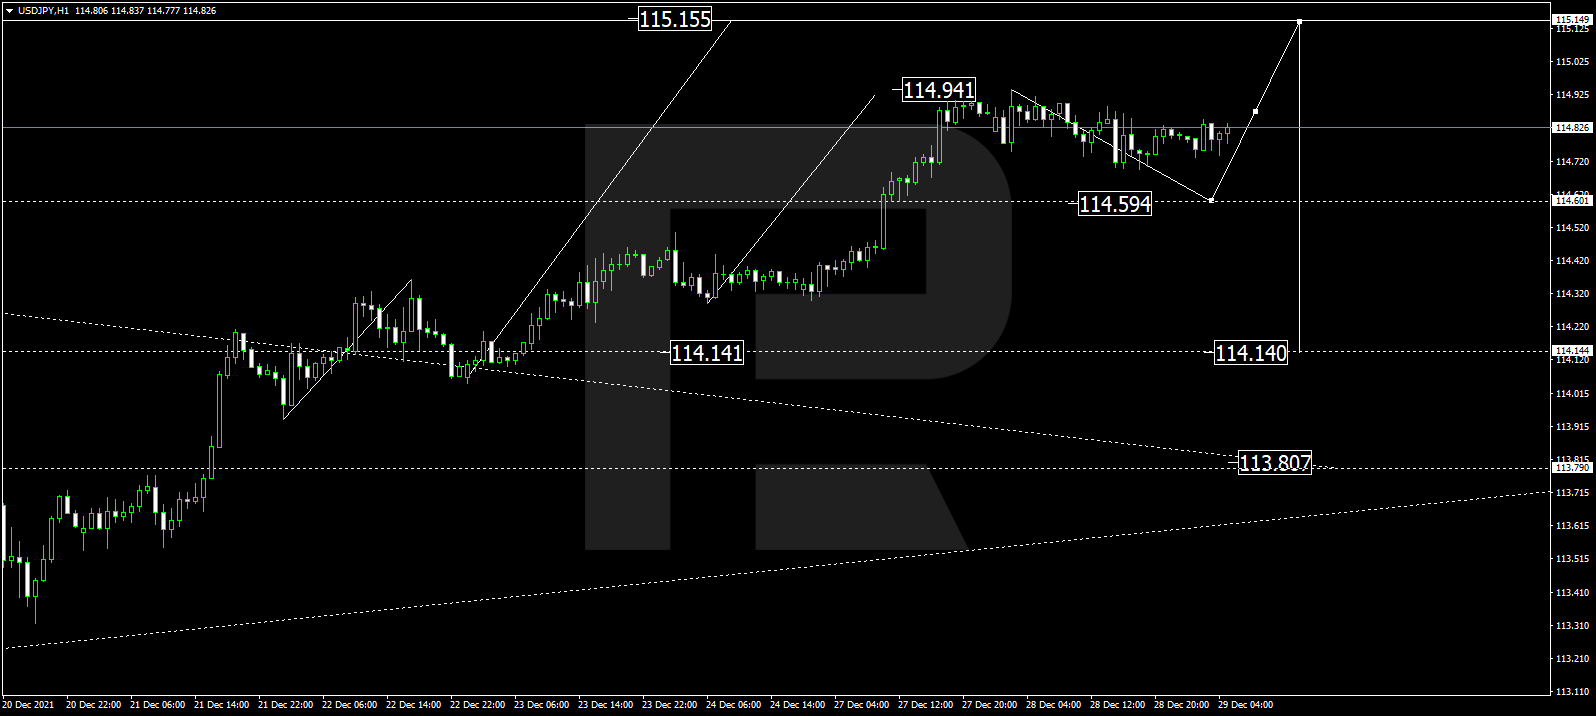
Japanese Yen Futures:
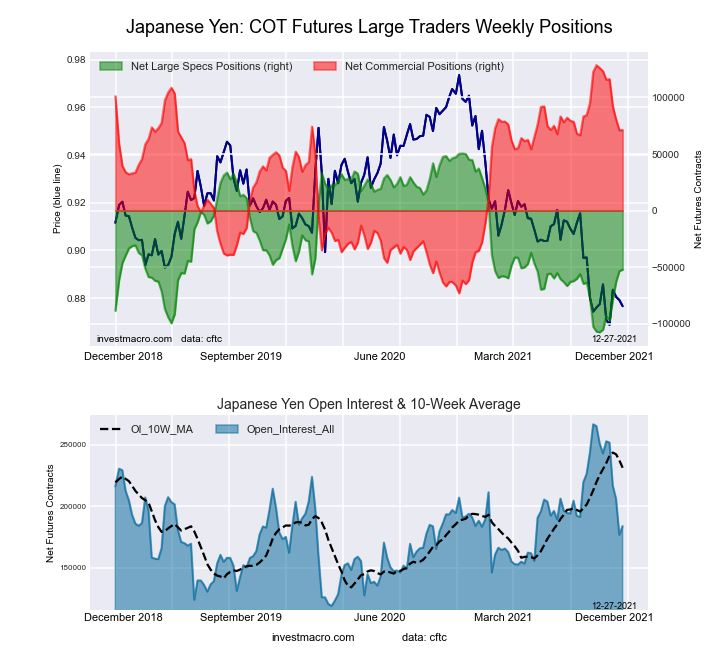 The Japanese Yen large speculator standing this week totaled a net position of -52,286 contracts in the data reported through Tuesday. This was a weekly increase of 1,237 contracts from the previous week which had a total of -53,523 net contracts.
This week’s current strength score (the trader positioning range over the past three years, measured from 0 to 100) shows the speculators are currently Bearish with a score of 35.0 percent. The commercials are Bullish with a score of 71.5 percent and the small traders (not shown in chart) are Bearish-Extreme with a score of 9.0 percent.
| JAPANESE YEN Statistics | SPECULATORS | COMMERCIALS | SMALL TRADERS |
| – Percent of Open Interest Longs: | 12.1 | 77.4 | 9.2 |
| – Percent of Open Interest Shorts: | 40.5 | 38.6 | 19.5 |
| – Net Position: | -52,286 | 71,159 | -18,873 |
| – Gross Longs: | 22,191 | 142,161 | 16,916 |
| – Gross Shorts: | 74,477 | 71,002 | 35,789 |
| – Long to Short Ratio: | 0.3 to 1 | 2.0 to 1 | 0.5 to 1 |
| NET POSITION TREND: | | | |
| – Strength Index Score (3 Year Range Pct): | 35.0 | 71.5 | 9.0 |
| – Strength Index Reading (3 Year Range): | Bearish | Bullish | Bearish-Extreme |
| NET POSITION MOVEMENT INDEX: | | | |
| – 6-Week Change in Strength Index: | 33.6 | -25.8 | -2.2 |
Swiss Franc Futures:
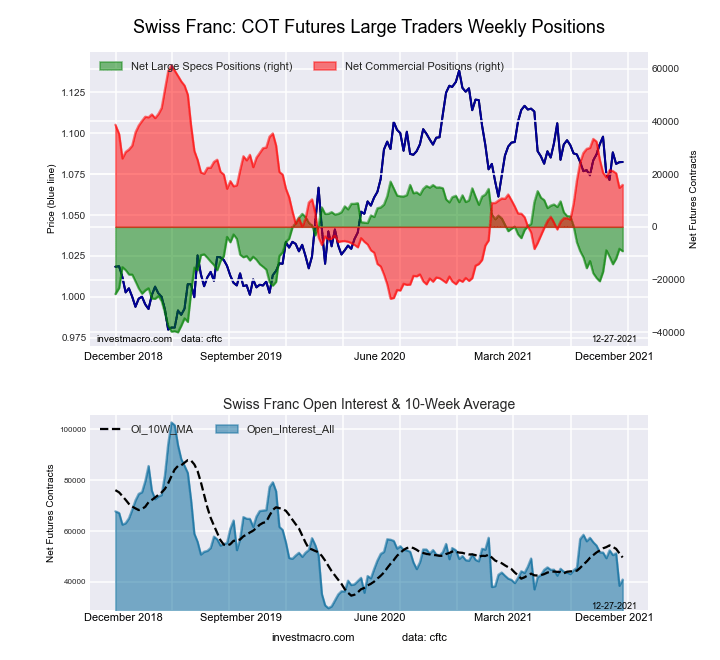 The Swiss Franc large speculator standing this week totaled a net position of -9,227 contracts in the data reported through Tuesday. This was a weekly decrease of -891 contracts from the previous week which had a total of -8,336 net contracts.
This week’s current strength score (the trader positioning range over the past three years, measured from 0 to 100) shows the speculators are currently Bullish with a score of 53.8 percent. The commercials are Bearish with a score of 48.8 percent and the small traders (not shown in chart) are Bearish with a score of 43.6 percent.
| SWISS FRANC Statistics | SPECULATORS | COMMERCIALS | SMALL TRADERS |
| – Percent of Open Interest Longs: | 6.0 | 66.8 | 27.0 |
| – Percent of Open Interest Shorts: | 28.6 | 27.9 | 43.4 |
| – Net Position: | -9,227 | 15,945 | -6,718 |
| – Gross Longs: | 2,460 | 27,344 | 11,046 |
| – Gross Shorts: | 11,687 | 11,399 | 17,764 |
| – Long to Short Ratio: | 0.2 to 1 | 2.4 to 1 | 0.6 to 1 |
| NET POSITION TREND: | | | |
| – Strength Index Score (3 Year Range Pct): | 53.8 | 48.8 | 43.6 |
| – Strength Index Reading (3 Year Range): | Bullish | Bearish | Bearish |
| NET POSITION MOVEMENT INDEX: | | | |
| – 6-Week Change in Strength Index: | 13.7 | -5.2 | -9.5 |
Canadian Dollar Futures:
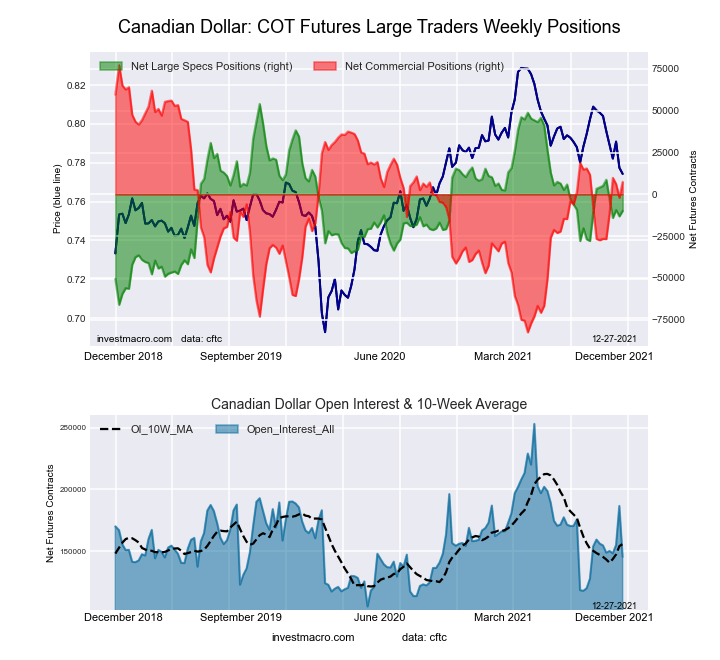 The Canadian Dollar large speculator standing this week totaled a net position of -9,877 contracts in the data reported through Tuesday. This was a weekly advance of 3,251 contracts from the previous week which had a total of -13,128 net contracts.
This week’s current strength score (the trader positioning range over the past three years, measured from 0 to 100) shows the speculators are currently Bearish with a score of 46.8 percent. The commercials are Bullish with a score of 56.3 percent and the small traders (not shown in chart) are Bearish with a score of 34.6 percent.
| CANADIAN DOLLAR Statistics | SPECULATORS | COMMERCIALS | SMALL TRADERS |
| – Percent of Open Interest Longs: | 31.6 | 45.7 | 20.2 |
| – Percent of Open Interest Shorts: | 38.3 | 40.6 | 18.6 |
| – Net Position: | -9,877 | 7,440 | 2,437 |
| – Gross Longs: | 45,925 | 66,483 | 29,450 |
| – Gross Shorts: | 55,802 | 59,043 | 27,013 |
| – Long to Short Ratio: | 0.8 to 1 | 1.1 to 1 | 1.1 to 1 |
| NET POSITION TREND: | | | |
| – Strength Index Score (3 Year Range Pct): | 46.8 | 56.3 | 34.6 |
| – Strength Index Reading (3 Year Range): | Bearish | Bullish | Bearish |
| NET POSITION MOVEMENT INDEX: | | | |
| – 6-Week Change in Strength Index: | -12.5 | 21.3 | -38.0 |
Australian Dollar Futures:
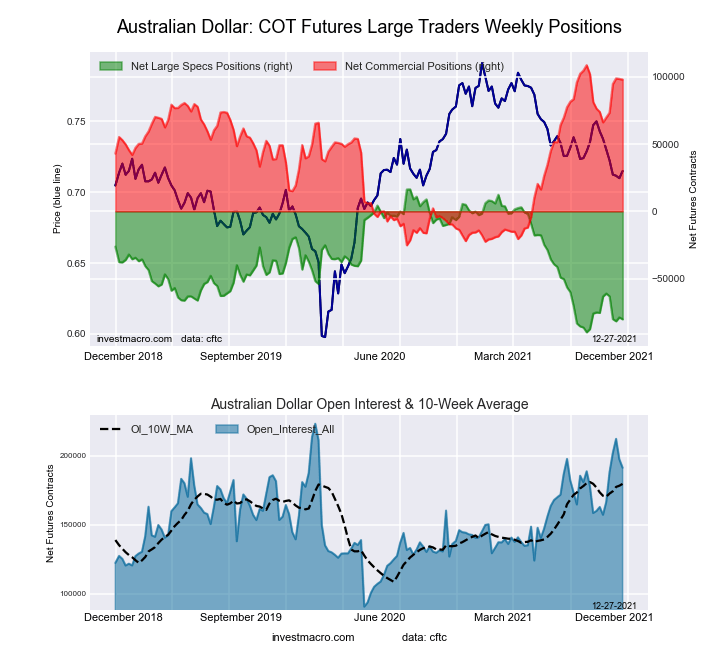 The Australian Dollar large speculator standing this week totaled a net position of -80,354 contracts in the data reported through Tuesday. This was a weekly lowering of -1,451 contracts from the previous week which had a total of -78,903 net contracts.
This week’s current strength score (the trader positioning range over the past three years, measured from 0 to 100) shows the speculators are currently Bearish-Extreme with a score of 9.1 percent. The commercials are Bullish-Extreme with a score of 92.0 percent and the small traders (not shown in chart) are Bearish-Extreme with a score of 9.3 percent.
| AUSTRALIAN DOLLAR Statistics | SPECULATORS | COMMERCIALS | SMALL TRADERS |
| – Percent of Open Interest Longs: | 12.0 | 77.8 | 8.4 |
| – Percent of Open Interest Shorts: | 54.0 | 26.6 | 17.6 |
| – Net Position: | -80,354 | 98,033 | -17,679 |
| – Gross Longs: | 22,958 | 148,859 | 16,070 |
| – Gross Shorts: | 103,312 | 50,826 | 33,749 |
| – Long to Short Ratio: | 0.2 to 1 | 2.9 to 1 | 0.5 to 1 |
| NET POSITION TREND: | | | |
| – Strength Index Score (3 Year Range Pct): | 9.1 | 92.0 | 9.3 |
| – Strength Index Reading (3 Year Range): | Bearish-Extreme | Bullish-Extreme | Bearish-Extreme |
| NET POSITION MOVEMENT INDEX: | | | |
| – 6-Week Change in Strength Index: | -15.9 | 23.8 | -36.4 |
New Zealand Dollar Futures:
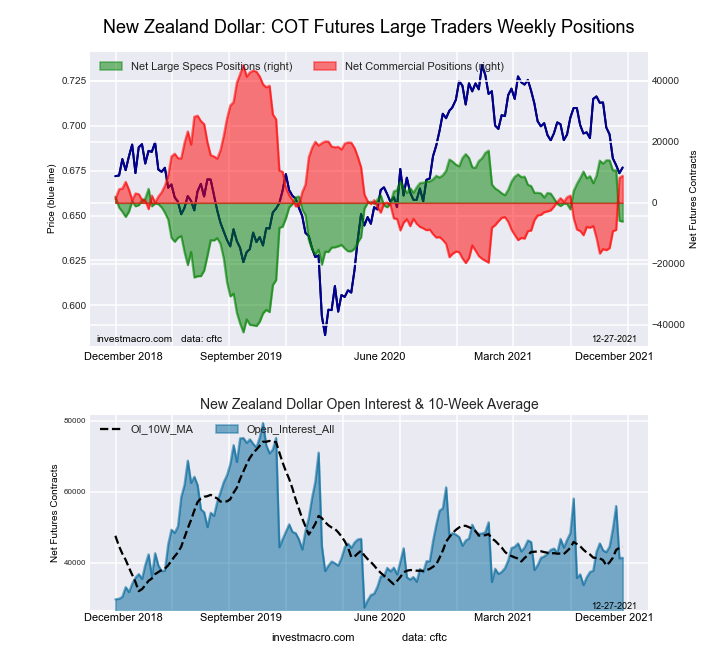 The New Zealand Dollar large speculator standing this week totaled a net position of -6,136 contracts in the data reported through Tuesday. This was a weekly lowering of -275 contracts from the previous week which had a total of -5,861 net contracts.
This week’s current strength score (the trader positioning range over the past three years, measured from 0 to 100) shows the speculators are currently Bullish with a score of 61.0 percent. The commercials are Bearish with a score of 44.1 percent and the small traders (not shown in chart) are Bearish with a score of 20.6 percent.
| NEW ZEALAND DOLLAR Statistics | SPECULATORS | COMMERCIALS | SMALL TRADERS |
| – Percent of Open Interest Longs: | 26.7 | 64.9 | 6.8 |
| – Percent of Open Interest Shorts: | 41.6 | 43.4 | 13.4 |
| – Net Position: | -6,136 | 8,866 | -2,730 |
| – Gross Longs: | 11,050 | 26,819 | 2,809 |
| – Gross Shorts: | 17,186 | 17,953 | 5,539 |
| – Long to Short Ratio: | 0.6 to 1 | 1.5 to 1 | 0.5 to 1 |
| NET POSITION TREND: | | | |
| – Strength Index Score (3 Year Range Pct): | 61.0 | 44.1 | 20.6 |
| – Strength Index Reading (3 Year Range): | Bullish | Bearish | Bearish |
| NET POSITION MOVEMENT INDEX: | | | |
| – 6-Week Change in Strength Index: | -31.9 | 37.0 | -57.1 |
Mexican Peso Futures:
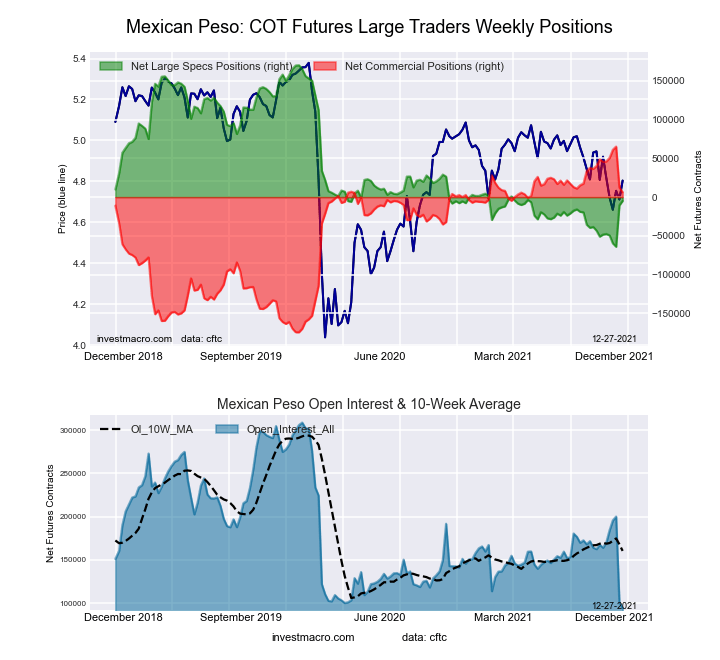 The Mexican Peso large speculator standing this week totaled a net position of -4,792 contracts in the data reported through Tuesday. This was a weekly rise of 5,881 contracts from the previous week which had a total of -10,673 net contracts.
This week’s current strength score (the trader positioning range over the past three years, measured from 0 to 100) shows the speculators are currently Bearish with a score of 25.3 percent. The commercials are Bullish with a score of 75.5 percent and the small traders (not shown in chart) are Bearish with a score of 36.3 percent.
| MEXICAN PESO Statistics | SPECULATORS | COMMERCIALS | SMALL TRADERS |
| – Percent of Open Interest Longs: | 31.8 | 63.8 | 3.8 |
| – Percent of Open Interest Shorts: | 36.9 | 57.1 | 5.5 |
| – Net Position: | -4,792 | 6,382 | -1,590 |
| – Gross Longs: | 30,021 | 60,300 | 3,563 |
| – Gross Shorts: | 34,813 | 53,918 | 5,153 |
| – Long to Short Ratio: | 0.9 to 1 | 1.1 to 1 | 0.7 to 1 |
| NET POSITION TREND: | | | |
| – Strength Index Score (3 Year Range Pct): | 25.3 | 75.5 | 36.3 |
| – Strength Index Reading (3 Year Range): | Bearish | Bullish | Bearish |
| NET POSITION MOVEMENT INDEX: | | | |
| – 6-Week Change in Strength Index: | 18.6 | -16.4 | -18.3 |
Brazilian Real Futures:
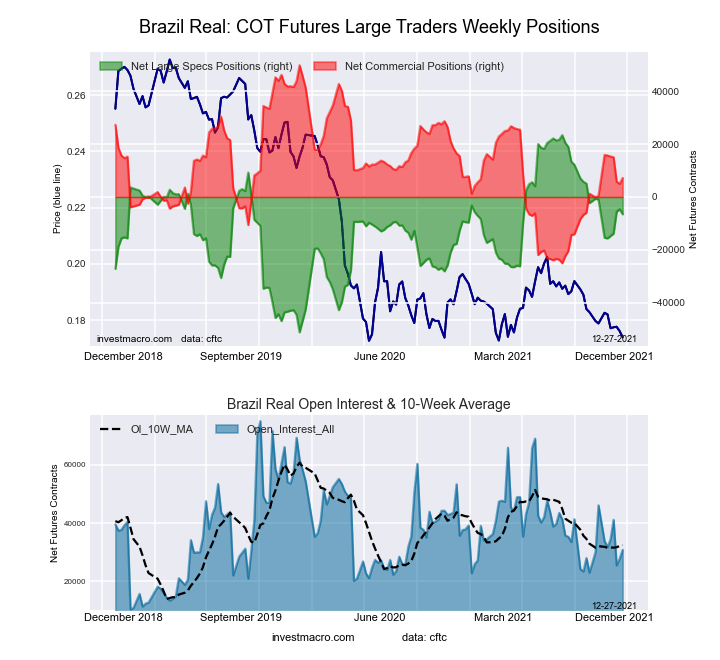 The Brazilian Real large speculator standing this week totaled a net position of -6,547 contracts in the data reported through Tuesday. This was a weekly decrease of -1,930 contracts from the previous week which had a total of -4,617 net contracts.
This week’s current strength score (the trader positioning range over the past three years, measured from 0 to 100) shows the speculators are currently Bullish with a score of 59.9 percent. The commercials are Bearish with a score of 43.1 percent and the small traders (not shown in chart) are Bullish with a score of 58.6 percent.
| BRAZIL REAL Statistics | SPECULATORS | COMMERCIALS | SMALL TRADERS |
| – Percent of Open Interest Longs: | 33.2 | 59.1 | 7.3 |
| – Percent of Open Interest Shorts: | 54.4 | 35.6 | 9.5 |
| – Net Position: | -6,547 | 7,228 | -681 |
| – Gross Longs: | 10,217 | 18,196 | 2,241 |
| – Gross Shorts: | 16,764 | 10,968 | 2,922 |
| – Long to Short Ratio: | 0.6 to 1 | 1.7 to 1 | 0.8 to 1 |
| NET POSITION TREND: | | | |
| – Strength Index Score (3 Year Range Pct): | 59.9 | 43.1 | 58.6 |
| – Strength Index Reading (3 Year Range): | Bullish | Bearish | Bullish |
| NET POSITION MOVEMENT INDEX: | | | |
| – 6-Week Change in Strength Index: | 11.9 | -11.6 | -2.3 |
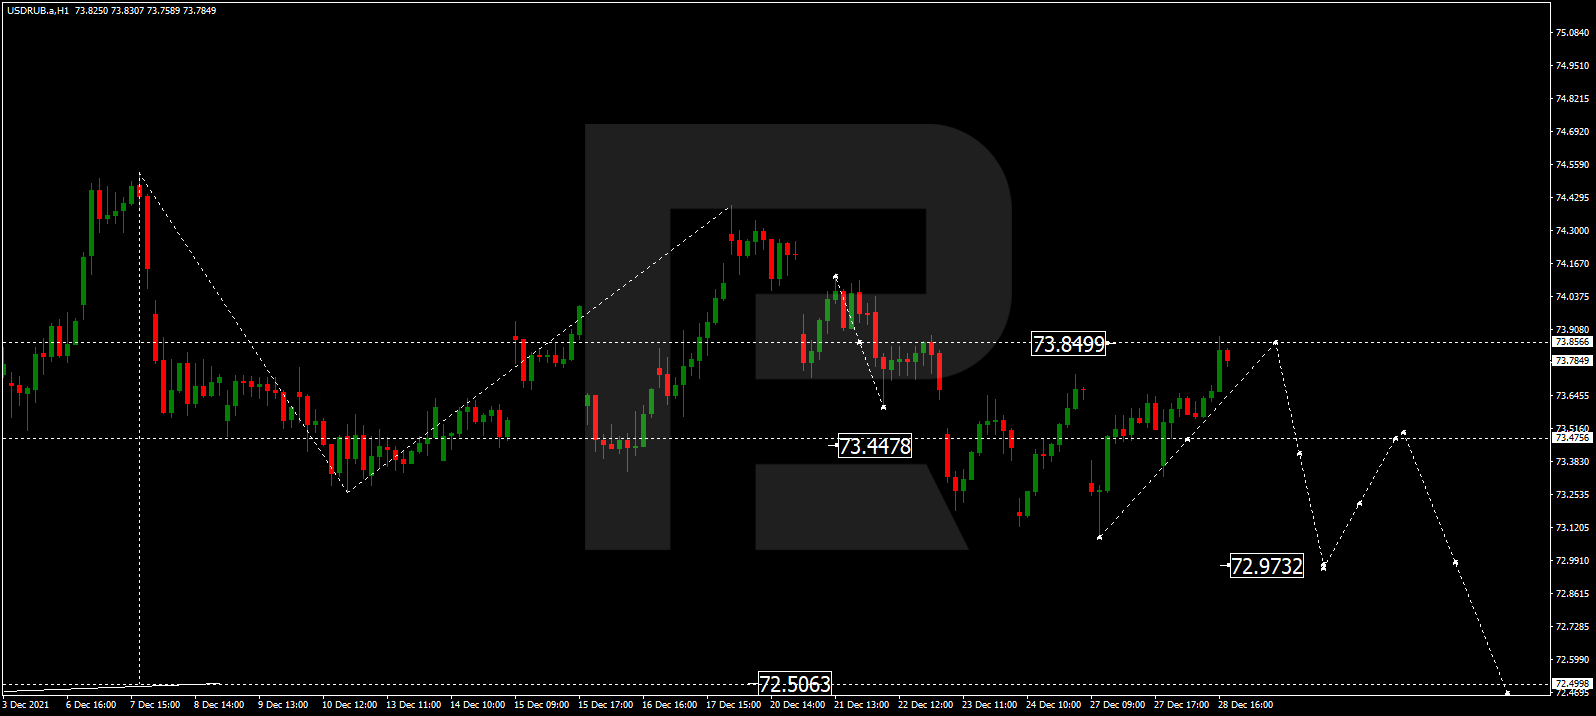
Russian Ruble Futures:
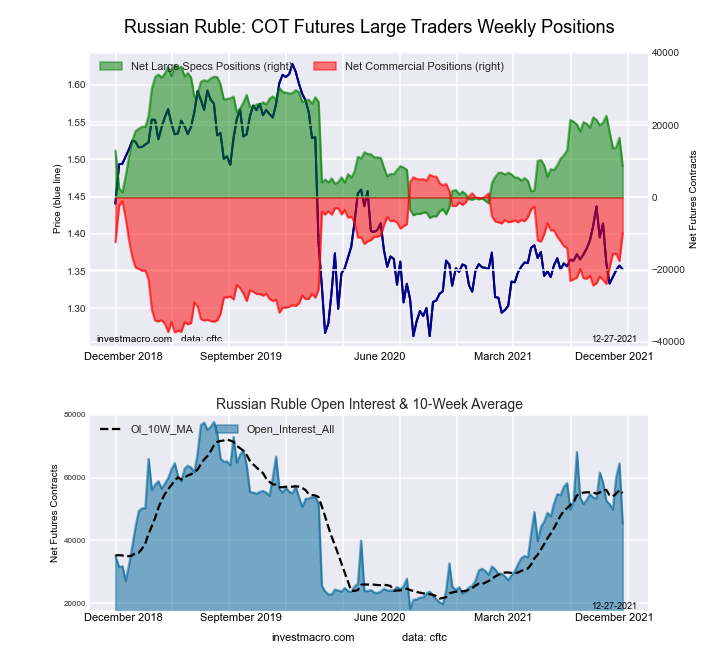 The Russian Ruble large speculator standing this week totaled a net position of 8,621 contracts in the data reported through Tuesday. This was a weekly decrease of -7,903 contracts from the previous week which had a total of 16,524 net contracts.
This week’s current strength score (the trader positioning range over the past three years, measured from 0 to 100) shows the speculators are currently Bearish with a score of 33.8 percent. The commercials are Bullish with a score of 62.9 percent and the small traders (not shown in chart) are Bullish with a score of 68.7 percent.
| RUSSIAN RUBLE Statistics | SPECULATORS | COMMERCIALS | SMALL TRADERS |
| – Percent of Open Interest Longs: | 41.7 | 53.3 | 5.0 |
| – Percent of Open Interest Shorts: | 22.7 | 75.1 | 2.2 |
| – Net Position: | 8,621 | -9,877 | 1,256 |
| – Gross Longs: | 18,942 | 24,177 | 2,253 |
| – Gross Shorts: | 10,321 | 34,054 | 997 |
| – Long to Short Ratio: | 1.8 to 1 | 0.7 to 1 | 2.3 to 1 |
| NET POSITION TREND: | | | |
| – Strength Index Score (3 Year Range Pct): | 33.8 | 62.9 | 68.7 |
| – Strength Index Reading (3 Year Range): | Bearish | Bullish | Bullish |
| NET POSITION MOVEMENT INDEX: | | | |
| – 6-Week Change in Strength Index: | -28.6 | 29.6 | -22.7 |
Bitcoin Futures:
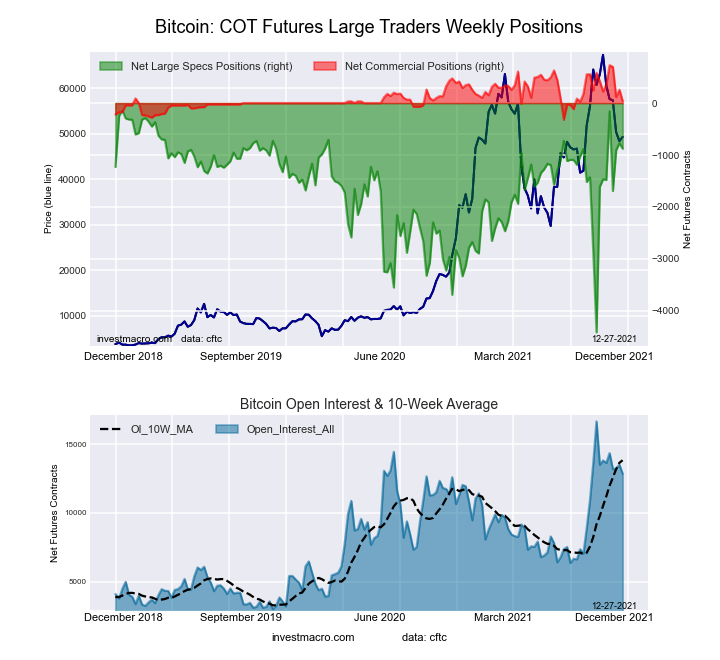 The Bitcoin large speculator standing this week totaled a net position of -878 contracts in the data reported through Tuesday. This was a weekly lowering of -106 contracts from the previous week which had a total of -772 net contracts.
This week’s current strength score (the trader positioning range over the past three years, measured from 0 to 100) shows the speculators are currently Bullish-Extreme with a score of 82.8 percent. The commercials are Bearish with a score of 34.3 percent and the small traders (not shown in chart) are Bearish with a score of 32.0 percent.
| BITCOIN Statistics | SPECULATORS | COMMERCIALS | SMALL TRADERS |
| – Percent of Open Interest Longs: | 66.9 | 3.2 | 13.7 |
| – Percent of Open Interest Shorts: | 73.7 | 2.9 | 7.1 |
| – Net Position: | -878 | 39 | 839 |
| – Gross Longs: | 8,594 | 408 | 1,755 |
| – Gross Shorts: | 9,472 | 369 | 916 |
| – Long to Short Ratio: | 0.9 to 1 | 1.1 to 1 | 1.9 to 1 |
| NET POSITION TREND: | | | |
| – Strength Index Score (3 Year Range Pct): | 82.8 | 34.3 | 32.0 |
| – Strength Index Reading (3 Year Range): | Bullish-Extreme | Bearish | Bearish |
| NET POSITION MOVEMENT INDEX: | | | |
| – 6-Week Change in Strength Index: | 13.8 | -17.5 | -9.2 |
Article By InvestMacro – Receive our weekly COT Reports by Email
*COT Report: The COT data, released weekly to the public each Friday, is updated through the most recent Tuesday (data is 3 days old) and shows a quick view of how large speculators or non-commercials (for-profit traders) were positioned in the futures markets.
The CFTC categorizes trader positions according to commercial hedgers (traders who use futures contracts for hedging as part of the business), non-commercials (large traders who speculate to realize trading profits) and nonreportable traders (usually small traders/speculators) as well as their open interest (contracts open in the market at time of reporting).See CFTC criteria here.


