By InvestMacro | COT | Data Tables | COT Leaders | Downloads | COT Newsletter
Here are the latest charts and statistics for the Commitment of Traders (COT) data published by the Commodities Futures Trading Commission (CFTC).
The latest COT data is updated through Tuesday February 1st and shows a quick view of how large traders (for-profit speculators and commercial entities) were positioned in the futures markets. All currency positions are in direct relation to the US dollar where, for example, a bet for the euro is a bet that the euro will rise versus the dollar while a bet against the euro will be a bet that the euro will decline versus the dollar.
Highlighting the COT currency data was the decline for the US Dollar Index in the currency futures contracts. Dollar Index speculators cut back on their bullish bets this week for the third time in the past four weeks after previously pushing their bullish bets to a 117-week high on January 4th. Since that high-point, bullish bets have fallen by a total of -4,507 contracts and have now dropped the overall standing to a seven-week low. Despite the recent slide, the US Dollar Index bullish bets are still near the top of their range over the past three years with a speculator strength index score of 85.4 percent which is considered extremely bullish (strength index is the current speculator standing compared to past three years, above 80 is bullish extreme, below 20 is bearish extreme). The Dollar Index price has had a volatile couple of weeks with a sharp rise to 97.22 on January 28th and then a sharp drop to 95.23 on February 3rd and closed the week at approximately 95.48.
The currencies with positive changes this week were the Japanese yen (7,633 contracts), Swiss franc (557 contracts), Canadian dollar (5,947 contracts), Russian ruble (10,207 contracts), Bitcoin (175 contracts), Australian dollar (3,444 contracts) and the Mexican peso (1,520 contracts).
The currencies with declining bets were the US Dollar Index (-2,290 contracts), Euro (-1,844 contracts), British pound sterling (-15,842 contracts), Brazil real (-737 contracts) and the New Zealand dollar (-925 contracts).
| Feb-01-2022 | OI | OI-Index | Spec-Net | Spec-Index | Com-Net | COM-Index | Smalls-Net | Smalls-Index |
|---|
| USD Index | 56,477 | 81 | 34,571 | 85 | -41,884 | 5 | 7,313 | 97 |
| EUR | 685,431 | 78 | 29,716 | 44 | -57,467 | 59 | 27,751 | 20 |
| GBP | 184,007 | 28 | -23,605 | 57 | 28,891 | 47 | -5,286 | 45 |
| JPY | 194,435 | 51 | -60,640 | 30 | 79,353 | 76 | -18,713 | 9 |
| CHF | 41,054 | 16 | -8,239 | 56 | 16,541 | 49 | -8,302 | 39 |
| CAD | 145,082 | 27 | 18,264 | 65 | -25,622 | 39 | 7,358 | 44 |
| AUD | 196,913 | 80 | -79,829 | 11 | 96,098 | 91 | -16,269 | 13 |
| NZD | 58,467 | 60 | -11,698 | 52 | 14,019 | 52 | -2,321 | 25 |
| MXN | 141,352 | 22 | 730 | 28 | -3,848 | 71 | 3,118 | 56 |
| RUB | 46,358 | 47 | 14,151 | 47 | -14,451 | 52 | 300 | 43 |
| BRL | 76,175 | 100 | -13,353 | 51 | 10,467 | 47 | 2,886 | 100 |
| Bitcoin | 9,948 | 51 | 141 | 100 | -491 | 0 | 350 | 21 |
US Dollar Index Futures:
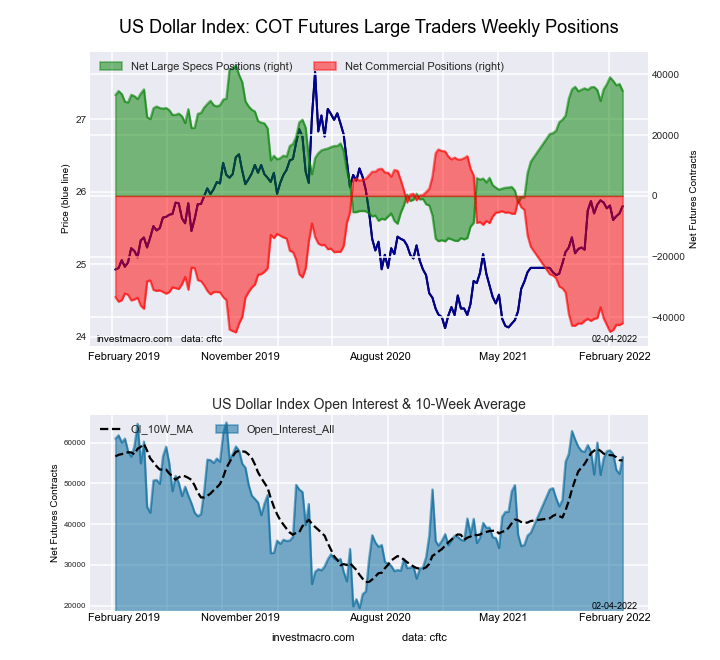 The US Dollar Index large speculator standing this week resulted in a net position of 34,571 contracts in the data reported through Tuesday. This was a weekly decrease of -2,290 contracts from the previous week which had a total of 36,861 net contracts.
This week’s current strength score (the trader positioning range over the past three years, measured from 0 to 100) shows the speculators are currently Bullish-Extreme with a score of 85.4 percent. The commercials are Bearish-Extreme with a score of 5.0 percent and the small traders (not shown in chart) are Bullish-Extreme with a score of 96.5 percent.
| US DOLLAR INDEX Statistics | SPECULATORS | COMMERCIALS | SMALL TRADERS |
| – Percent of Open Interest Longs: | 77.7 | 3.8 | 16.3 |
| – Percent of Open Interest Shorts: | 16.5 | 78.0 | 3.3 |
| – Net Position: | 34,571 | -41,884 | 7,313 |
| – Gross Longs: | 43,897 | 2,141 | 9,203 |
| – Gross Shorts: | 9,326 | 44,025 | 1,890 |
| – Long to Short Ratio: | 4.7 to 1 | 0.0 to 1 | 4.9 to 1 |
| NET POSITION TREND: | | | |
| – Strength Index Score (3 Year Range Pct): | 85.4 | 5.0 | 96.5 |
| – Strength Index Reading (3 Year Range): | Bullish-Extreme | Bearish-Extreme | Bullish-Extreme |
| NET POSITION MOVEMENT INDEX: | | | |
| – 6-Week Change in Strength Index: | -0.9 | -2.6 | 22.9 |
Euro Currency Futures:
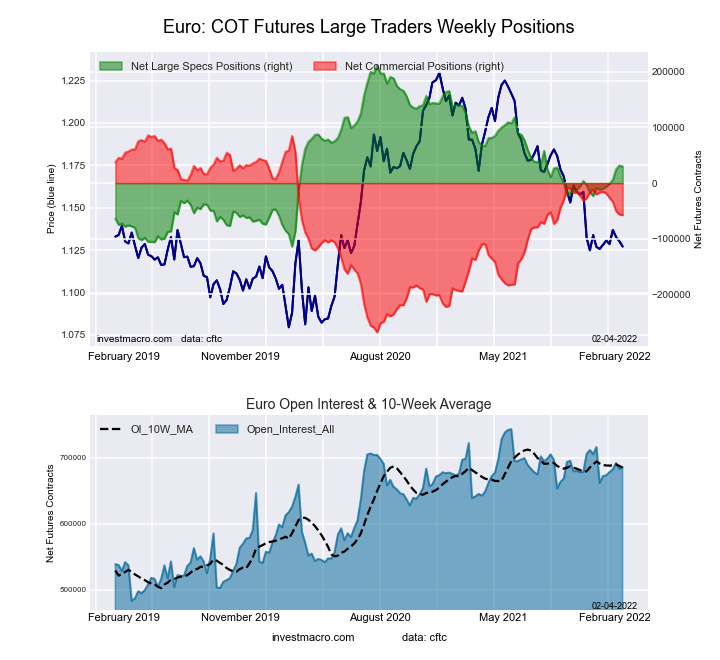 The Euro Currency large speculator standing this week resulted in a net position of 29,716 contracts in the data reported through Tuesday. This was a weekly fall of -1,844 contracts from the previous week which had a total of 31,560 net contracts.
This week’s current strength score (the trader positioning range over the past three years, measured from 0 to 100) shows the speculators are currently Bearish with a score of 44.1 percent. The commercials are Bullish with a score of 59.5 percent and the small traders (not shown in chart) are Bearish with a score of 20.4 percent.
| EURO Currency Statistics | SPECULATORS | COMMERCIALS | SMALL TRADERS |
| – Percent of Open Interest Longs: | 31.2 | 55.0 | 12.2 |
| – Percent of Open Interest Shorts: | 26.8 | 63.4 | 8.2 |
| – Net Position: | 29,716 | -57,467 | 27,751 |
| – Gross Longs: | 213,563 | 376,805 | 83,675 |
| – Gross Shorts: | 183,847 | 434,272 | 55,924 |
| – Long to Short Ratio: | 1.2 to 1 | 0.9 to 1 | 1.5 to 1 |
| NET POSITION TREND: | | | |
| – Strength Index Score (3 Year Range Pct): | 44.1 | 59.5 | 20.4 |
| – Strength Index Reading (3 Year Range): | Bearish | Bullish | Bearish |
| NET POSITION MOVEMENT INDEX: | | | |
| – 6-Week Change in Strength Index: | 12.2 | -11.8 | 3.2 |
British Pound Sterling Futures:
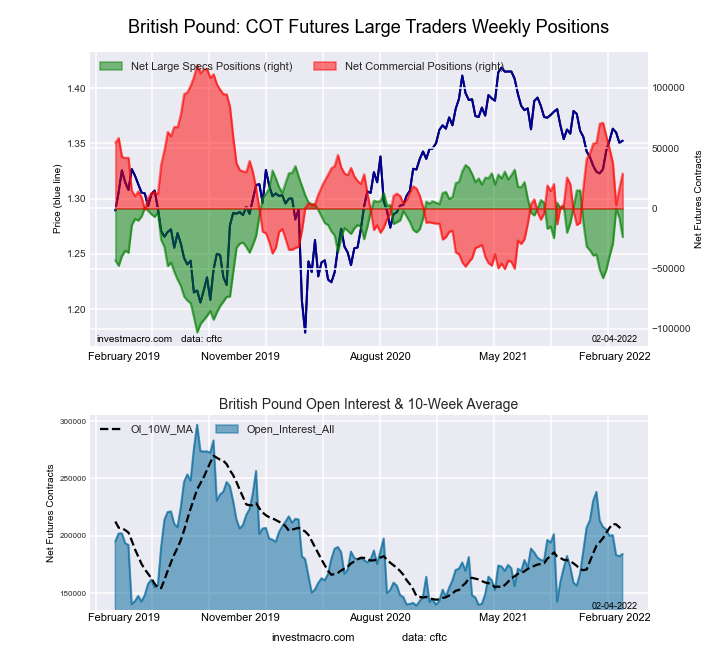 The British Pound Sterling large speculator standing this week resulted in a net position of -23,605 contracts in the data reported through Tuesday. This was a weekly decline of -15,842 contracts from the previous week which had a total of -7,763 net contracts.
This week’s current strength score (the trader positioning range over the past three years, measured from 0 to 100) shows the speculators are currently Bullish with a score of 57.0 percent. The commercials are Bearish with a score of 46.8 percent and the small traders (not shown in chart) are Bearish with a score of 44.7 percent.
| BRITISH POUND Statistics | SPECULATORS | COMMERCIALS | SMALL TRADERS |
| – Percent of Open Interest Longs: | 16.1 | 68.8 | 13.5 |
| – Percent of Open Interest Shorts: | 28.9 | 53.1 | 16.4 |
| – Net Position: | -23,605 | 28,891 | -5,286 |
| – Gross Longs: | 29,597 | 126,536 | 24,845 |
| – Gross Shorts: | 53,202 | 97,645 | 30,131 |
| – Long to Short Ratio: | 0.6 to 1 | 1.3 to 1 | 0.8 to 1 |
| NET POSITION TREND: | | | |
| – Strength Index Score (3 Year Range Pct): | 57.0 | 46.8 | 44.7 |
| – Strength Index Reading (3 Year Range): | Bullish | Bearish | Bearish |
| NET POSITION MOVEMENT INDEX: | | | |
| – 6-Week Change in Strength Index: | 24.6 | -25.0 | 16.9 |
Japanese Yen Futures:
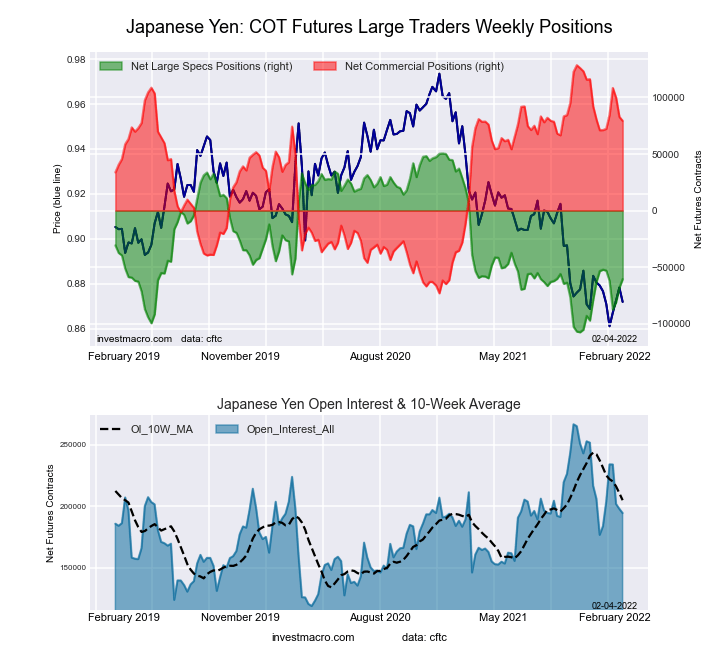 The Japanese Yen large speculator standing this week resulted in a net position of -60,640 contracts in the data reported through Tuesday. This was a weekly rise of 7,633 contracts from the previous week which had a total of -68,273 net contracts.
This week’s current strength score (the trader positioning range over the past three years, measured from 0 to 100) shows the speculators are currently Bearish with a score of 29.7 percent. The commercials are Bullish with a score of 75.6 percent and the small traders (not shown in chart) are Bearish-Extreme with a score of 9.3 percent.
| JAPANESE YEN Statistics | SPECULATORS | COMMERCIALS | SMALL TRADERS |
| – Percent of Open Interest Longs: | 7.5 | 82.5 | 8.2 |
| – Percent of Open Interest Shorts: | 38.7 | 41.7 | 17.8 |
| – Net Position: | -60,640 | 79,353 | -18,713 |
| – Gross Longs: | 14,510 | 160,358 | 15,958 |
| – Gross Shorts: | 75,150 | 81,005 | 34,671 |
| – Long to Short Ratio: | 0.2 to 1 | 2.0 to 1 | 0.5 to 1 |
| NET POSITION TREND: | | | |
| – Strength Index Score (3 Year Range Pct): | 29.7 | 75.6 | 9.3 |
| – Strength Index Reading (3 Year Range): | Bearish | Bullish | Bearish-Extreme |
| NET POSITION MOVEMENT INDEX: | | | |
| – 6-Week Change in Strength Index: | -5.3 | 4.1 | 0.3 |
Swiss Franc Futures:
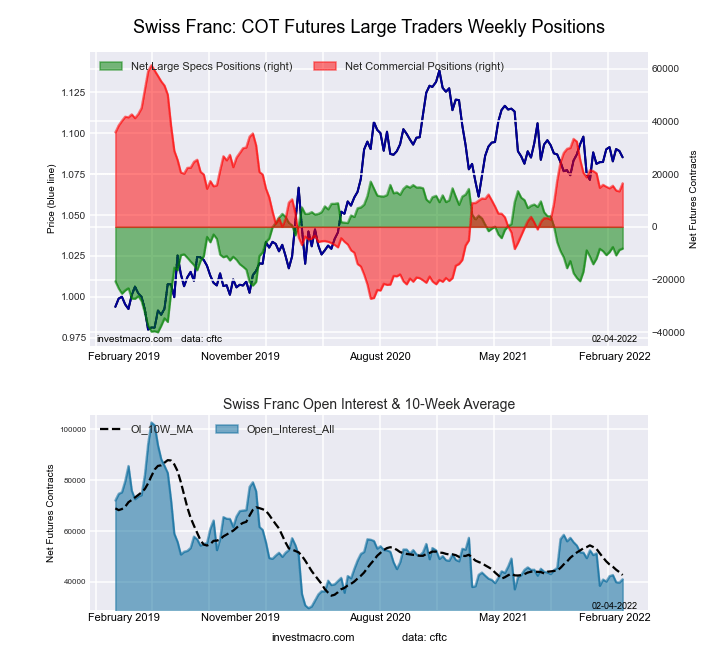 The Swiss Franc large speculator standing this week resulted in a net position of -8,239 contracts in the data reported through Tuesday. This was a weekly boost of 557 contracts from the previous week which had a total of -8,796 net contracts.
This week’s current strength score (the trader positioning range over the past three years, measured from 0 to 100) shows the speculators are currently Bullish with a score of 55.6 percent. The commercials are Bearish with a score of 49.4 percent and the small traders (not shown in chart) are Bearish with a score of 38.9 percent.
| SWISS FRANC Statistics | SPECULATORS | COMMERCIALS | SMALL TRADERS |
| – Percent of Open Interest Longs: | 1.7 | 73.5 | 24.6 |
| – Percent of Open Interest Shorts: | 21.8 | 33.2 | 44.8 |
| – Net Position: | -8,239 | 16,541 | -8,302 |
| – Gross Longs: | 698 | 30,161 | 10,103 |
| – Gross Shorts: | 8,937 | 13,620 | 18,405 |
| – Long to Short Ratio: | 0.1 to 1 | 2.2 to 1 | 0.5 to 1 |
| NET POSITION TREND: | | | |
| – Strength Index Score (3 Year Range Pct): | 55.6 | 49.4 | 38.9 |
| – Strength Index Reading (3 Year Range): | Bullish | Bearish | Bearish |
| NET POSITION MOVEMENT INDEX: | | | |
| – 6-Week Change in Strength Index: | 1.7 | 0.7 | -4.6 |
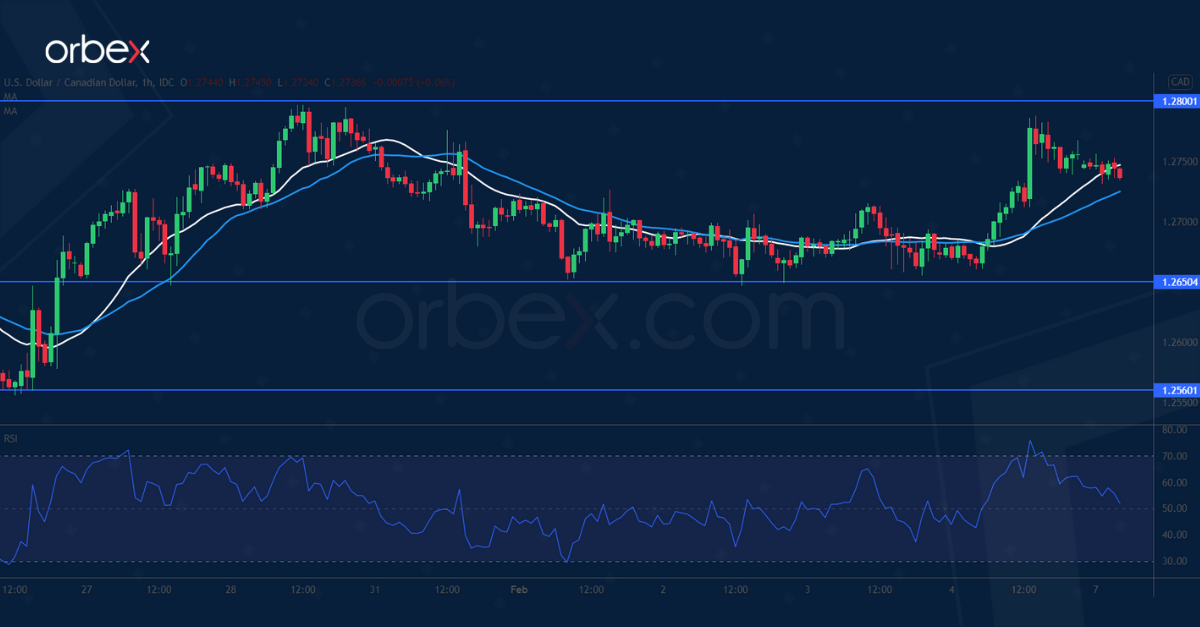
Canadian Dollar Futures:
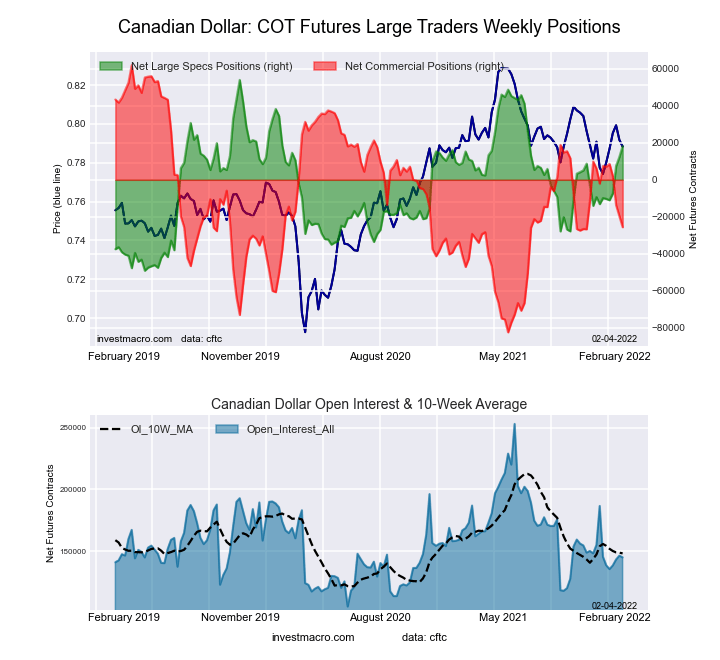 The Canadian Dollar large speculator standing this week resulted in a net position of 18,264 contracts in the data reported through Tuesday. This was a weekly gain of 5,947 contracts from the previous week which had a total of 12,317 net contracts.
This week’s current strength score (the trader positioning range over the past three years, measured from 0 to 100) shows the speculators are currently Bullish with a score of 65.4 percent. The commercials are Bearish with a score of 39.4 percent and the small traders (not shown in chart) are Bearish with a score of 44.4 percent.
| CANADIAN DOLLAR Statistics | SPECULATORS | COMMERCIALS | SMALL TRADERS |
| – Percent of Open Interest Longs: | 36.1 | 39.6 | 21.6 |
| – Percent of Open Interest Shorts: | 23.5 | 57.3 | 16.5 |
| – Net Position: | 18,264 | -25,622 | 7,358 |
| – Gross Longs: | 52,386 | 57,524 | 31,356 |
| – Gross Shorts: | 34,122 | 83,146 | 23,998 |
| – Long to Short Ratio: | 1.5 to 1 | 0.7 to 1 | 1.3 to 1 |
| NET POSITION TREND: | | | |
| – Strength Index Score (3 Year Range Pct): | 65.4 | 39.4 | 44.4 |
| – Strength Index Reading (3 Year Range): | Bullish | Bearish | Bearish |
| NET POSITION MOVEMENT INDEX: | | | |
| – 6-Week Change in Strength Index: | 27.3 | -22.9 | 9.8 |
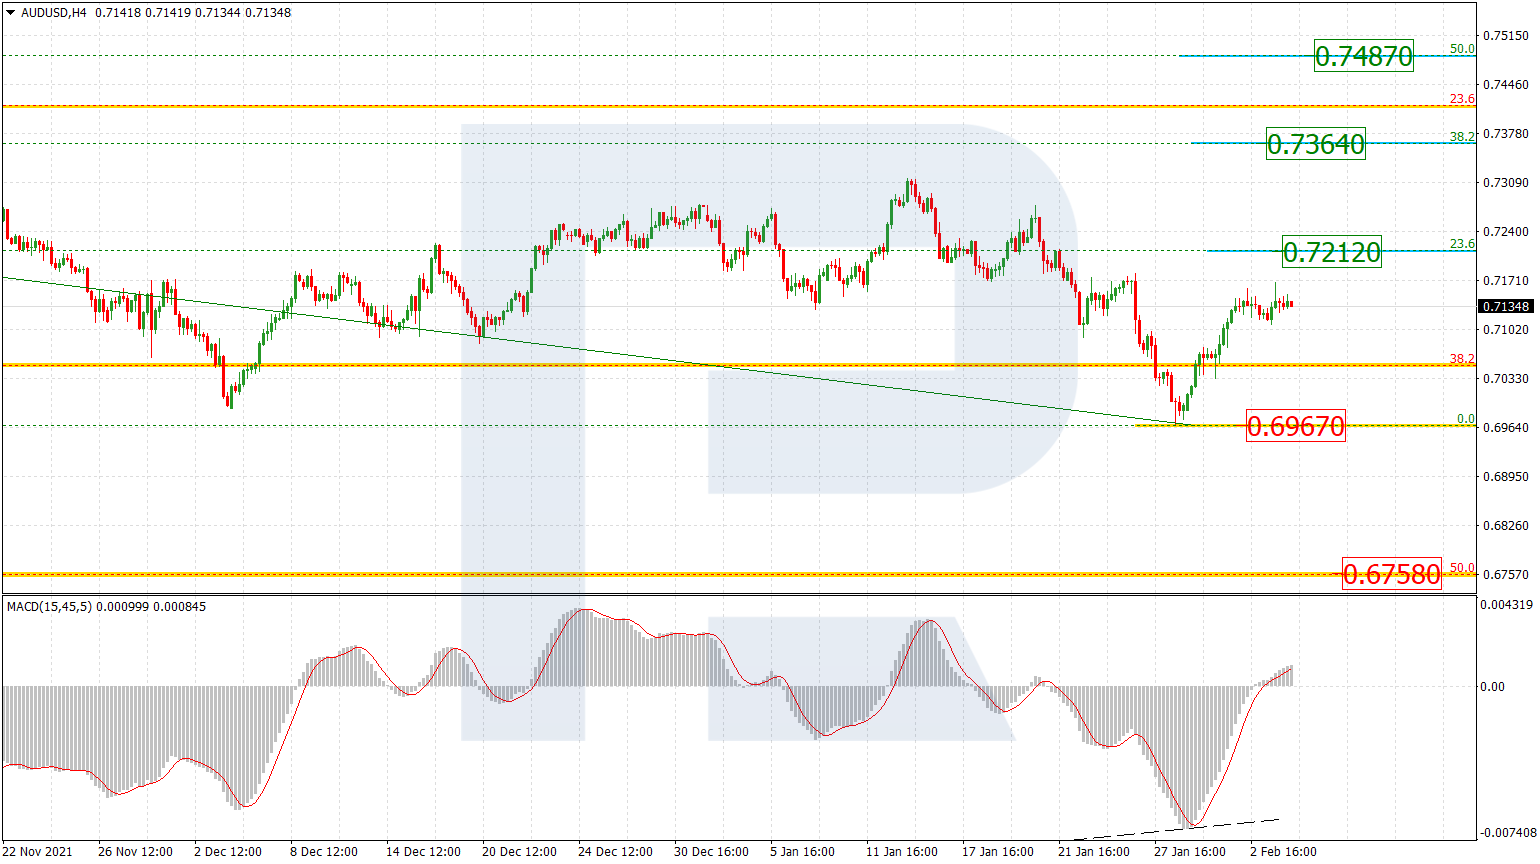
Australian Dollar Futures:
 The Australian Dollar large speculator standing this week resulted in a net position of -79,829 contracts in the data reported through Tuesday. This was a weekly advance of 3,444 contracts from the previous week which had a total of -83,273 net contracts.
This week’s current strength score (the trader positioning range over the past three years, measured from 0 to 100) shows the speculators are currently Bearish-Extreme with a score of 10.8 percent. The commercials are Bullish-Extreme with a score of 90.6 percent and the small traders (not shown in chart) are Bearish-Extreme with a score of 12.8 percent.
| AUSTRALIAN DOLLAR Statistics | SPECULATORS | COMMERCIALS | SMALL TRADERS |
| – Percent of Open Interest Longs: | 9.6 | 78.8 | 9.2 |
| – Percent of Open Interest Shorts: | 50.1 | 30.0 | 17.5 |
| – Net Position: | -79,829 | 96,098 | -16,269 |
| – Gross Longs: | 18,835 | 155,124 | 18,128 |
| – Gross Shorts: | 98,664 | 59,026 | 34,397 |
| – Long to Short Ratio: | 0.2 to 1 | 2.6 to 1 | 0.5 to 1 |
| NET POSITION TREND: | | | |
| – Strength Index Score (3 Year Range Pct): | 10.8 | 90.6 | 12.8 |
| – Strength Index Reading (3 Year Range): | Bearish-Extreme | Bullish-Extreme | Bearish-Extreme |
| NET POSITION MOVEMENT INDEX: | | | |
| – 6-Week Change in Strength Index: | 0.5 | -1.4 | 3.4 |
New Zealand Dollar Futures:
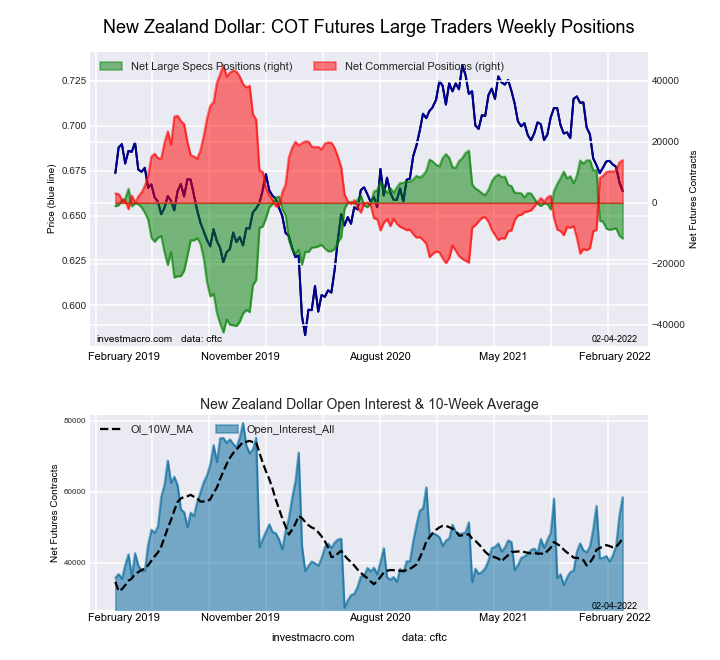 The New Zealand Dollar large speculator standing this week resulted in a net position of -11,698 contracts in the data reported through Tuesday. This was a weekly decrease of -925 contracts from the previous week which had a total of -10,773 net contracts.
This week’s current strength score (the trader positioning range over the past three years, measured from 0 to 100) shows the speculators are currently Bullish with a score of 51.6 percent. The commercials are Bullish with a score of 52.0 percent and the small traders (not shown in chart) are Bearish with a score of 25.3 percent.
| NEW ZEALAND DOLLAR Statistics | SPECULATORS | COMMERCIALS | SMALL TRADERS |
| – Percent of Open Interest Longs: | 32.8 | 61.0 | 4.8 |
| – Percent of Open Interest Shorts: | 52.9 | 37.0 | 8.7 |
| – Net Position: | -11,698 | 14,019 | -2,321 |
| – Gross Longs: | 19,205 | 35,644 | 2,783 |
| – Gross Shorts: | 30,903 | 21,625 | 5,104 |
| – Long to Short Ratio: | 0.6 to 1 | 1.6 to 1 | 0.5 to 1 |
| NET POSITION TREND: | | | |
| – Strength Index Score (3 Year Range Pct): | 51.6 | 52.0 | 25.3 |
| – Strength Index Reading (3 Year Range): | Bullish | Bullish | Bearish |
| NET POSITION MOVEMENT INDEX: | | | |
| – 6-Week Change in Strength Index: | -9.3 | 7.9 | 4.7 |
Mexican Peso Futures:
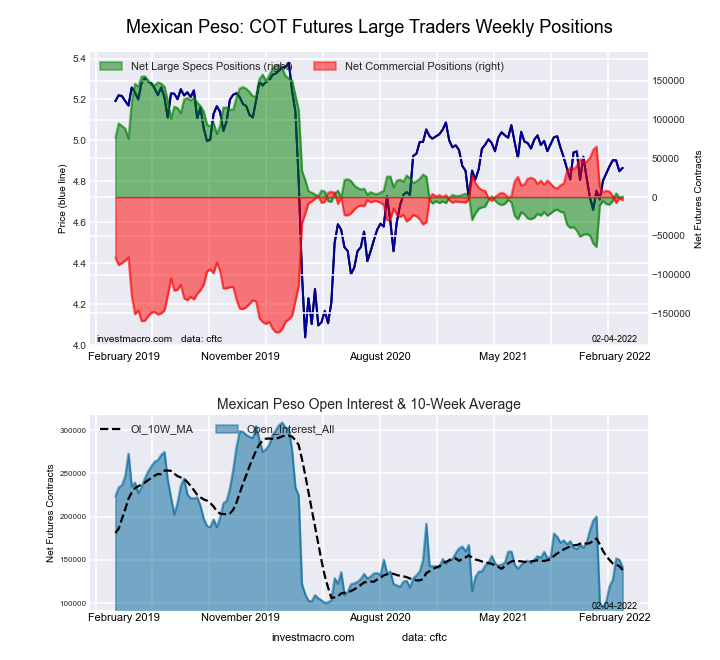 The Mexican Peso large speculator standing this week resulted in a net position of 730 contracts in the data reported through Tuesday. This was a weekly increase of 1,520 contracts from the previous week which had a total of -790 net contracts.
This week’s current strength score (the trader positioning range over the past three years, measured from 0 to 100) shows the speculators are currently Bearish with a score of 27.7 percent. The commercials are Bullish with a score of 71.2 percent and the small traders (not shown in chart) are Bullish with a score of 56.2 percent.
| MEXICAN PESO Statistics | SPECULATORS | COMMERCIALS | SMALL TRADERS |
| – Percent of Open Interest Longs: | 38.0 | 57.2 | 4.5 |
| – Percent of Open Interest Shorts: | 37.5 | 59.9 | 2.3 |
| – Net Position: | 730 | -3,848 | 3,118 |
| – Gross Longs: | 53,767 | 80,885 | 6,378 |
| – Gross Shorts: | 53,037 | 84,733 | 3,260 |
| – Long to Short Ratio: | 1.0 to 1 | 1.0 to 1 | 2.0 to 1 |
| NET POSITION TREND: | | | |
| – Strength Index Score (3 Year Range Pct): | 27.7 | 71.2 | 56.2 |
| – Strength Index Reading (3 Year Range): | Bearish | Bullish | Bullish |
| NET POSITION MOVEMENT INDEX: | | | |
| – 6-Week Change in Strength Index: | 2.4 | -4.3 | 20.0 |
Brazilian Real Futures:
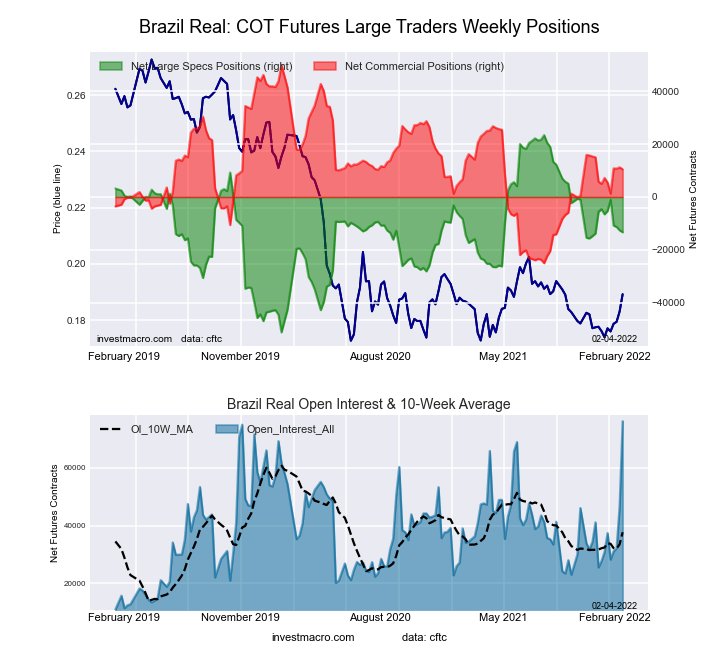 The Brazilian Real large speculator standing this week resulted in a net position of -13,353 contracts in the data reported through Tuesday. This was a weekly decline of -737 contracts from the previous week which had a total of -12,616 net contracts.
This week’s current strength score (the trader positioning range over the past three years, measured from 0 to 100) shows the speculators are currently Bullish with a score of 50.8 percent. The commercials are Bearish with a score of 47.4 percent and the small traders (not shown in chart) are Bullish-Extreme with a score of 100.0 percent.
| BRAZIL REAL Statistics | SPECULATORS | COMMERCIALS | SMALL TRADERS |
| – Percent of Open Interest Longs: | 47.6 | 46.3 | 6.0 |
| – Percent of Open Interest Shorts: | 65.2 | 32.6 | 2.2 |
| – Net Position: | -13,353 | 10,467 | 2,886 |
| – Gross Longs: | 36,293 | 35,263 | 4,562 |
| – Gross Shorts: | 49,646 | 24,796 | 1,676 |
| – Long to Short Ratio: | 0.7 to 1 | 1.4 to 1 | 2.7 to 1 |
| NET POSITION TREND: | | | |
| – Strength Index Score (3 Year Range Pct): | 50.8 | 47.4 | 100.0 |
| – Strength Index Reading (3 Year Range): | Bullish | Bearish | Bullish-Extreme |
| NET POSITION MOVEMENT INDEX: | | | |
| – 6-Week Change in Strength Index: | -9.1 | 4.3 | 42.4 |
Russian Ruble Futures:
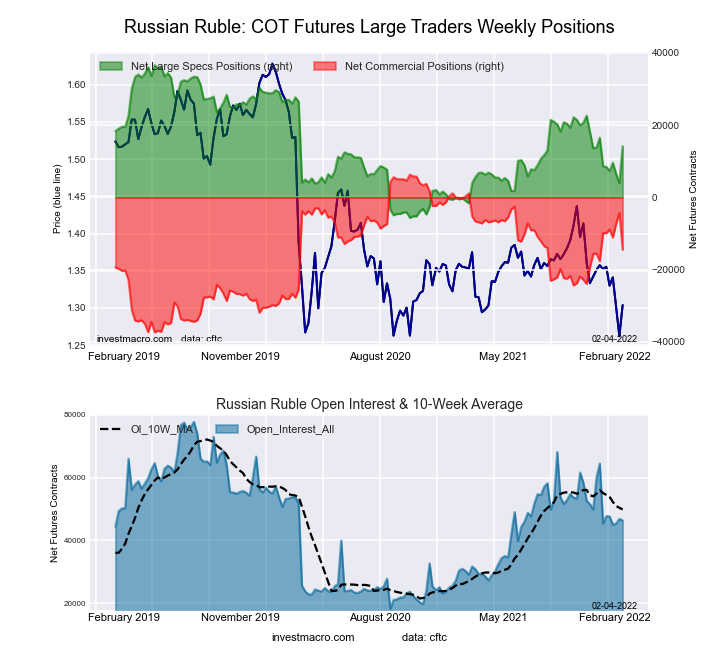 The Russian Ruble large speculator standing this week resulted in a net position of 14,151 contracts in the data reported through Tuesday. This was a weekly lift of 10,207 contracts from the previous week which had a total of 3,944 net contracts.
This week’s current strength score (the trader positioning range over the past three years, measured from 0 to 100) shows the speculators are currently Bearish with a score of 46.9 percent. The commercials are Bullish with a score of 52.4 percent and the small traders (not shown in chart) are Bearish with a score of 42.7 percent.
| RUSSIAN RUBLE Statistics | SPECULATORS | COMMERCIALS | SMALL TRADERS |
| – Percent of Open Interest Longs: | 54.0 | 41.5 | 4.4 |
| – Percent of Open Interest Shorts: | 23.5 | 72.7 | 3.7 |
| – Net Position: | 14,151 | -14,451 | 300 |
| – Gross Longs: | 25,048 | 19,255 | 2,024 |
| – Gross Shorts: | 10,897 | 33,706 | 1,724 |
| – Long to Short Ratio: | 2.3 to 1 | 0.6 to 1 | 1.2 to 1 |
| NET POSITION TREND: | | | |
| – Strength Index Score (3 Year Range Pct): | 46.9 | 52.4 | 42.7 |
| – Strength Index Reading (3 Year Range): | Bearish | Bullish | Bearish |
| NET POSITION MOVEMENT INDEX: | | | |
| – 6-Week Change in Strength Index: | 13.1 | -10.5 | -26.0 |
Bitcoin Futures:
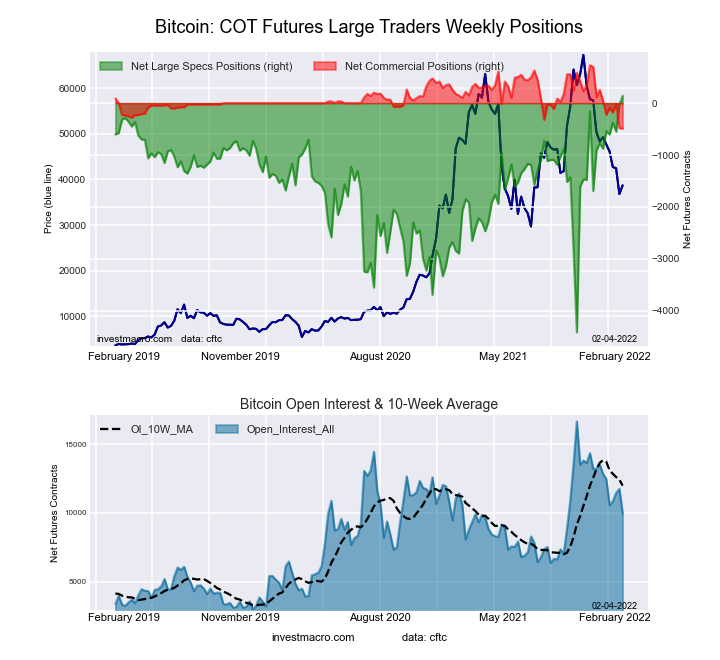 The Bitcoin large speculator standing this week resulted in a net position of 141 contracts in the data reported through Tuesday. This was a weekly advance of 175 contracts from the previous week which had a total of -34 net contracts.
This week’s current strength score (the trader positioning range over the past three years, measured from 0 to 100) shows the speculators are currently Bullish-Extreme with a score of 100.0 percent. The commercials are Bearish-Extreme with a score of 0.0 percent and the small traders (not shown in chart) are Bearish with a score of 20.9 percent.
| BITCOIN Statistics | SPECULATORS | COMMERCIALS | SMALL TRADERS |
| – Percent of Open Interest Longs: | 80.3 | 3.1 | 12.4 |
| – Percent of Open Interest Shorts: | 78.8 | 8.0 | 8.9 |
| – Net Position: | 141 | -491 | 350 |
| – Gross Longs: | 7,984 | 304 | 1,232 |
| – Gross Shorts: | 7,843 | 795 | 882 |
| – Long to Short Ratio: | 1.0 to 1 | 0.4 to 1 | 1.4 to 1 |
| NET POSITION TREND: | | | |
| – Strength Index Score (3 Year Range Pct): | 100.0 | 0.0 | 20.9 |
| – Strength Index Reading (3 Year Range): | Bullish-Extreme | Bearish-Extreme | Bearish |
| NET POSITION MOVEMENT INDEX: | | | |
| – 6-Week Change in Strength Index: | 22.4 | -43.4 | -11.1 |
Article By InvestMacro – Receive our weekly COT Reports by Email
*COT Report: The COT data, released weekly to the public each Friday, is updated through the most recent Tuesday (data is 3 days old) and shows a quick view of how large speculators or non-commercials (for-profit traders) were positioned in the futures markets.
The CFTC categorizes trader positions according to commercial hedgers (traders who use futures contracts for hedging as part of the business), non-commercials (large traders who speculate to realize trading profits) and nonreportable traders (usually small traders/speculators) as well as their open interest (contracts open in the market at time of reporting).See CFTC criteria here.


