Archive for Forex and Currency News – Page 172

Mid-Week Technical Outlook: FX Movers & Shakers

Lukman Otunuga

By Lukman Otunuga Senior Research Analyst, ForexTime

Market sentiment brightened on Wednesday with global equities rallying for a second day as investors cheered strong earnings and signs of easing tensions in Ukraine.

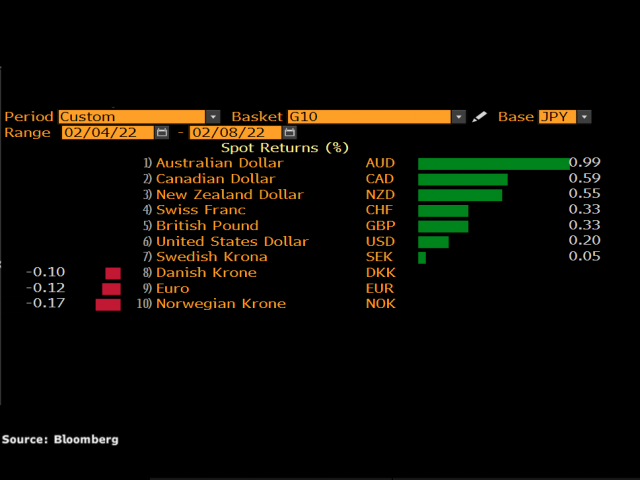
We already knew this would be an eventful week for financial markets thanks to the growing caution and anticipation ahead of the US inflation report. So far markets have certainly not disappointed, with global stocks and currencies bursting with life. The S&P500 is up over 1.7% this week while king dollar and Yen have depreciated against most G10 currencies. Interestingly, the Australian dollar is looking pretty, the same can be said for the New Zealand Dollar.

With less than 24 hours left until the US CPI report is released, here are some technical setups we have on our radar.

Dollar Index wobbles around 95.50

The Dollar Index (DXY) remains on standby ahead of the US inflation report. As discussed earlier in the week, a report that meets or exceeds expectations may fuel speculation over a more aggressive hawkish cycle and a possible 50-basis point rate hike in March. This may inject dollar bulls with enough inspiration to send the DXY towards 96.00 and beyond. Should prices remain below 95.50, bears are likely to eye 94.56 and lower.

NZDUSD gearing for a breakout?

The NZDUSD has the potential to push higher if a daily close above 0.6700 is achieved. This could open the doors towards 0.6800 and 0.6860, respectively. Should 0.6700 prove to be unreliable resistance, a decline back towards 0.6600 and 0.6530 on the cards.

AUDUSD breakout or rejection?

It may be wise to keep a close eye on how prices behave around 0.7180. A solid break above this resistance could encourage a move towards 0.7250 and 0.7300. If bulls are unable to push above 0.7180, the currency pair could decline back towards the previous higher low around 0.7070 before targeting 0.6990.

USDCAD presses against 1.2650

The USDCAD is struggling to keep above the 1.2650 level with bears chipping at this support with each passing day. A breakdown could be on the horizon which may open the doors towards 1.2580. If the dollar receives a boost from the pending inflation report, this could trigger a rebound on the USDCAD with 1.2750 and 1.2800 acting as key levels of interest.

EURUSD on standby…

Where the EURUSD concludes this week may be heavily influenced by the US inflation data. The key levels of interest can be found at 1.1482, 1.1424, and 1.1370. Although the trend is turning bullish on the daily charts, a strong dollar could drag the currency pair back towards 1.1320 and lower. Should bulls achieve a solid breakout above 1.1482, this could open the doors towards 1.1558.

USDJPY finds comfort around 115.50

Prices remain in a bullish channel on the daily charts. A strong move above 115.50 could signal an incline towards 116.00 and 116.30. Should 115.50 prove to be an unreliable resistance, a decline back towards 114.50 and 114.00 could be a possibility.

GBPUSD gearing for breakdown?

An appreciating dollar could encourage bears to attack the 1.3500 level. If this level is breached, this could trigger a selloff towards 1.3400 and 1.3350. Alternatively, a breakout above 1.3600 should open a path towards 1.3670 and 1.3750.

Bonus: S&P500 bulls back in town

It looks like S&P500 bulls are back in the building this week with prices bursting above 4545 on Wednesday. A breakout 4590 could trigger a move higher towards 4640. If bulls run out of steam and prices slip back below 4545, the next key level can be found at 4495.

Bonus: Nasdaq presses against 15000

The Nasdaq100 is turning bullish on the daily charts. A strong daily close above 15000 may signal an incline towards 15300. If 15000 proves to be strong resistance, prices may decline back towards 14500.

Bonus: Gold shines ahead of CPI data

It has been a positive week for gold with prices breaking above the $1831 resistance level. A daily close above this point may trigger an incline towards $1845. However, weakness below $1831 could inspire bears to target $1810 and $1800. Ultimately, where the precious metal concludes this week will be influenced by the US inflation report.

Disclaimer: The content in this article comprises personal opinions and should not be construed as containing personal and/or other investment advice and/or an offer of and/or solicitation for any transactions in financial instruments and/or a guarantee and/or prediction of future performance. ForexTime (FXTM), its affiliates, agents, directors, officers or employees do not guarantee the accuracy, validity, timeliness or completeness, of any information or data made available and assume no liability as to any loss arising from any investment based on the same.


Forex-Time-LogoArticle by ForexTime

ForexTime Ltd (FXTM) is an award winning international online forex broker regulated by CySEC 185/12 www.forextime.com

Intraday Market Analysis – The Euro Cools Down

By Orbex

EURUSD hits resistance

EURUSD

The euro fell back after ECB President Lagarde tried to cool rate hike expectations. The rally came under pressure at the January peak of 1.1480.

The RSI’s overextension at this daily resistance prompted momentum buyers to cash in. A combination of profit-taking and fresh selling may drive the exchange rate lower.

Short-term sentiment remains upbeat though unless the single currency drops below the origin of its bullish push at 1.1270. A recovery above 1.1480 could pave the way to last October’s high at 1.1690.

GBPUSD consolidates gains

GBPUSD

The sterling turns higher as traders price in an increasingly hawkish Bank of England. A break above 1.3520 forced sellers to cover some of their positions.

However, the pound’s rally came to a halt in the supply zone around 1.3620. The RSI’s overbought situation and bearish divergence suggest softness in the underlying momentum.

The pair found bids on the 50% Fibonacci retracement level (1.3490), which sits in the aforementioned supply area. A new rally may propel the pair to the daily resistance at 1.3750.

US 30 bounces higher

Dow Jones 30

The Dow Jones 30 inches higher supported by better-than-expected earnings. The index steadied after successive breaks above 34800 and 35450.

Nonetheless, the recent recovery slowed down on the 30-day moving average, a sign of a lingering cautious mood. 34500 is a key support to keep the rebound relevant.

A bearish breakout could extend the correction to 33800. On the upside, a rally above 35700 could attract momentum traders and initiate a bullish reversal to 36500.


Orbex-LogoArticle by Orbex

Orbex is a fully licensed broker that was established in 2011. Founded with a mission to serve its traders responsibly and provides traders with access to the world’s largest and most liquid financial markets. www.orbex.com

Ichimoku Cloud Analysis 09.02.2022 (EURUSD, BRENT, XAUUSD)

Article By RoboForex.com

EURUSD, “Euro vs US Dollar”

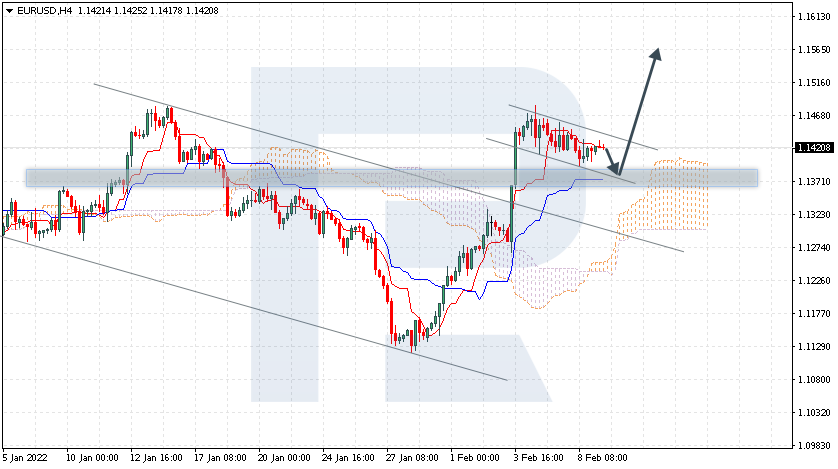
EURUSD is trading at 1.1420; the instrument is moving above Ichimoku Cloud, thus indicating an ascending tendency. The markets could indicate that the price may test Tenkan-Sen and Kijun-Sen at 1.1370 and then resume moving upwards to reach 1.1565. Another signal in favour of a further uptrend will be a rebound from the support level. However, the bullish scenario may no longer be valid if the price breaks the cloud’s downside border and fixes below 1.1255. In this case, the pair may continue falling towards 1.1165. To confirm further growth, the asset must break the upside border of the Flag pattern and fix above 1.1465.

EURUSD
Risk Warning: the result of previous trading operations do not guarantee the same results in the future

BRENT

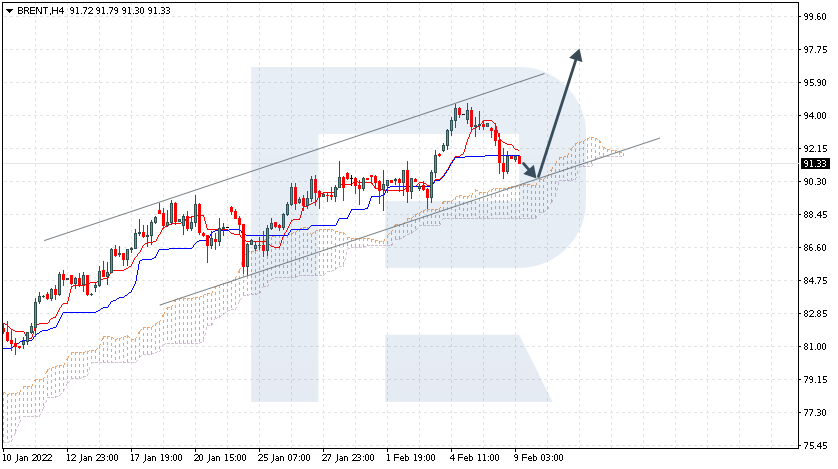
Brent is trading at 91.33; the instrument is moving above Ichimoku Cloud, thus indicating an ascending tendency. The markets could indicate that the price may test the cloud’s upside border at 90.30 and then resume moving upwards to reach 97.75. Another signal in favour of a further uptrend will be a rebound from the rising channel’s downside border. However, the bullish scenario may no longer be valid if the price breaks the cloud’s downside border and fixes below 87.25. In this case, the pair may continue falling towards 85.05.

BRENT
Risk Warning: the result of previous trading operations do not guarantee the same results in the future

XAUUSD, “Gold vs US Dollar”

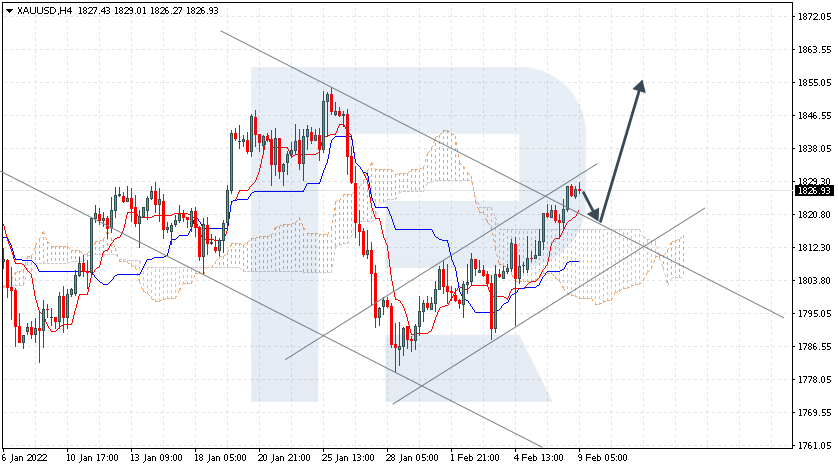
XAUUSD is trading at 1826.00; the instrument is moving above Ichimoku Cloud, thus indicating an ascending tendency. The markets could indicate that the price may test the cloud’s upside border at 1815.00 and then resume moving upwards to reach 1855.00. Another signal in favour of a further uptrend will be a rebound from the descending channel’s upside border. However, the bullish scenario may no longer be valid if the price breaks the cloud’s downside border and fixes below 1780.00. In this case, the pair may continue falling towards 1755.00.

XAUUSD

Article By RoboForex.com

Attention!
Forecasts presented in this section only reflect the author’s private opinion and should not be considered as guidance for trading. RoboForex LP bears no responsibility for trading results based on trading recommendations described in these analytical reviews.

Fibonacci Retracements Analysis 09.02.2022 (GBPUSD, EURJPY)

Article By RoboForex.com

GBPUSD, “Great Britain Pound vs US Dollar”

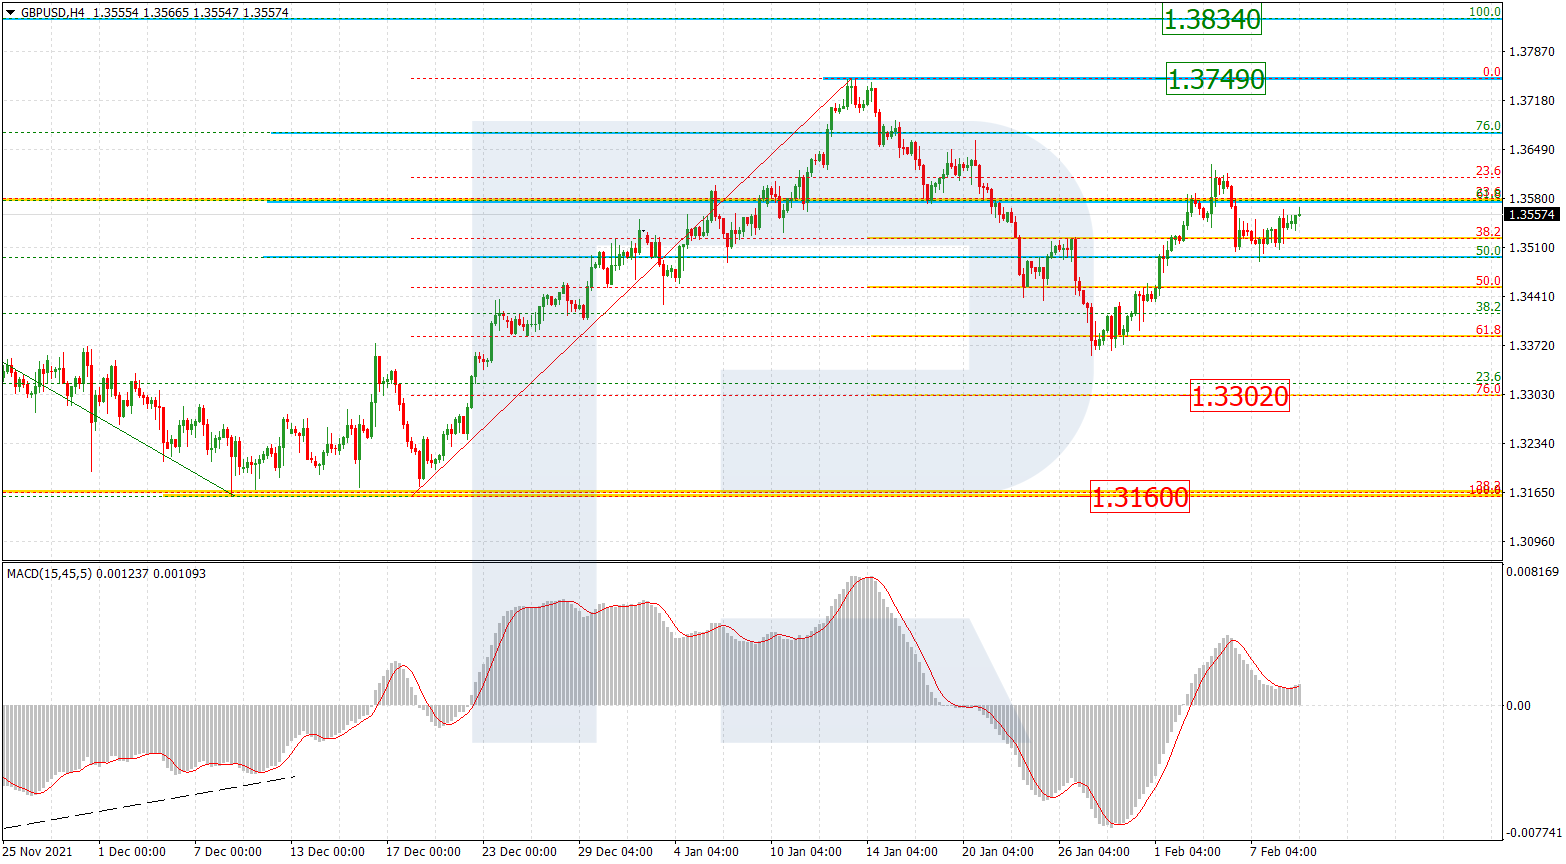
As we can see in the H4 chart, the rising wave, which is heading towards the local high at 1.3749, is slowing down. After breaking the high, the asset may reach the key resistance at 1.3834. However, there is an alternative scenario suggesting that the asset may resume falling towards 76.0% fibo and the low at 1.3302 and 1.3160 respectively, but it’s rather unlikely.

GBPUSD_H4
Risk Warning: the result of previous trading operations do not guarantee the same results in the future

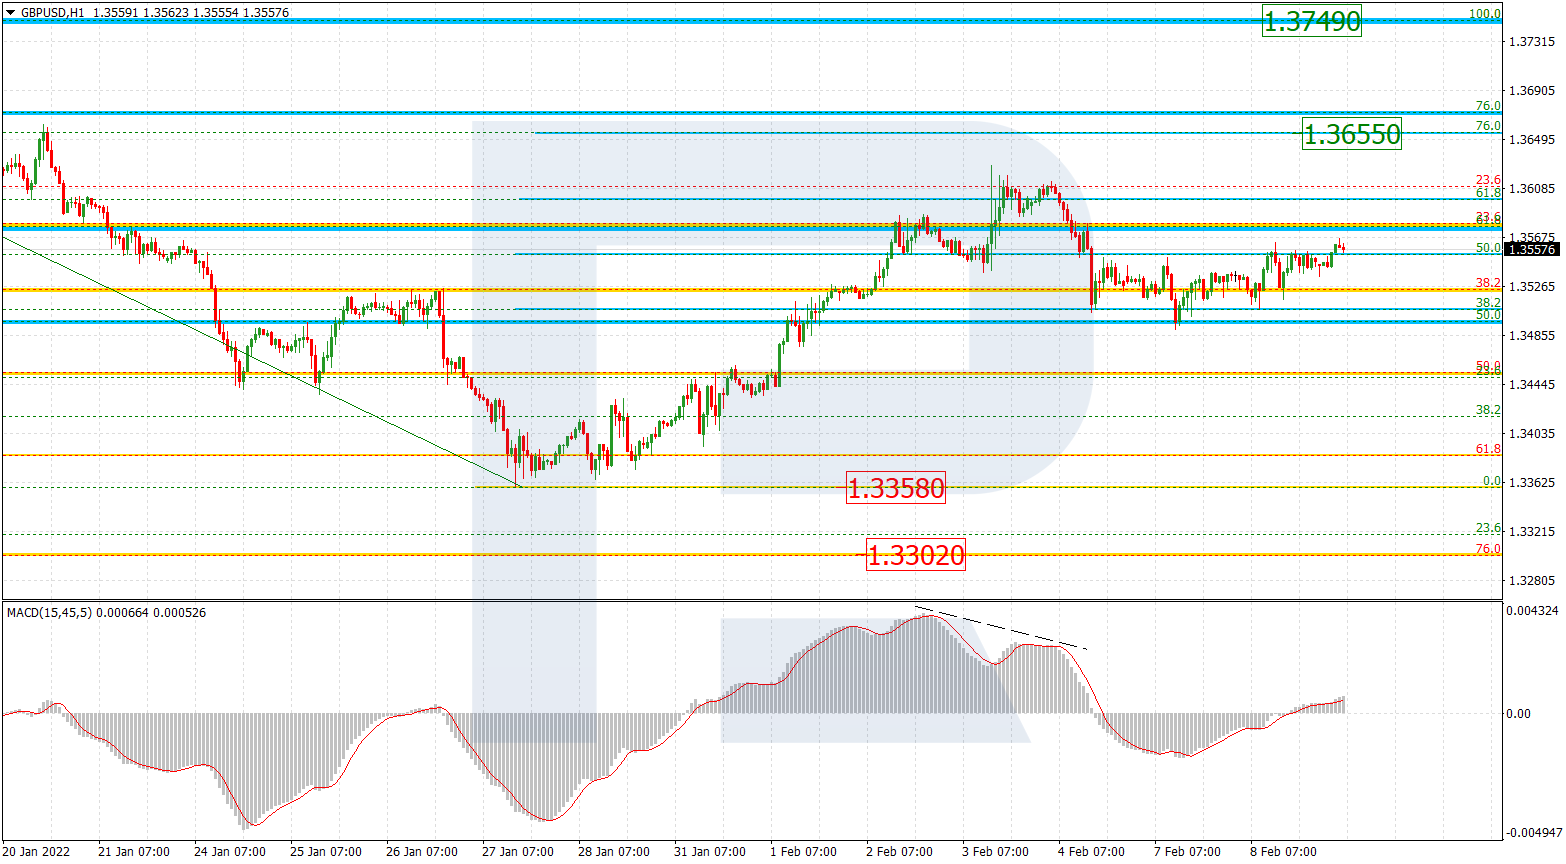
The H1 chart shows a more detailed structure of the current correctional uptrend. By now, the ascending wave has already reached 61.8% fibo and right now the asset is correcting to the downside after local divergence on MACD. Later, the pair may continue growing towards 76.0% fibo and the4 high at 1.3655 and 1.3749 respectively. The local support is the low at 1.3358.

GBPUSD_H1
Risk Warning: the result of previous trading operations do not guarantee the same results in the future

EURJPY, “Euro vs. Japanese Yen”

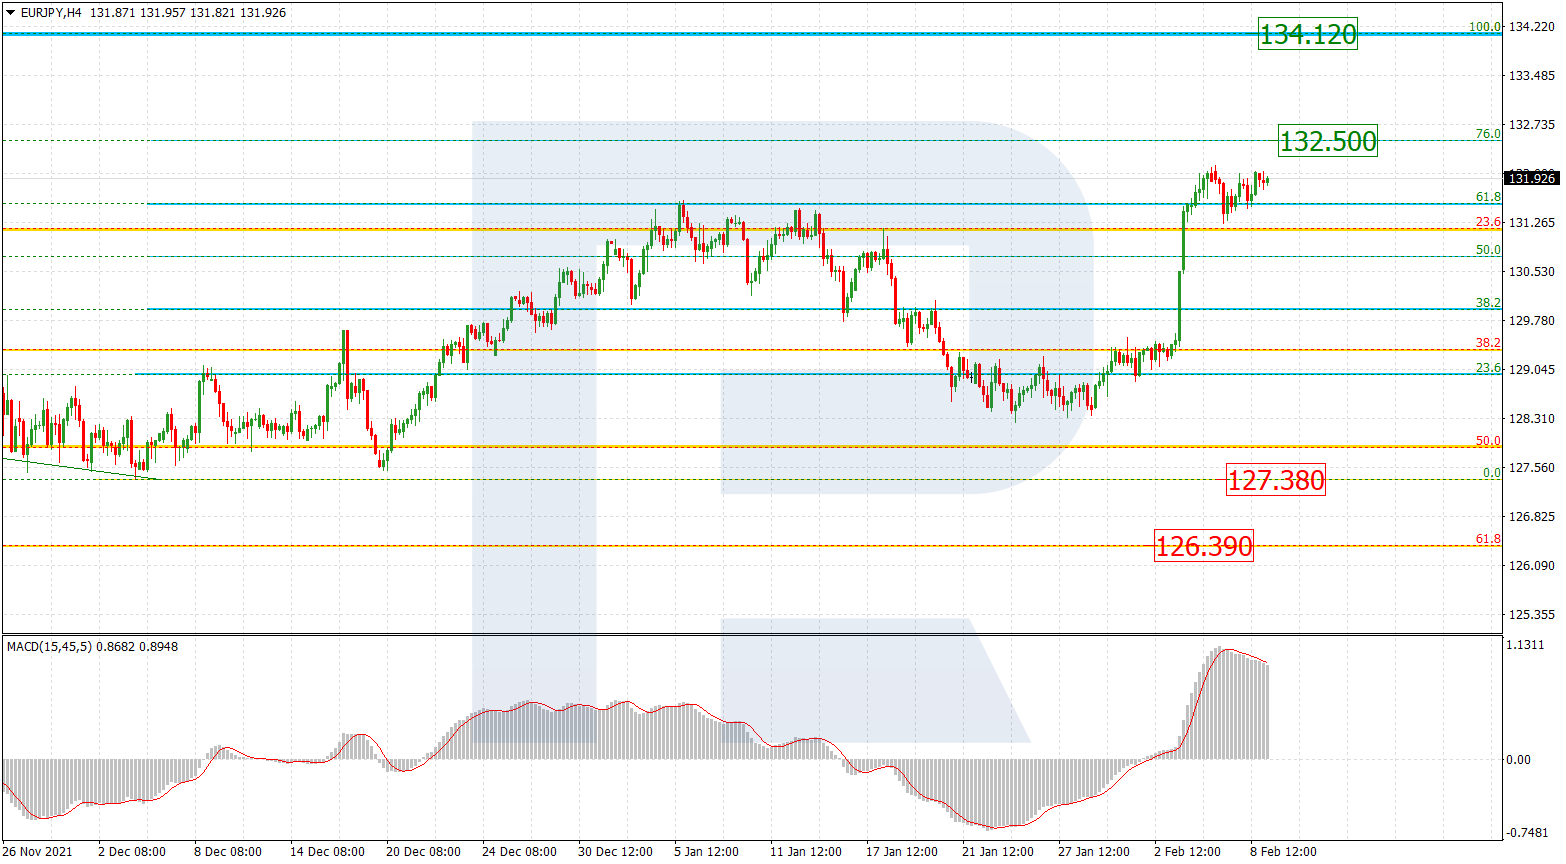
As we can see in the H4 chart, EURJPY is forming a quick rising impulse within the uptrend, which has already reached 61.8% fibo. At the moment, the asset is starting a short-term pullback. The next upside targets are 76.0% fibo and the high at 132.50 and 134.12 respectively.

EURJPY_H4
Risk Warning: the result of previous trading operations do not guarantee the same results in the future

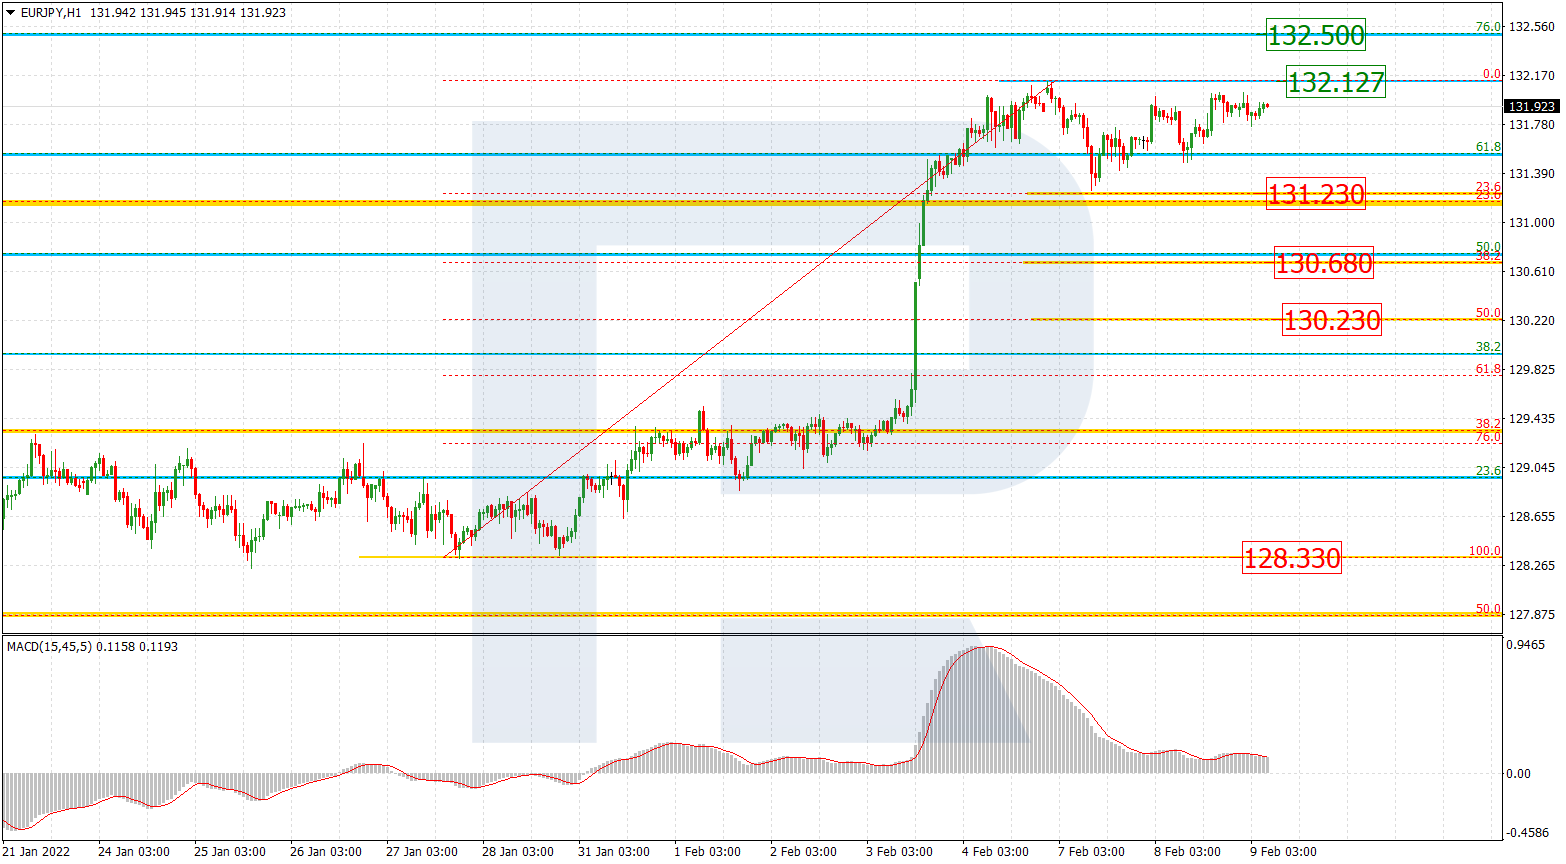
The H1 chart shows a more detailed structure of the correctional downtrend and its targets, 23.6%, 38.2%, and 50.0% fibo at 131.23, 130.68, and 130.23 respectively. A breakout of the local high at 132.12 will result in a further uptrend.

EURJPY_H1

Article By RoboForex.com

Attention!
Forecasts presented in this section only reflect the author’s private opinion and should not be considered as guidance for trading. RoboForex LP bears no responsibility for trading results based on trading recommendations described in these analytical reviews.

The Analytical Overview of the Main Currency Pairs on 2022.02.09

by JustForex

The EUR/USD currency pair

Technical indicators of the currency pair:
  • Prev Open: 1.1441
  • Prev Close: 1.1416
  • % chg. over the last day: -0.22%

In her speech this week, ECB head Christine Lagarde was more cautious about the ECB’s interest rate hike in 2022. On Tuesday, another ECB councilman, Pablo Hernández de Cos, said that any central bank action “should be gradual.”

Trading recommendations
  • Support levels: 1.1414, 1.1362, 1.1329, 1.1275
  • Resistance levels: 1.1481, 1.1534, 1.1617

From the technical point of view, the EUR/USD on the hourly time frame is bullish. The EUR/USD currency pair is trading in the wide corridor of 1.1414-1.1481. Yesterday, the price tried to break down the lower border of the corridor, but the buyers were able to protect their positions, and as a result, a false breakdown zone was formed. Under such market conditions, buy trades should be looked at from the support level of 1.1414, with the targets to the upper border of the corridor. Sell trades are better to look for on intraday time frames from the upper boundary of the corridor, but only with short targets.

Alternative scenario: if the price breaks out through the 1.1275 support level and fixes below, the mid-term uptrend will likely be broken.

EUR/USD
News feed for 2022.02.09:
  • – US FOMC Member Bowman’s Speech at 17:30 (GMT+2);
  • – US FOMC Member Mester’s Speech at 19:00 (GMT+2).

The GBP/USD currency pair

Technical indicators of the currency pair:
  • Prev Open: 1.3536
  • Prev Close: 1.3547
  • % chg. over the last day: +0.03%

The British pound now has fundamental support from the Bank of England because when interest rates rise, the national rate strengthens in the medium term. However, it should not be forgotten that the Fed is also preparing to raise interest rates since March and may do so more aggressively if Thursday’s inflation data turns out to be worse than expected. As a result, a mixed medium-term background forms the GBP/USD currency pair.

Trading recommendations
  • Support levels: 1.3475, 1.3457, 1.3434
  • Resistance levels: 1.3583, 1.3619, 1.3639, 1.3662

On the hourly time frame, the trend on GBP/USD is bullish. The volatility on the currency pair has now decreased, while the MACD indicator has become inactive. Under such market conditions, buy trades should be looked at from the support level 1.3475. There are no optimal entry points for sell deals now.

Alternative scenario: if the price breaks out through the 1.3475 support level and consolidates below, the bullish scenario will be broken.

GBP/USD
There is no news feed for today.

The USD/JPY currency pair

Technical indicators of the currency pair:
  • Prev Open: 115.05
  • Prev Close: 115.24
  • % chg. over the last day: +0.42%

The USD/JPY quotes are showing a medium-term uptrend as the monetary policy of the Bank of Japan is now aimed at making the JPY cheaper due to the maximum stimulus, while the Fed is tightening monetary policy and may do it more aggressively if Thursday’s inflation data turns out to be disappointing.

Trading recommendations
  • Support levels: 115.15, 114.96, 114.76
  • Resistance levels: 115.73, 116.08

The global trend on the USD/JPY currency pair is bullish. The Japanese yen keeps getting cheaper amid the rising dollar index and due to the ultra-soft monetary policy of the Bank of Japan. Under such market conditions, it is best to look for buy deals on the lower time frames from the support level of 115.15. Sell potions can be looked for at the nearest resistance levels, but only with short targets and with additional confirmation.

Alternative scenario: if the price fixes below 114.76, the uptrend will likely be broken.

USD/JPY
There is no news feed for today.

The USD/CAD currency pair

Technical indicators of the currency pair:
  • Prev Open: 1.2666
  • Prev Close: 1.2702
  • % chg. over the last day: +0.28%

The Canadian dollar is a commodity currency, so it depends not only on the monetary policy of the Bank of Canada but also on the oil prices and the dollar index. Yesterday, the Canadian dollar slightly decreased against the US dollar, as oil prices have dropped below $90. The pressure on oil prices is now getting stronger against the background of renewed negotiations between Iran and the USA to ease sanctions, which might lead to the growth in the supply of Iranian oil to the world market.

Trading recommendations
  • Support levels: 1.2649, 1.2586, 1.2506
  • Resistance levels: 1.2729, 1.2792

From a technical point of view, the USD/CAD currency pair is bullish. The upward movement was not able to continue. A wider flat began to form. Under such market conditions, it is better to look for buy trades on the lower time frames from the support levels of 1.2649. There are no optimal entry points to sell deals now.

Alternative scenario: if the price breaks through the 1.2649 support level and fixes below, the downtrend is likely to resume.

USD/CAD
News feed for 2022.02.09:
  • – US Crude Oil Reserves (w/w) at 17:30 (GMT+2);
  • – Canada BoC Gov Macklem’s Speech at 19:00 (GMT+2).

by JustForex


This article reflects a personal opinion and should not be interpreted as an investment advice, and/or offer, and/or a persistent request for carrying out financial transactions, and/or a guarantee, and/or a forecast of future events.

Technical Outlook: Yen Crosses Under The Spotlight

Lukman Otunuga

By Lukman Otunuga Senior Research Analyst, ForexTime

Our currency spotlight shines on the Japanese Yen which has weakened against most G10 currencies this week.

The weakness could be based on a jump in risk sentiment amid strong corporate earnings. However, geopolitical tensions and inflation worries could still accelerate the flight to safety, rekindling appetite for safe-haven assets like the Yen.

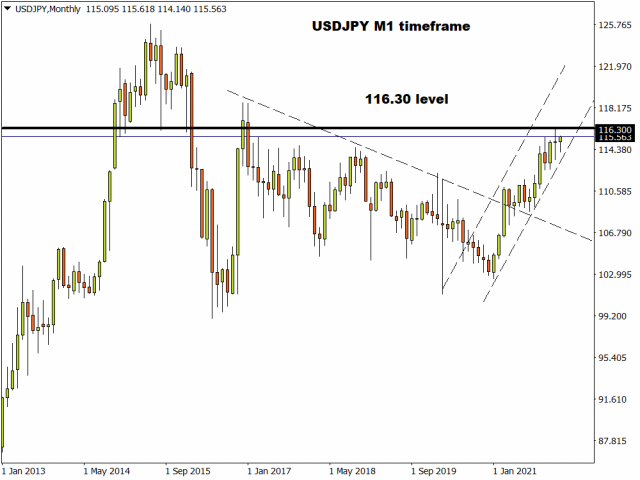
Focusing on the technicals, February could be a volatile month for the Yen if conflicting themes influence global risk sentiment. Looking at the USDJPY, prices remain firmly bullish on the monthly timeframe as there have been consistently higher highs and higher lows. Bulls remain in a position of power but need to conquer 116.30 to open the doors to further upside.

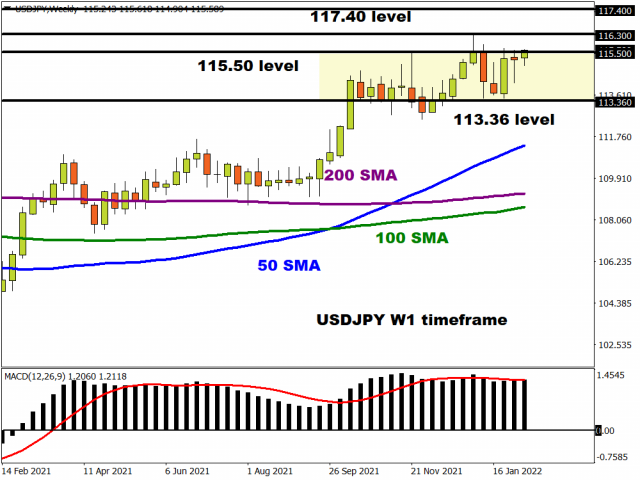
The story changes on the weekly charts. Prices remain in a wide range with support around 113.360 and resistance at 115.50. A solid weekly close above this resistance could trigger an incline towards 116.30 and 117.40.  Alternatively, a rejection from 115.50 could inspire a selloff towards 114.50, 114.00, and 113.360.

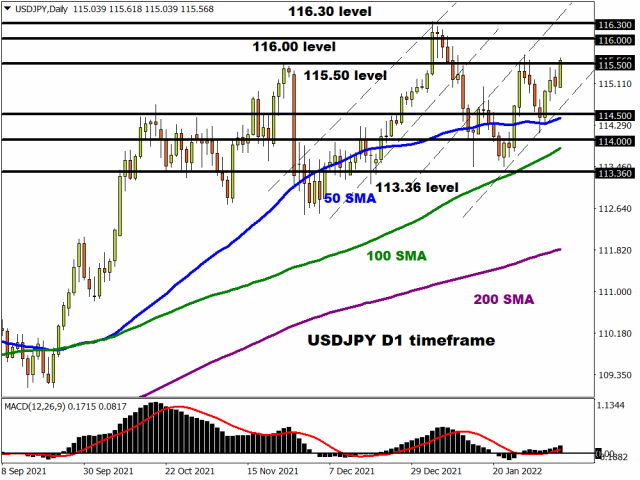
Some momentum is building on the daily charts with bulls in a position of power. A strong daily close above 115.50 could trigger a move towards 116.00 and 116.30.

EURJPY bulls in the building

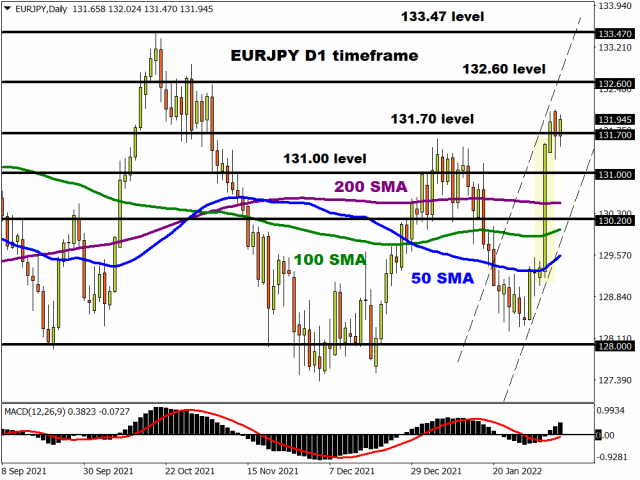
The aggressive rally last Thursday may have set the tone for the EURJPY this month.

A hawkish ECB tipped the balance between the EUR and JPY with bulls going out of control. Prices are trading around the 132.00 level of writing with further upside certainly on the cards. A strong daily close above 131.70 could encourage a move towards 132.60 and 133.47. Technical indicators such as the Simple Moving Average and MACD agree with the bullish outlook. Should 131.70 prove to be unreliable support, a decline back towards 131.00 and 130.20 could become reality.

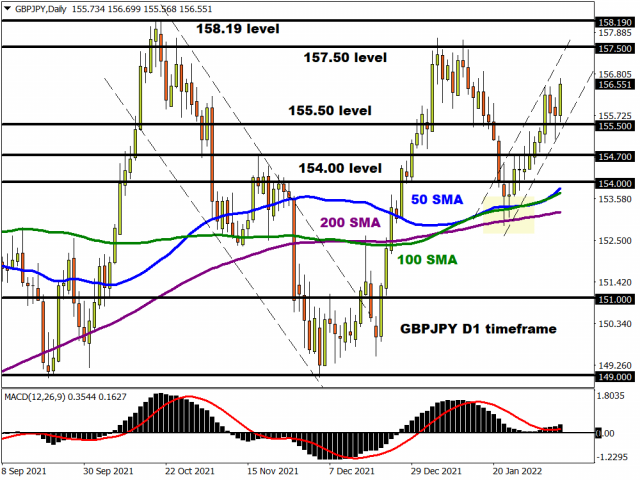
GBPJPY journeys north after bounce on MAs

The GBPJPY remains in a healthy bullish trend on the daily charts after bouncing from the 50,100 and 200 Simple Moving Averages. A weaker Yen may inject GBPJPY bulls with enough confidence to challenge the 157.50 resistance level. Should prices secure a daily close above this point, the next key point of interest will be found around 158.19. Alternatively, if 157.50 proves to be a tough nut to crack, prices are likely to decline back towards the 155.50 support.

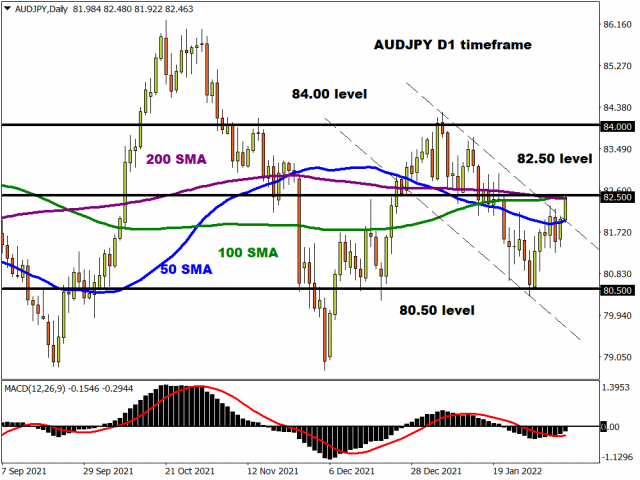
AUDJPY presses against 82.50

A major breakout could be on the horizon for the AUDJPY. Prices are trading just below the 82.50 level which is where the 50, 100, and 200 Simple Moving Average reside. A solid breakout and daily close above this point could open a path towards 84.00. Should 82.50 prove to be reliable resistance, prices may decline back towards 80.50.

Disclaimer: The content in this article comprises personal opinions and should not be construed as containing personal and/or other investment advice and/or an offer of and/or solicitation for any transactions in financial instruments and/or a guarantee and/or prediction of future performance. ForexTime (FXTM), its affiliates, agents, directors, officers or employees do not guarantee the accuracy, validity, timeliness or completeness, of any information or data made available and assume no liability as to any loss arising from any investment based on the same.


Forex-Time-LogoArticle by ForexTime

ForexTime Ltd (FXTM) is an award winning international online forex broker regulated by CySEC 185/12 www.forextime.com

XAGUSD Bearish Zigzag Ⓩ To End Near 20.170

By Orbex

XAGUSD

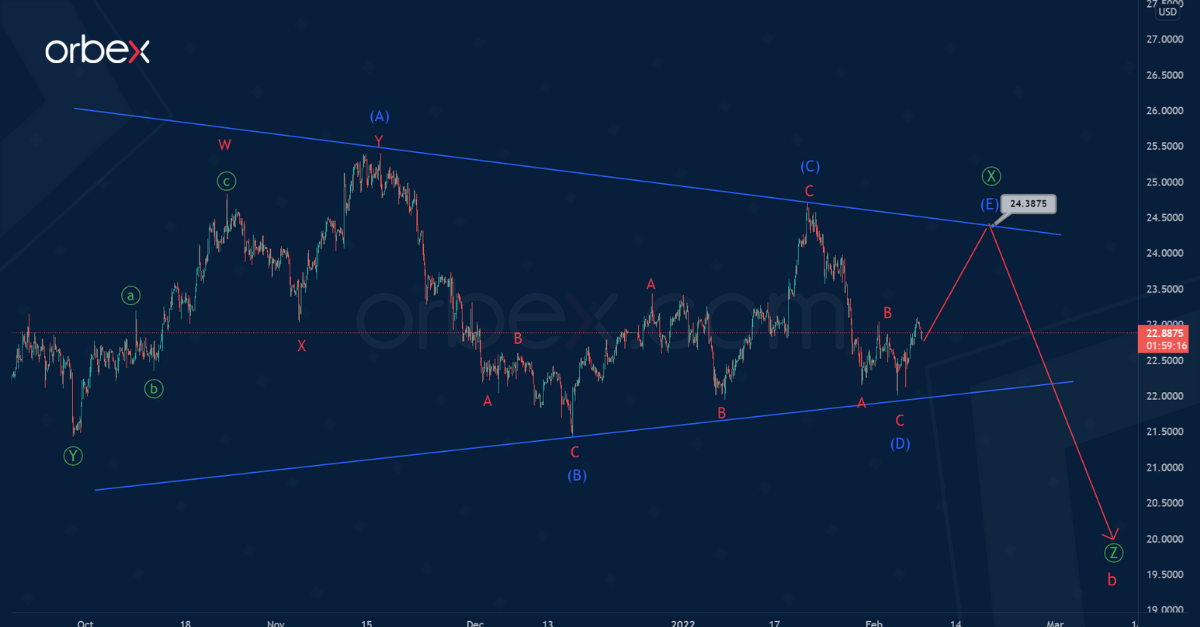
The XAGUSD pair shows the development of a long-term correction wave b, which forms a pullback to the bullish impulse a.

Wave b is a triple zigzag and consists of primary sub-waves Ⓦ-Ⓧ-Ⓨ-Ⓧ-Ⓩ. The first four parts of this triple zigzag have ended. So now we see the construction of the final wave Ⓩ.

Wave Ⓩ, like the sub-waves Ⓦ and Ⓨ, is a simple bearish zigzag and includes intermediate sub-waves (A)-(B)-(C). Wave (A) is fully complete, (B) is almost complete.

In the near future, when the market fully forms a correction (B), there could be a continuation of the decline in the impulse wave (C) to the 20.170 area. At that level, the entire wave Ⓩ will be at 61.8% of wave Ⓨ.

The probability of completing the decline at the level of the golden ratio is quite high. Subsequently, at the end of the entire wave b, there might be a growth of the market.

XAGUSD

An alternative option indicates that the correction intervening wave Ⓧ will take the form of a contracting horizontal triangle (A)-(B)-(C)-(D)-(E). The internal structure of all the sub-waves of this triangle is visible in the chart.

The sub-wave (A) is a double zigzag, (B) is a simple bearish zigzag, (C) and (D) also took the form of simple zigzags. It is likely that the final sub-wave (E) of this triangle is developing now.

This wave can take the form of any correction wave, but most likely we will see a simple zigzag or a combination of zigzags. The growth in wave (E) could continue to the level of 24.38. This is located on the resistance line drawn through the vertices of the sub-waves (A) and (C).

Then, the final wave Ⓩ could complete the bearish trend.


Orbex-LogoArticle by Orbex

Orbex is a fully licensed broker that was established in 2011. Founded with a mission to serve its traders responsibly and provides traders with access to the world’s largest and most liquid financial markets. www.orbex.com
Intraday Market Analysis – Gold Bounces Back

By Orbex

XAUUSD breaks resistance

XAUUSD

Gold continues to recover as the US dollar treads water.

The previous fall below the daily support at 1785 had put the bulls on the defensive. The RSI’s oversold signal attracted some buying interest and prompted sellers to cover, driving up the price.

The rebound has since gained traction after the metal rallied above the support-turned-resistance at 1817. In fact, the bullish breakout may raise momentum and open the door to the recent peak at 1850.

On the downside, 1795 is a major support to keep buyers committed.

NZDUSD remains under pressure

NZDUSD

The New Zealand dollar edges lower amid cautious market sentiment at the start of the week. The pair previously bounced off September 2020’s low around 0.6530.

However, 0.6700 on the 20-day moving average so far has proven to be a tough hurdle. A drop below the fresh support (0.6630) indicates that the directional bias remains bearish. And sellers would be eager to fade another rebound.

0.6590 is the closest support. A break below 0.6530 could trigger a new round of sell-off towards 0.6400.

UK 100 awaits breakout

UK 100

The FTSE 100 rallies supported by solid performance in the commodity sector.

The recent rebound hit resistance near the January peak at 7640. Narrowing consolidation and higher highs suggest increased buying pressure.

A bullish breakout would flush sellers out and attract momentum traders, firing up volatility in the process. This would be a strong bullish continuation signal.

7460 is a fresh support if the market remains indecisive. Its breach could extend the correction back to 7250.


Orbex-LogoArticle by Orbex

Orbex is a fully licensed broker that was established in 2011. Founded with a mission to serve its traders responsibly and provides traders with access to the world’s largest and most liquid financial markets. www.orbex.com
Japanese Candlesticks Analysis 08.02.2022 (EURUSD, USDJPY, EURGBP)

Article By RoboForex.com
EURUSD, “Euro vs US Dollar”

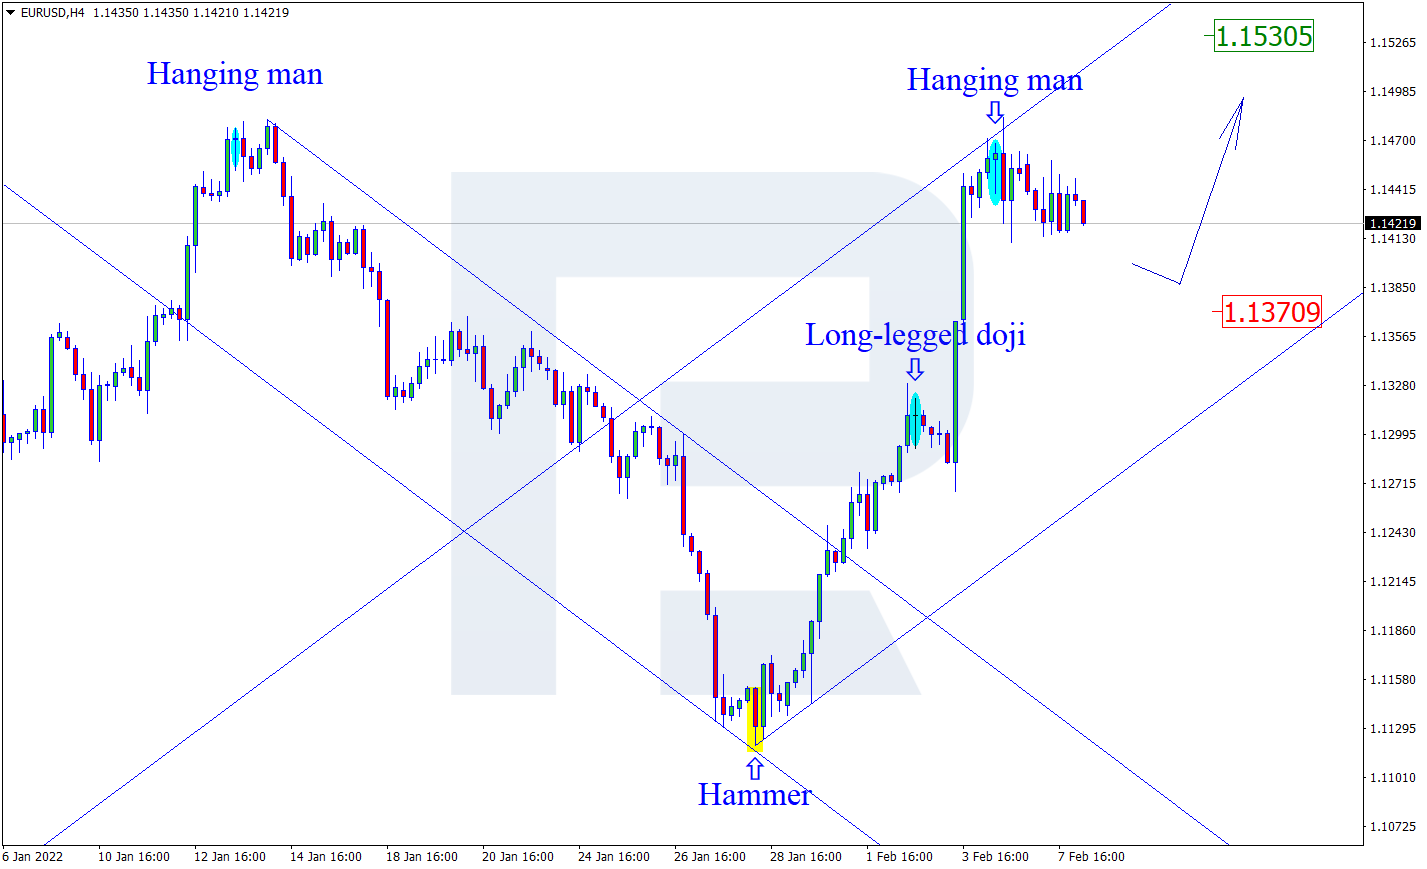
As we can see in the H4 chart, the asset has formed a Hanging Man reversal pattern close to the resistance level. At the moment, EURUSD is reversing and may form a new correctional impulse. In this case, the downside target may be at 1.1370. However, an alternative scenario implies that the price may continue growing to reach 1.1530 without forming any corrections towards the support area.
EURUSD
Risk Warning: the result of previous trading operations do not guarantee the same results in the future

USDJPY, “US Dollar vs Japanese Yen”

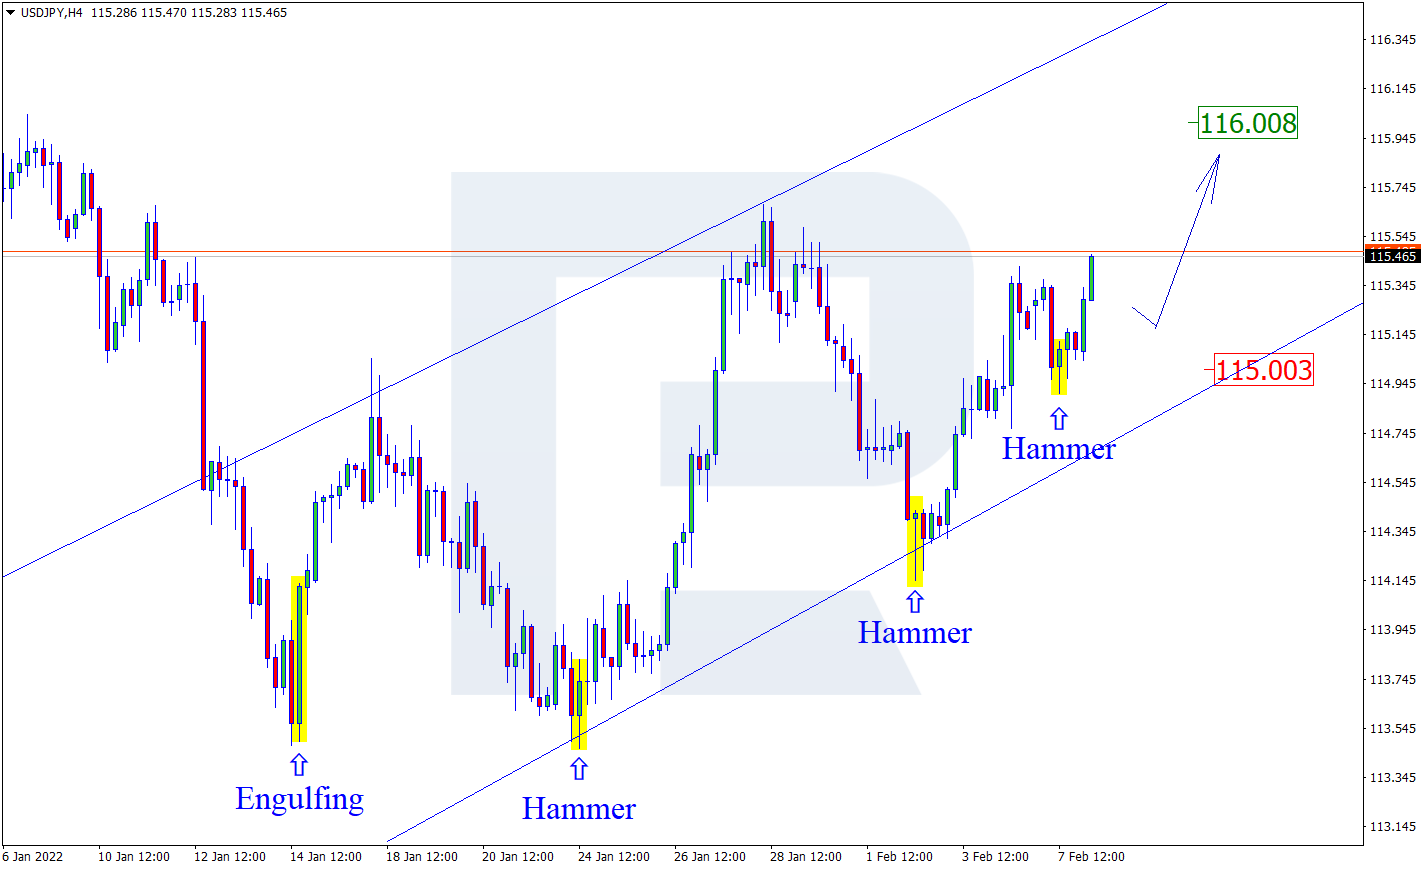
As we can see in the H4 chart, USDJPY has formed a Hammer reversal pattern during the pullback. At the moment, USDJPY is reversing and may start a new rising wave towards the resistance level. In this case, the upside target may be at 116.00. At the same time, an opposite scenario implies that the price may correct to reach 115.00 before resuming its uptrend.

USDJPY
Risk Warning: the result of previous trading operations do not guarantee the same results in the future

EURGBP, “Euro vs Great Britain Pound”

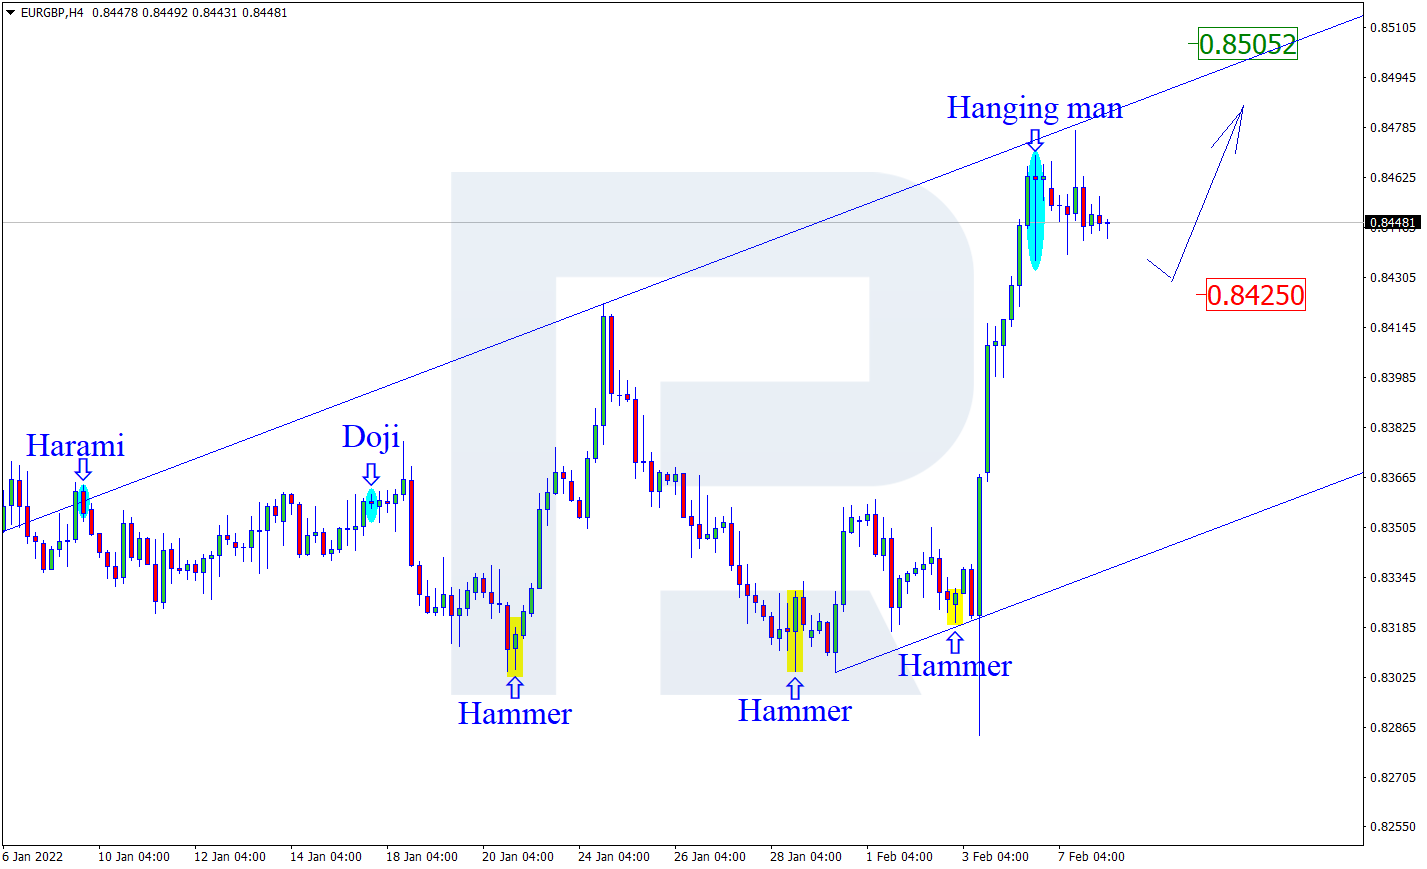
As we can see in the H4 chart, after forming several reversal patterns, for example, Hanging Man, near the resistance level, EURGBP is reversing and may start another decline towards the support area. In this case, the downside target may be at 0.8425. Later, the market may test the area, rebound from it, and resume the ascending tendency. Still, there might be an alternative scenario, according to which the asset may grow to reach 0.8505 without testing the support area.

EURGBP

Article By RoboForex.com

Attention!
Forecasts presented in this section only reflect the author’s private opinion and should not be considered as guidance for trading. RoboForex LP bears no responsibility for trading results based on trading recommendations described in these analytical reviews.

Murrey Math Lines 08.02.2022 (AUDUSD, NZDUSD)

Article By RoboForex.com

AUDUSD, “Australian Dollar vs US Dollar”

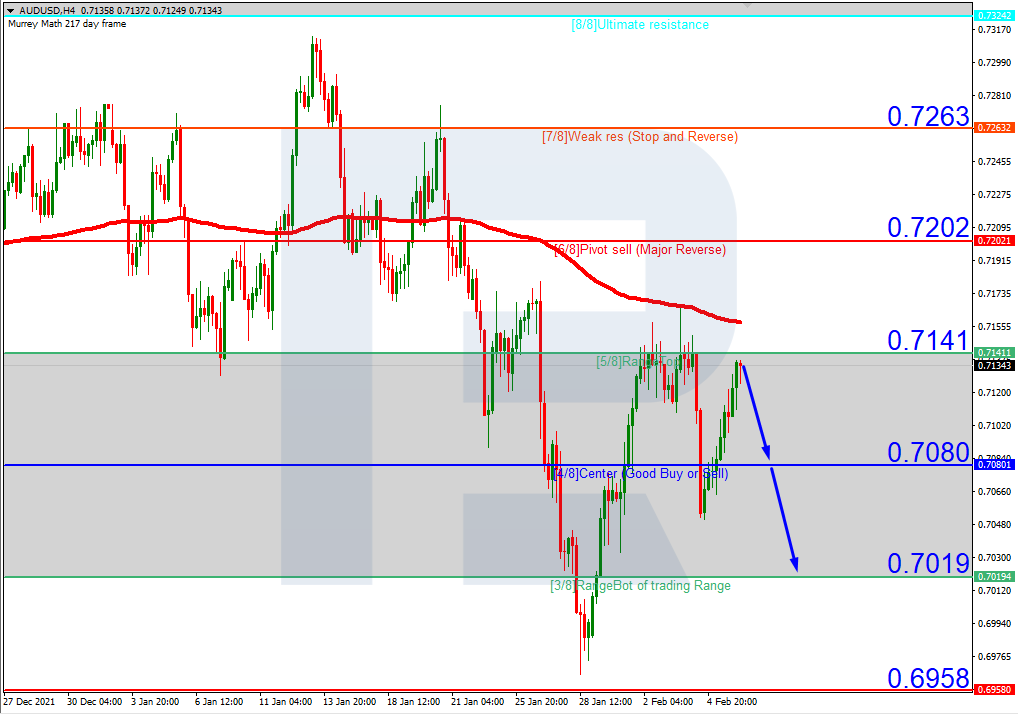
As we can see in the H4 chart, AUDUSD is trading below the 200-day Moving Average, thus indicating a possible descending tendency. In this case, the price is expected to rebound from 5/8 and then resume falling to reach the support at 3/8. However, this scenario may no longer be valid if the price breaks the resistance at 5/8 to the upside. After that, the instrument may reverse and grow towards the next resistance at 7/8.

AUDUSDH4
Risk Warning: the result of previous trading operations do not guarantee the same results in the future

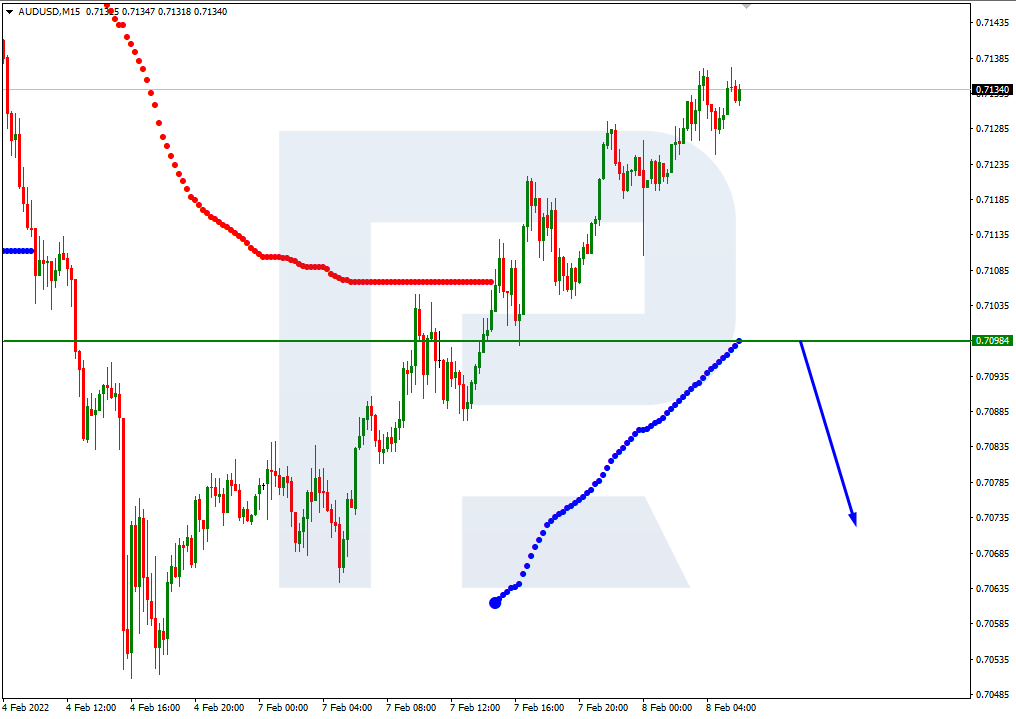
In the M15 chart, the pair may break the downside line of the VoltyChannel indicator and, as a result, continue trading downwards.

AUDUSD_M15
Risk Warning: the result of previous trading operations do not guarantee the same results in the future

NZDUSD, “New Zealand Dollar vs US Dollar”

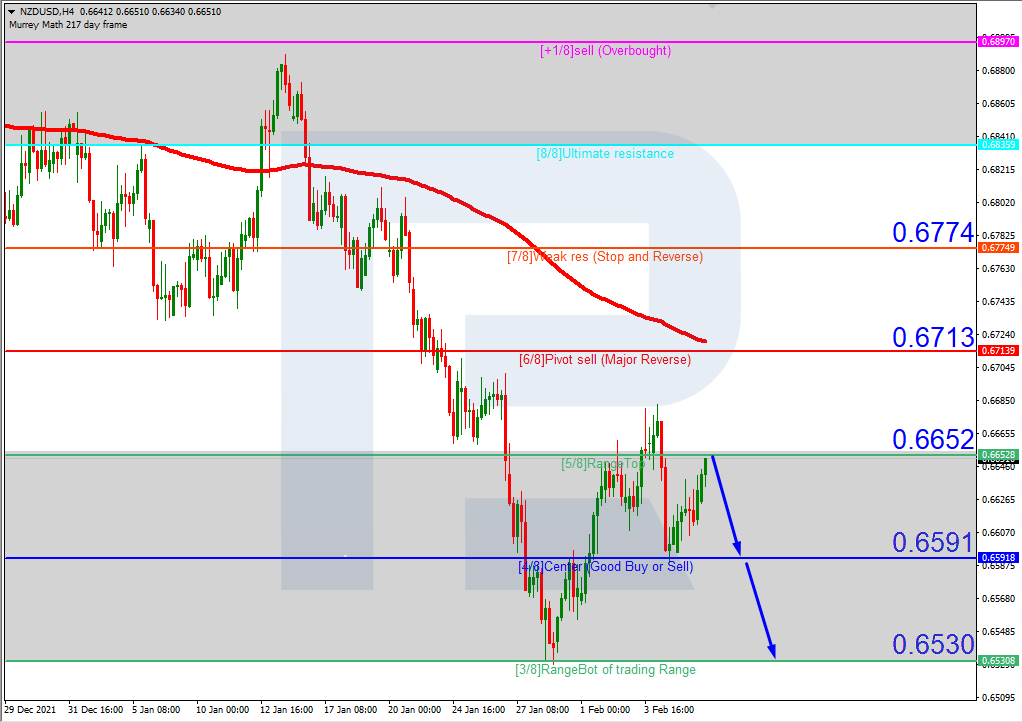
In the H4 chart of NZDUSD, the situation is similar. The asset is trading below the 200-day Moving Average and approaching the resistance at 5/8. In this case, the price is expected to rebound from this level and resume falling to reach the support at 3/8. However, this scenario may no longer be valid if the price breaks the resistance at 5/8 to the upside. After that, the instrument may reverse and grow towards 6/8.

NZDUSD_H4
Risk Warning: the result of previous trading operations do not guarantee the same results in the future

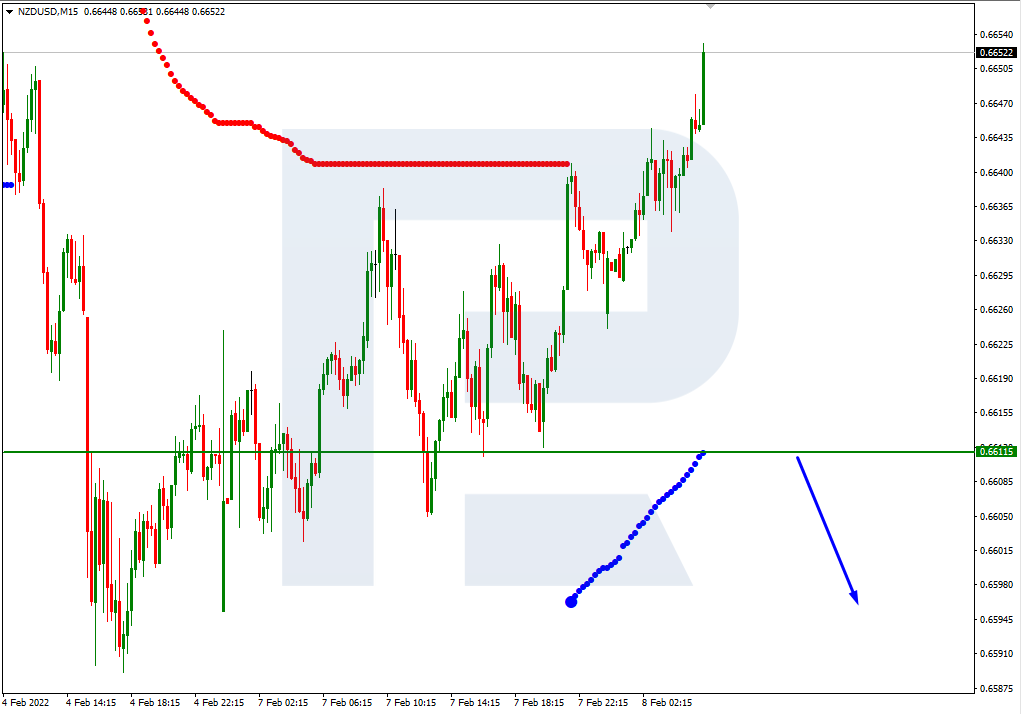
As we can see in the M15 chart, the downside line of the VoltyChannel indicator is pretty far away from the price, that’s why the pair may resume trading downwards only after rebounding from 5/8 in the H4 chart.

NZDUSD_M15

Article By RoboForex.com

Attention!
Forecasts presented in this section only reflect the author’s private opinion and should not be considered as guidance for trading. RoboForex LP bears no responsibility for trading results based on trading recommendations described in these analytical reviews.