by JustForex
The EUR/USD currency pair
- Prev Open: 1.1441
- Prev Close: 1.1416
- % chg. over the last day: -0.22%
In her speech this week, ECB head Christine Lagarde was more cautious about the ECB’s interest rate hike in 2022. On Tuesday, another ECB councilman, Pablo Hernández de Cos, said that any central bank action “should be gradual.”
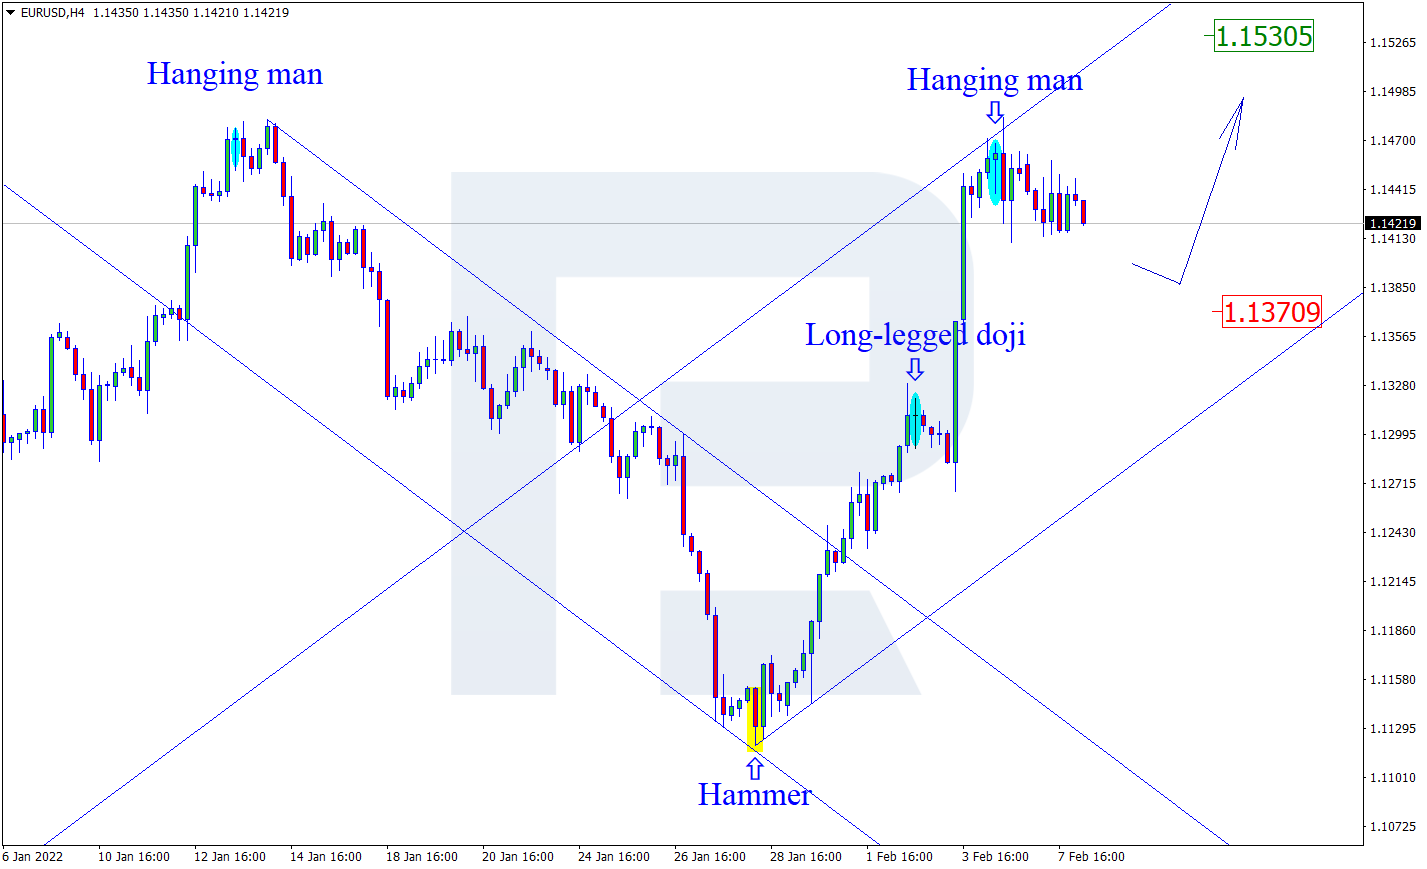
- Support levels: 1.1414, 1.1362, 1.1329, 1.1275
- Resistance levels: 1.1481, 1.1534, 1.1617
From the technical point of view, the EUR/USD on the hourly time frame is bullish. The EUR/USD currency pair is trading in the wide corridor of 1.1414-1.1481. Yesterday, the price tried to break down the lower border of the corridor, but the buyers were able to protect their positions, and as a result, a false breakdown zone was formed. Under such market conditions, buy trades should be looked at from the support level of 1.1414, with the targets to the upper border of the corridor. Sell trades are better to look for on intraday time frames from the upper boundary of the corridor, but only with short targets.
Alternative scenario: if the price breaks out through the 1.1275 support level and fixes below, the mid-term uptrend will likely be broken.

- – US FOMC Member Bowman’s Speech at 17:30 (GMT+2);
- – US FOMC Member Mester’s Speech at 19:00 (GMT+2).
The GBP/USD currency pair
- Prev Open: 1.3536
- Prev Close: 1.3547
- % chg. over the last day: +0.03%
The British pound now has fundamental support from the Bank of England because when interest rates rise, the national rate strengthens in the medium term. However, it should not be forgotten that the Fed is also preparing to raise interest rates since March and may do so more aggressively if Thursday’s inflation data turns out to be worse than expected. As a result, a mixed medium-term background forms the GBP/USD currency pair.
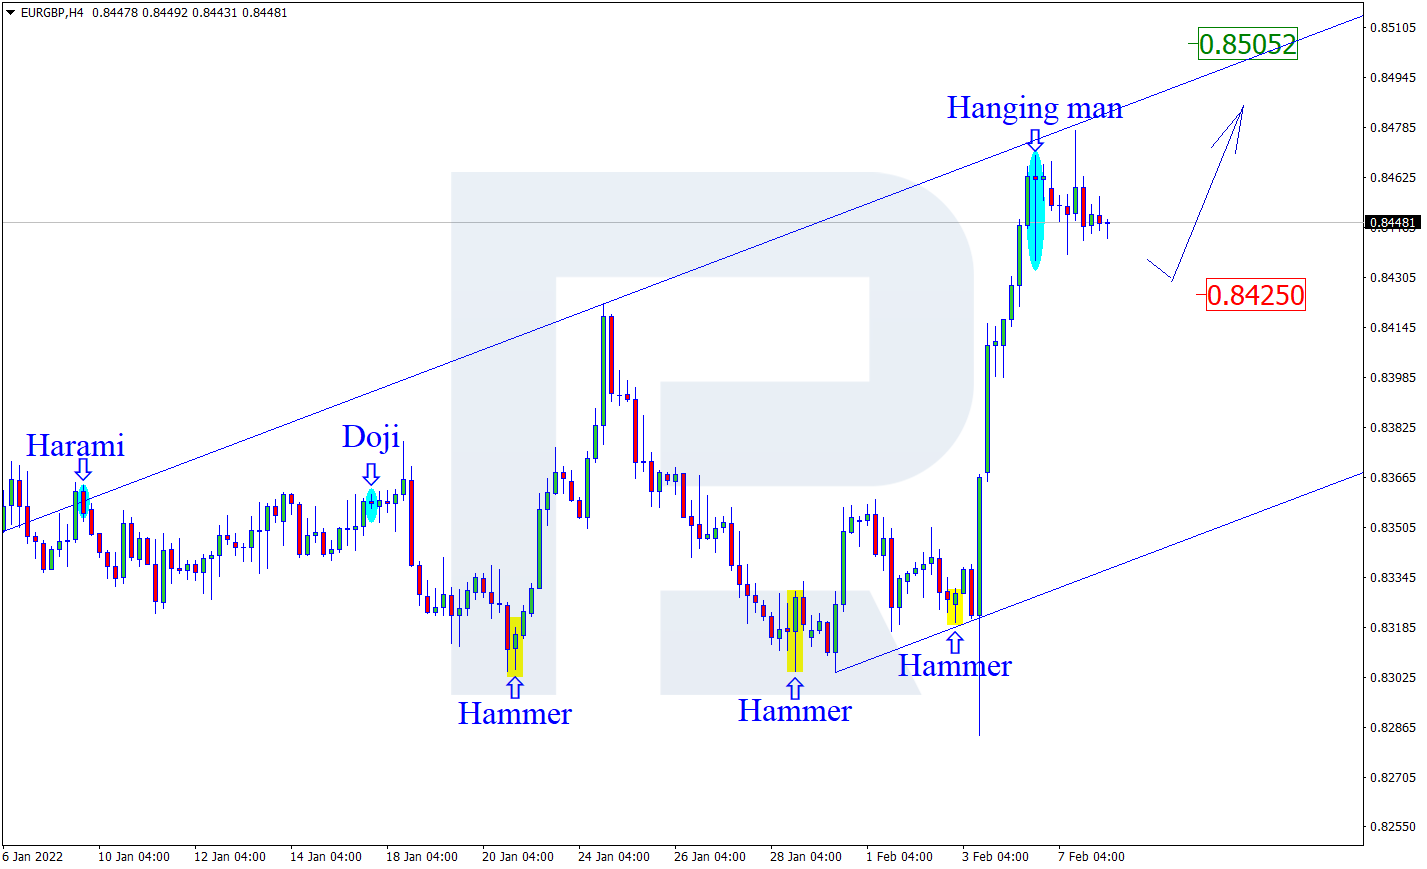
- Support levels: 1.3475, 1.3457, 1.3434
- Resistance levels: 1.3583, 1.3619, 1.3639, 1.3662
On the hourly time frame, the trend on GBP/USD is bullish. The volatility on the currency pair has now decreased, while the MACD indicator has become inactive. Under such market conditions, buy trades should be looked at from the support level 1.3475. There are no optimal entry points for sell deals now.
Alternative scenario: if the price breaks out through the 1.3475 support level and consolidates below, the bullish scenario will be broken.

The USD/JPY currency pair
- Prev Open: 115.05
- Prev Close: 115.24
- % chg. over the last day: +0.42%
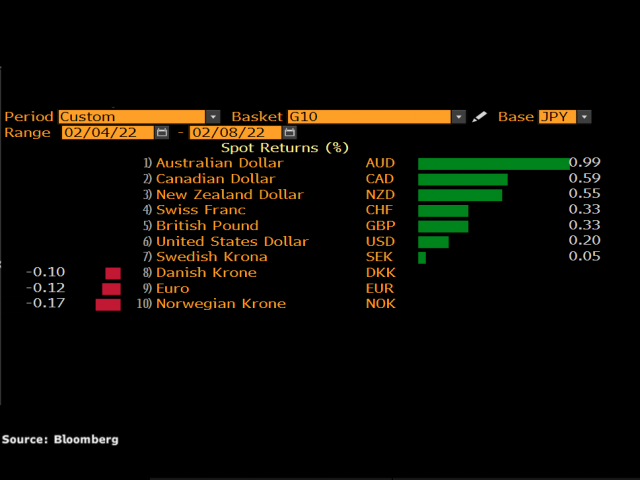
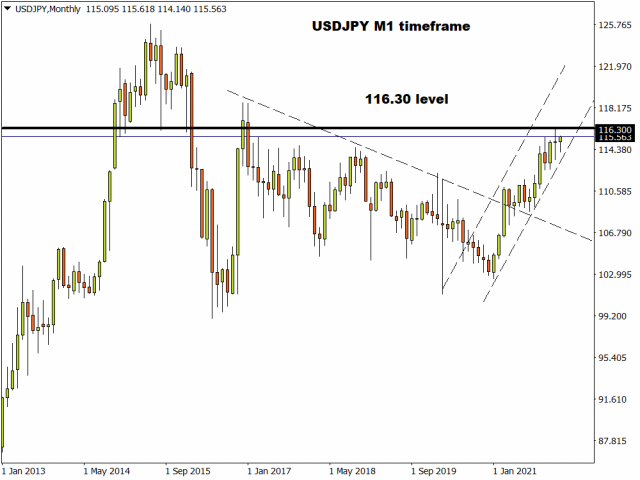
The USD/JPY quotes are showing a medium-term uptrend as the monetary policy of the Bank of Japan is now aimed at making the JPY cheaper due to the maximum stimulus, while the Fed is tightening monetary policy and may do it more aggressively if Thursday’s inflation data turns out to be disappointing.
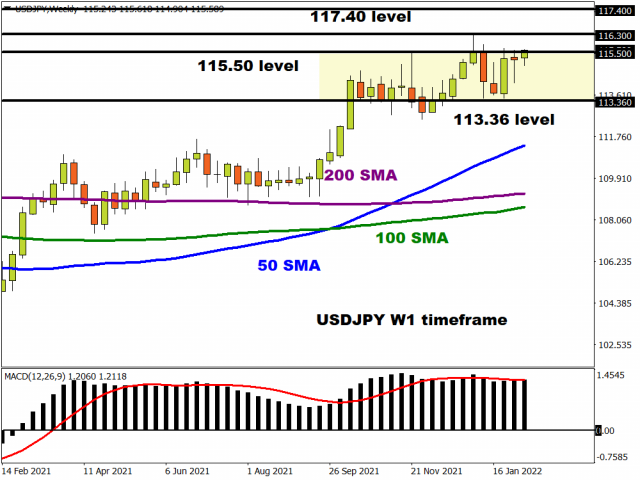
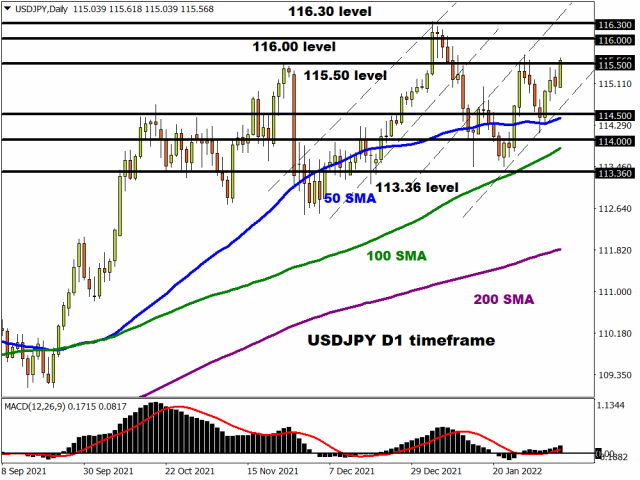
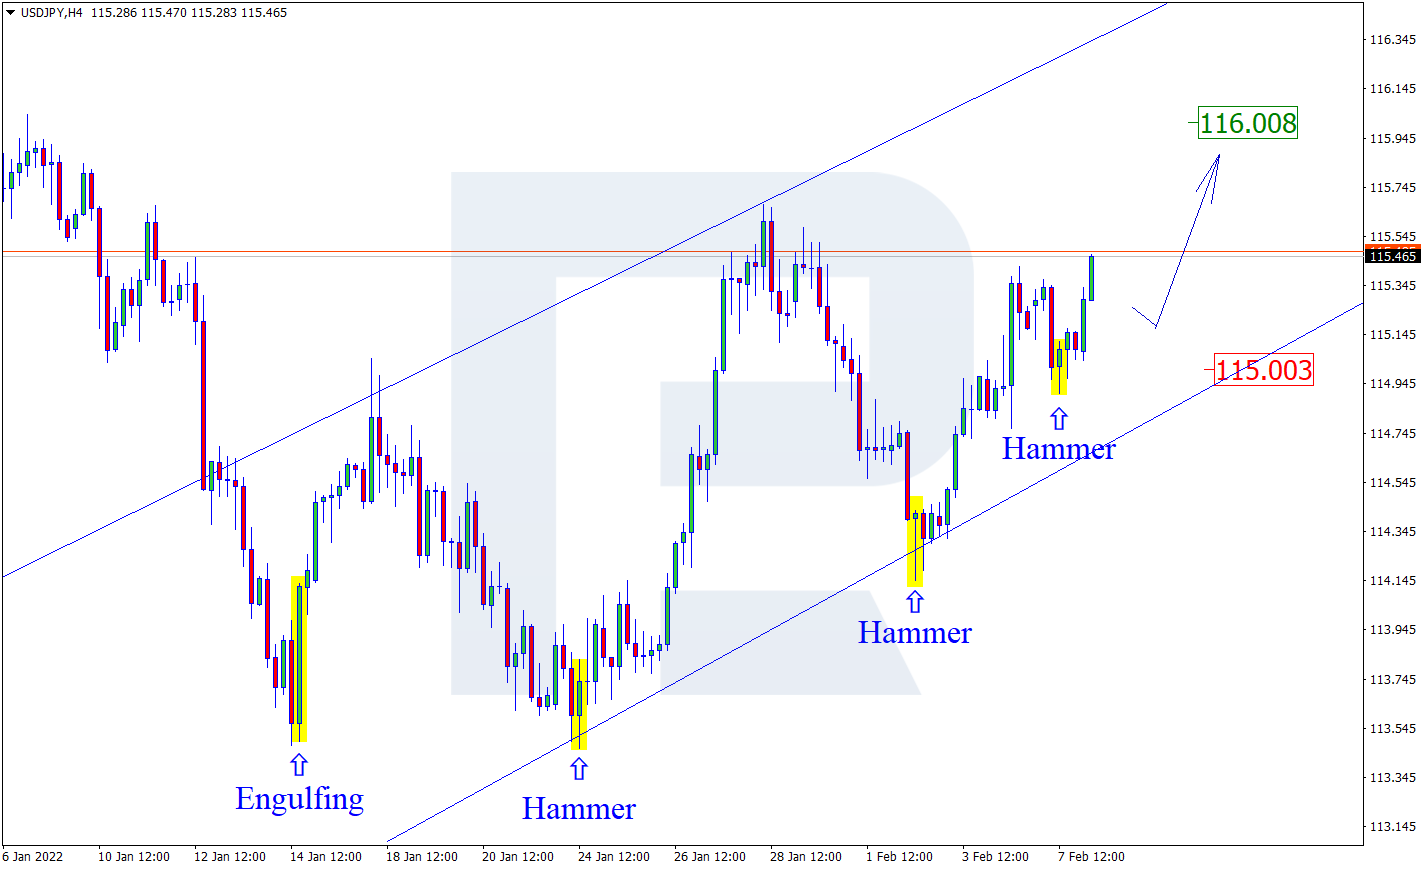
- Support levels: 115.15, 114.96, 114.76
- Resistance levels: 115.73, 116.08
The global trend on the USD/JPY currency pair is bullish. The Japanese yen keeps getting cheaper amid the rising dollar index and due to the ultra-soft monetary policy of the Bank of Japan. Under such market conditions, it is best to look for buy deals on the lower time frames from the support level of 115.15. Sell potions can be looked for at the nearest resistance levels, but only with short targets and with additional confirmation.
Alternative scenario: if the price fixes below 114.76, the uptrend will likely be broken.

The USD/CAD currency pair
- Prev Open: 1.2666
- Prev Close: 1.2702
- % chg. over the last day: +0.28%
The Canadian dollar is a commodity currency, so it depends not only on the monetary policy of the Bank of Canada but also on the oil prices and the dollar index. Yesterday, the Canadian dollar slightly decreased against the US dollar, as oil prices have dropped below $90. The pressure on oil prices is now getting stronger against the background of renewed negotiations between Iran and the USA to ease sanctions, which might lead to the growth in the supply of Iranian oil to the world market.
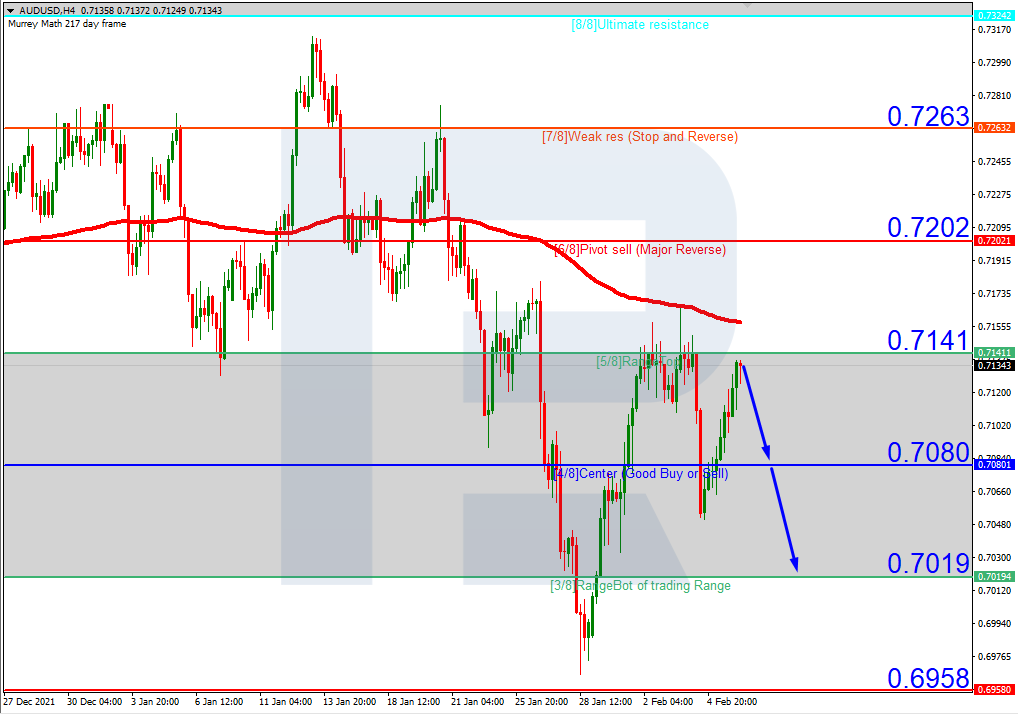
- Support levels: 1.2649, 1.2586, 1.2506
- Resistance levels: 1.2729, 1.2792
From a technical point of view, the USD/CAD currency pair is bullish. The upward movement was not able to continue. A wider flat began to form. Under such market conditions, it is better to look for buy trades on the lower time frames from the support levels of 1.2649. There are no optimal entry points to sell deals now.
Alternative scenario: if the price breaks through the 1.2649 support level and fixes below, the downtrend is likely to resume.

- – US Crude Oil Reserves (w/w) at 17:30 (GMT+2);
- – Canada BoC Gov Macklem’s Speech at 19:00 (GMT+2).
by JustForex
This article reflects a personal opinion and should not be interpreted as an investment advice, and/or offer, and/or a persistent request for carrying out financial transactions, and/or a guarantee, and/or a forecast of future events.