Archive for Forex and Currency News – Page 165

Fibonacci Retracements Analysis 14.02.2022 (GOLD, USDCHF)

Article By RoboForex.com

XAUUSD, “Gold vs US Dollar”

As we can see in the H4 chart, after breaking the previous high, the asset continues trading upwards. In the future, the pair may reach and break the long-term 61.8% fibo at 1908.00. At the moment, XAUUSD is testing 50.0% fibo.

GOLD_H4
Risk Warning: the result of previous trading operations do not guarantee the same results in the future

The H1 chart shows that after finishing the mid-term correction, the pair is moving to the upside; it has already broken 61.8% fibo and is now approaching the local high at 1877.09. The support is the low at 1752.50.

GOLD_H1
Risk Warning: the result of previous trading operations do not guarantee the same results in the future

USDCHF, “US Dollar vs Swiss Franc”

As we can see in the H4 chart, USDCHF is consolidating between 50.0% and 76.0% fibo. The current technical picture implies a further uptrend, the key upside target is the high at 0.93745. If the price breaks it, the instrument may continue growing towards the post-correctional extension area between 138.2% and 161.8% fibo at 0.9482 and 0.9548 respectively. The support is at 0.9092.

USDCHF_H4
Risk Warning: the result of previous trading operations do not guarantee the same results in the future

In the H1 chart, the pair is correcting upwards; it has already tested 61.8% fibo twice and may later continue to reach 76.0% fibo and the local high at 0.9303 and 0.9343 respectively. The local support is the low at 0.9177.

USDCHF_H1

Article By RoboForex.com

Attention!
Forecasts presented in this section only reflect the author’s private opinion and should not be considered as guidance for trading. RoboForex LP bears no responsibility for trading results based on trading recommendations described in these analytical reviews.

The Analytical Overview of the Main Currency Pairs on 2022.02.14

by JustForex

The EUR/USD currency pair

Technical indicators of the currency pair:
  • Prev Open: 1.1425
  • Prev Close: 1.1347
  • % chg. over the last day: -0.68%

The European currency may fall sharply soon because, in addition to the growth of the dollar due to the aggravated situation in Eastern Europe, the dollar index will also receive support from the Fed amid rising inflation in the United States. Investors expect the Fed to act more aggressively in monetary policy. The probability of raising interest rates immediately by 0.5% at the Fed meeting in March increased to 90%. Meanwhile, some Fed officials are already pushing for quantitative tightening for the Fed to cut its balance sheet, which hit a new record last week.

Trading recommendations
  • Support levels: 1.1329, 1.1275
  • Resistance levels: 1.1392, 1.1423, 1.1481, 1.1534, 1.1617

From the technical point of view, the EUR/USD on the hourly time frame is bullish. But on Friday, the price decreased sharply to the priority change level. The MACD indicator is negative, the selling pressure remains. Under such market conditions, buy trades should be looked at from the priority change level of 1.1329. Sell trades are better to look for on intraday time frames from the resistance level of 1.1392.

Alternative scenario: if the price breaks out through the 1.1329 support level and fixes below, the mid-term uptrend will likely be broken.

EUR/USD
News feed for 2022.02.14:
  • – US FOMC Member Bullard Speaks at 18:00 (GMT+2);
  • – Eurozone ECB President Lagarde Speaks at 18:15 (GMT+2).

The GBP/USD currency pair

Technical indicators of the currency pair:
  • Prev Open: 1.3554
  • Prev Close: 1.3554
  • % chg. over the last day: 0.0%

UK GDP has grown by 1% over the past three months. The UK economy grew by 7.5% over the previous year, the fastest growth since 1941. On Friday, industrial production statistics showed an increase of 0.2-0.3%. The British pound is now more stable than the euro, as the Bank of England raised interest rates twice.

Trading recommendations
  • Support levels: 1.3533, 1.3475, 1.3457, 1.3434
  • Resistance levels: 1.3594, 1.3639, 1.3662

Against the background of the dollar index growth on Friday, the GBP/USD quotes declined, but the price is still trading in a wide corridor. Under such market conditions, buy trades should be looked at from the support level 1.3475 or 1.3533. The resistance level of 1.3594 may be considered for opening sell deals, but only with additional confirmation in the form of sellers’ initiative.

Alternative scenario: if the price breaks out through the 1.3475 support level and consolidates below, the bullish scenario will be broken.

GBP/USD
There is no news feed for today.

The USD/JPY currency pair

Technical indicators of the currency pair:
  • Prev Open: 116.04
  • Prev Close: 115.41
  • % chg. over the last day: -0.54%

The monetary policy of the Bank of Japan is now aimed at making the Japanese yen cheaper because of the maximum stimulus. At the same time, the Fed plans to tighten its monetary policy aggressively. Such opposite policies of central banks contribute to the growth of USD/JPY quotes. However, it should be noted that the Japanese yen is considered a safe-haven currency in case of panic in the market. Investors began to buy JPY, which resulted in a temporary decline in USD/JPY quotes due to a sharply deteriorating situation in Eastern Europe.

Trading recommendations
  • Support levels: 115.15, 114.76
  • Resistance levels: 115.85, 116.12, 116.50

The global trend on the USD/JPY currency pair is bullish. On Friday, the price reached the priority change level, but buyers managed to protect their positions. The MACD indicator became negative. Under such market conditions, it is best to look for buy deals on the lower time frames from the support level of 115.15, but with an additional confirmation, as the price has already tested this level. Sell positions can be looked at from the resistance level 115.85, but only with short targets and additional confirmation.

Alternative scenario: if the price fixes below 115.15, the uptrend will likely be broken.

USD/JPY
There is no news feed for today.

The USD/CAD currency pair

Technical indicators of the currency pair:
  • Prev Open: 1.2719
  • Prev Close: 1.2735
  • % chg. over the last day: +0.12%

The Canadian dollar is a commodity currency, so it depends not only on the monetary policy of the Bank of Canada but also on the oil prices and the dollar index. The sharp increase in the dollar index after negative news from Eastern Europe led to a temporary decline in the USD/CAD quotes on Friday. However, oil prices increased sharply on Monday morning, which boosted the Canadian dollar. As a result, the USD/CAD currency pair is trading in a wide corridor, and both currencies now have fundamental support.

Trading recommendations
  • Support levels: 1.2685, 1.2649, 1.2600, 1.2506
  • Resistance levels: 1.2752, 1.2792

From a technical point of view, the USD/CAD currency pair is bullish. The price is in a wide flat with high volatility. It is worth trading only with short targets, as both oil and the dollar index are inclined to grow now. Under such market conditions, it is better to look for buy trades on the lower time frames from the support level of 1.2685. For sell deals, it is better to consider the resistance level of 1.2792, but with an additional confirmation in the form of an initiative of sellers.

Alternative scenario: if the price breaks through the 1.2649 support level and fixes below, the downtrend will likely resume.

USD/CAD
There is no news feed for today.

by JustForex


This article reflects a personal opinion and should not be interpreted as an investment advice, and/or offer, and/or a persistent request for carrying out financial transactions, and/or a guarantee, and/or a forecast of future events.

Growing geopolitical tensions in eastern Ukraine cause market panic

by JustForex

The US stock indices closed in the red zone on Friday. By the close of the stocks market Dow Jones (US30) decreased by 1.43% (-1.05% for the week), S&P 500 (US500) fell by 1.90% (-1.93% for the week), NASDAQ technology index (US100) lost 2.58%, becoming the worst performer of the week (-2.32%) among the US indices. All three major indices closed the week with losses.

The Fed’s balance sheet hit a new record high of $8,878 billion. Total assets increased by another $4.8 billion. Investors expect the Fed to act more aggressively in monetary policy. The probability of an immediate 0.5% interest rate hike at the Fed’s March meeting increased to 90%. In addition, some Fed officials are already advocating quantitative tightening for the Fed to lower the balance sheet. Goldman Sachs has lowered its S&P 500 target at the end of 2022 to 4,900 from 5,100 due to rising rates and lower valuations.

Growing geopolitical tensions in eastern Ukraine and record inflation in the US are causing panic in financial markets. Russian President Vladimir Putin and US President Joe Biden spoke by phone on Saturday in an attempt to de-escalate the crisis. The White House said Biden “made it clear that if Russia undertakes any further invasion of Ukraine, the United States, along with allies and partners, would respond decisively and strike Russia swiftly and seriously.” Many analysts believe that in the event of an invasion, energy prices are expected to surge, which could send the price of oil above the $100 per barrel threshold for the first time since 2014. Beyond oil, Russia’s role as a key supplier of natural gas to Western Europe could spike prices in the region. Overall, analysts say a sharp rise in energy prices in Europe and worldwide would be the most likely way a Russian invasion would cause volatility in financial markets.

The Foreign Ministries of more than 20 countries have warned their citizens to leave Ukraine as soon as possible. The Embassy of Canada in Kyiv has temporarily suspended work and is moving its office to western Ukraine. Australia is evacuating its ambassadors from Ukraine. The Dutch airline KLM has temporarily suspended flights to Ukraine, while Lufthansa is considering doing the same.

Ukraine may abandon its application to join NATO in order to avoid a war with Russia, Ukraine’s ambassador to the UK, Vadym Prystayko, said on BBC Radio 5.

The US is whipping up hysteria around a “war” with Russia to stop Nord Stream 2, David Hendrickson, professor of political science at Colorado College, wrote in an article titled “Why Washington Is Crazy About Ukraine,” published in the National Interest magazine.

European stock indices also closed Friday in the red zone amid rising geopolitical tensions in Eastern Europe. German DAX (DE30) decreased by 0.42% (+1.35% for the week), French CAC 40 (FR40) fell by 1.27% (+0.35% for the week), Spanish IBEX 35 (ES35) lost 0.99% (+1.73% for the week), British FTSE 100 (UK100) fell by 0.15% on Friday, but ended the week with growth +1.92% and was the gain leader among European indices.

Gold prices rose nearly 3%, and silver added 5% last week, as fears of geopolitical tensions in Ukraine boosted demand for metals as a safe-haven asset. Betting that inflation will remain high also boosted gold prices.

Asian markets traded flat on Friday. Japan’s Nikkei 225 (JP225) increased by 0.42% (+2.22% for the week), Australia’s S&P/ASX 200 (AU200) lost 0.98% (+1.36% for the week), and Hong Kong’s Hang Seng (HK50) decreased by 0.07% (+1.21% for the week).

According to The Korea Times analysts, NVIDIA’s final refusal to buy the British chipmaker Arm due to the concerns of regulators around the world and the dissatisfaction of major market players will hurt Samsung Electronics’ plans to expand its semiconductor business through the acquisition of smaller companies. At the same time, experts do not exclude the possible pressure of the failed deal on the entire industry.

At the commodities market, futures on lumber (+13.94%), silver (+5.01%), corn (+4.75%), coffee (+4.65%), wheat (+4.59%), cocoa (+3.16%), and gold (+2.92%) showed the biggest gains by the end of the week. Natural gas futures (-12.51%) and orange juice futures (-1.62%) showed the biggest drop.

Main market quotes:

S&P 500 (F) (US500) 4,418.64 -85.44 (-1.90%)

Dow Jones (US30) 34,738.06 -503.53 (-1.43%)

DAX (DE40) 15,425.12 -65.32 (-0.42%)

FTSE 100 (UK100) 7,661.02 -11.38 (-0.15%)

USD Index 96.03 +0.48 (+0.50%)

Important events for today:
  • – Switzerland Producer Price Index (m/m) at 09:30 (GMT+2);
  • – US FOMC Member Bullard Speaks at 18:00 (GMT+2);
  • – Eurozone ECB President Lagarde Speaks at 18:15 (GMT+2).

by JustForex


This article reflects a personal opinion and should not be interpreted as an investment advice, and/or offer, and/or a persistent request for carrying out financial transactions, and/or a guarantee, and/or a forecast of future events.

EUR/USD Consolidates in Mid-February

By Dmitriy Gurkovskiy, Chief Analyst at RoboForex

The major currency pair is consolidating in mid-February. On Monday, 14 February 2022, the asset is trading at 1.1340.

Investors are still impressed by the January inflation data from the US. The CPI showed 7.5% y/y – the reading no one has seen in over 40 years. Inflation higher than expected gives the US Fed the ground to raise the rate and reduce its own balance quickly and without any limitations.

On Monday, the Fed is planning to have a meeting and discuss the reserve rate and other aspects. However, the regulator is not expected to discuss the benchmark rate so far.

The thing that intrigues market players the most is the number of rate hikes in 2022. As of now, consensus projections suggest from 4 to 6.

In the H4 chart, having finished another descending wave at 1.1316, EUR/USD is expected to start a new correction towards 1.1370. After that, the instrument may resume falling to reach 1.1280 or even extend this wave down to 1.1255. From the technical point of view, this scenario is confirmed by MACD Oscillator: its signal line is falling below 0 and may continue moving towards new lows.

eurusd chart

As we can see in the H1 chart, after rebounding from 1.1417, EUR/USD is forming the second descending structure to break 1.1316 and may later correct towards 1.1370. After that, the instrument may resume falling with the target at 1.1310 or even extend this structure down to 1.1255. From the technical point of view, this idea is confirmed by the Stochastic Oscillator: its signal line is moving above 20 and may continue growling to reach 50. Later, the line may rebound from 50 and resume falling to reach 20.

euro us dollar 1 hour forex currency chart

Disclaimer

Any forecasts contained herein are based on the author’s particular opinion. This analysis may not be treated as trading advice. RoboForex bears no responsibility for trading results based on trading recommendations and reviews contained herein.

COT Currency Speculator’s bullish bets for Brazilian Real jump by most on record

By InvestMacro | COT | Data Tables | COT Leaders | Downloads | COT Newsletter

Here are the latest charts and statistics for the Commitment of Traders (COT) data published by the Commodities Futures Trading Commission (CFTC).

The latest COT data is updated through Tuesday February 8th and shows a quick view of how large traders (for-profit speculators and commercial entities) were positioned in the futures markets. All currency positions are in direct relation to the US dollar where, for example, a bet for the euro is a bet that the euro will rise versus the dollar while a bet against the euro will be a bet that the euro will decline versus the dollar.

Highlighting the COT currency data was the strong gains in bullish bets for the Brazilian Real currency futures contracts. Real speculators boosted their bullish bets this week by the largest one-week amount (+33,599 contracts) on record, according the CFTC data going back to 1995. This surge in bullish sentiment pushed the overall net speculator standing for Brazilian Reals into bullish territory for the first time in nineteen weeks, dating back to September 28th.

There has been a surge of trading going on in this market over the past couple of weeks with open interest increasing dramatically. Open interest (OI) for the Brazilian currency jumped on February 2nd to a total of 76,175 contracts which marked the highest OI level of the previous 381 weeks, dating all the way back to September of 2014. The previous ten weeks had seen an average open interest of less than half (ten week average of 33,492 contracts) of the February 2nd total. This week’s open interest fell a bit to 64,283 contracts but still was the second highest open interest of the past thirty-six weeks and with all this activity going on, this is a currency to watch.

Joining the Brazil real (33,599 contracts) with positive changes this week were the Euro (9,126 contracts), Japanese yen (1,492 contracts), British pound sterling (15,060 contracts), New Zealand dollar (1,332 contracts), Mexican peso (514 contracts) and the Russian ruble (1,292 contracts).

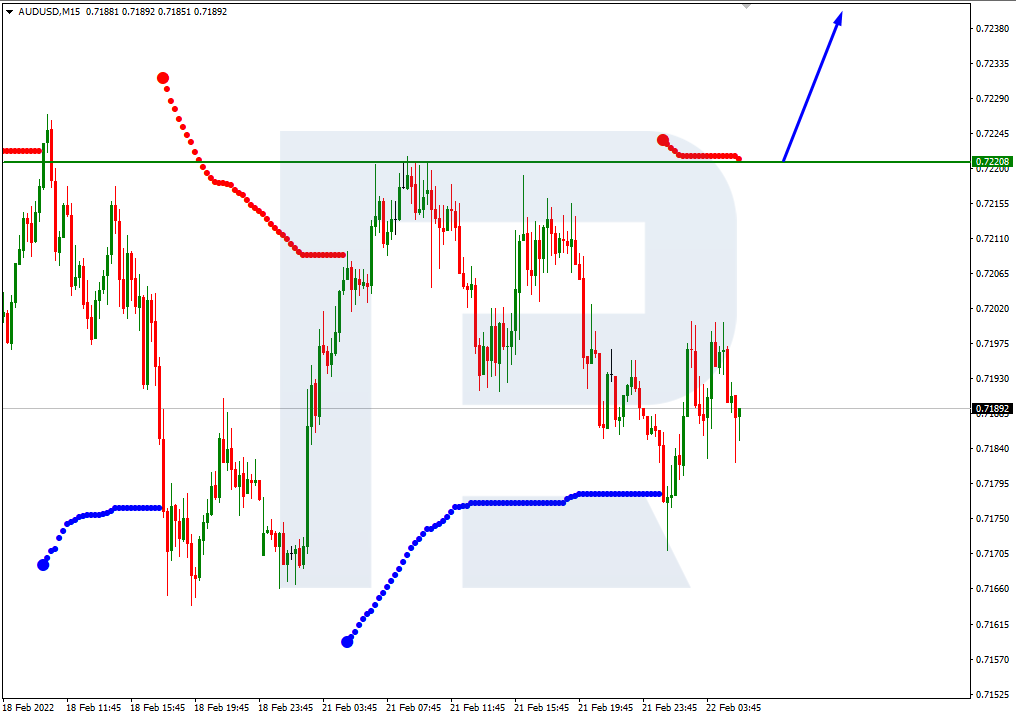
The currencies with declining bets were the US Dollar Index (-806 contracts), Australian dollar (-5,912 contracts), Canadian dollar (-3,378 contracts), Swiss franc (-1,160 contracts) and the Bitcoin futures (-460 contracts).


Data Snapshot of Forex Market Traders | Columns Legend
Feb-08-2022OIOI-IndexSpec-NetSpec-IndexCom-NetCOM-IndexSmalls-NetSmalls-Index
USD Index53,6037533,76584-40,82677,06194
EUR700,0988338,84247-73,2525534,41031
GBP197,94837-8,545689,32335-77854
JPY196,47853-59,1483175,95774-16,80913
CHF41,48116-9,3995416,91850-7,51941
CAD145,2082714,88662-16,958452,07234
AUD196,40380-85,741598,35792-12,61622
NZD54,87753-10,3665412,73350-2,36725
MXN134,257191,24428-4,073712,82955
RUB39,2333515,44350-16,839471,39672
BRL64,2838120,24696-22,43242,18692
Bitcoin9,88650-31990-189050824


US Dollar Index Futures:

US Dollar Index Forex Futures COT Chart
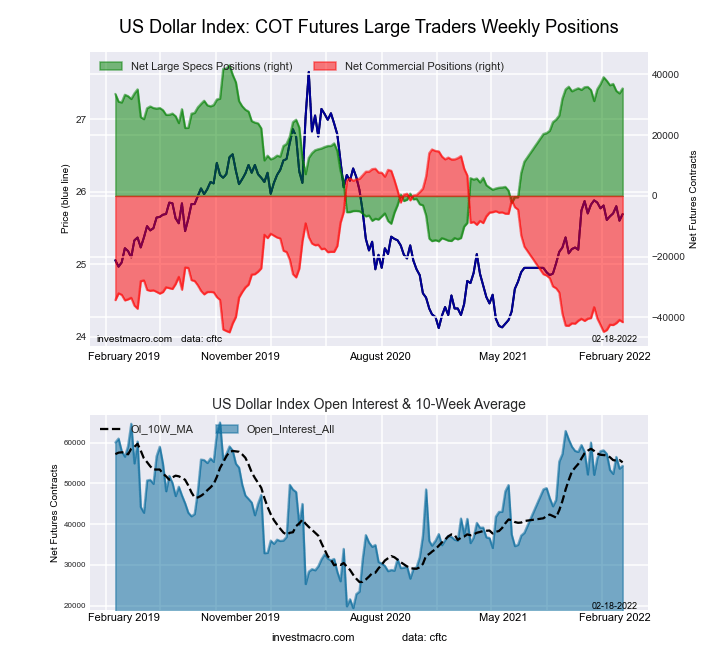
The US Dollar Index large speculator standing this week was a net position of 33,765 contracts in the data reported through Tuesday. This was a weekly fall of -806 contracts from the previous week which had a total of 34,571 net contracts.

This week’s current strength score (the trader positioning range over the past three years, measured from 0 to 100) shows the speculators are currently Bullish-Extreme with a score of 84.0 percent. The commercials are Bearish-Extreme with a score of 6.8 percent and the small traders (not shown in chart) are Bullish-Extreme with a score of 93.8 percent.

US DOLLAR INDEX StatisticsSPECULATORSCOMMERCIALSSMALL TRADERS
– Percent of Open Interest Longs:75.35.916.5
– Percent of Open Interest Shorts:12.382.03.3
– Net Position:33,765-40,8267,061
– Gross Longs:40,3703,1508,841
– Gross Shorts:6,60543,9761,780
– Long to Short Ratio:6.1 to 10.1 to 15.0 to 1
NET POSITION TREND:
– Strength Index Score (3 Year Range Pct):84.06.893.8
– Strength Index Reading (3 Year Range):Bullish-ExtremeBearish-ExtremeBullish-Extreme
NET POSITION MOVEMENT INDEX:
– 6-Week Change in Strength Index:-5.22.715.2


Euro Currency Futures:

Euro Currency Futures COT Chart
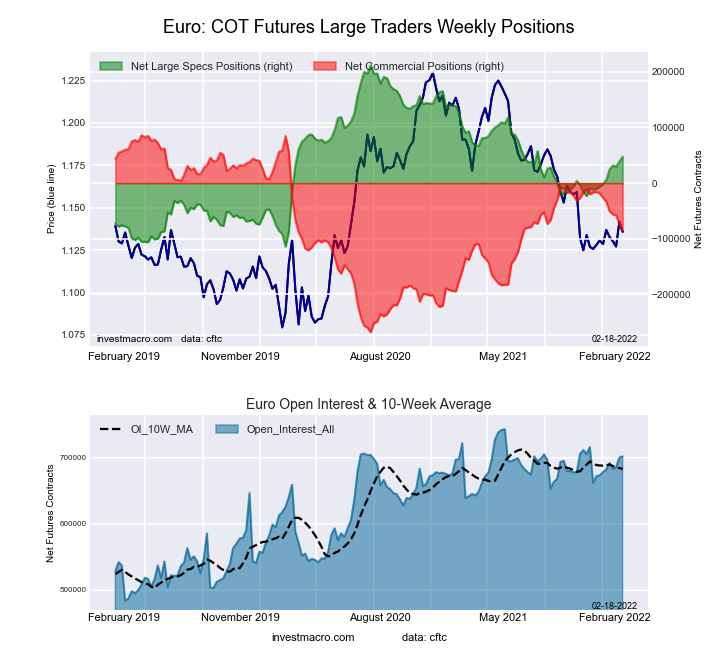
The Euro Currency large speculator standing this week was a net position of 38,842 contracts in the data reported through Tuesday. This was a weekly increase of 9,126 contracts from the previous week which had a total of 29,716 net contracts.

This week’s current strength score (the trader positioning range over the past three years, measured from 0 to 100) shows the speculators are currently Bearish with a score of 46.9 percent. The commercials are Bullish with a score of 55.0 percent and the small traders (not shown in chart) are Bearish with a score of 31.4 percent.

EURO Currency StatisticsSPECULATORSCOMMERCIALSSMALL TRADERS
– Percent of Open Interest Longs:31.354.612.5
– Percent of Open Interest Shorts:25.765.17.6
– Net Position:38,842-73,25234,410
– Gross Longs:218,973382,42687,725
– Gross Shorts:180,131455,67853,315
– Long to Short Ratio:1.2 to 10.8 to 11.6 to 1
NET POSITION TREND:
– Strength Index Score (3 Year Range Pct):46.955.031.4
– Strength Index Reading (3 Year Range):BearishBullishBearish
NET POSITION MOVEMENT INDEX:
– 6-Week Change in Strength Index:14.0-15.515.3


British Pound Sterling Futures:

British Pound Sterling Futures COT Chart
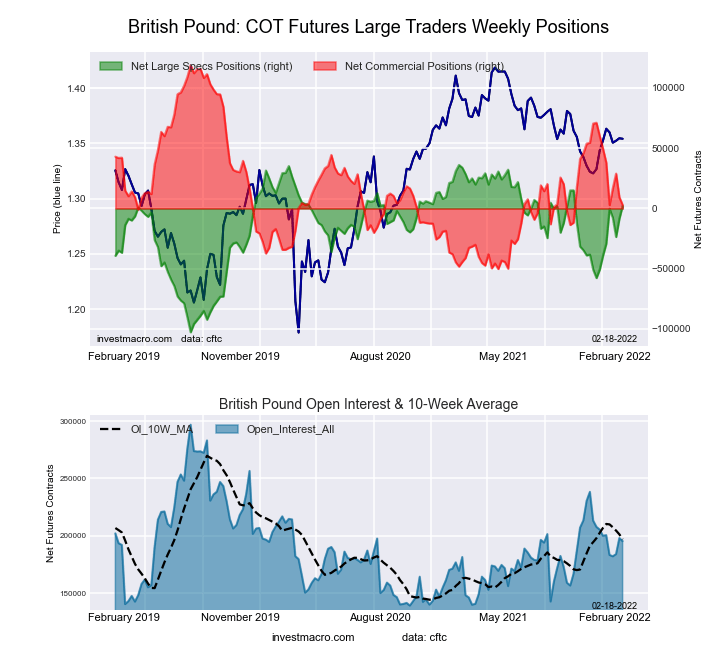
The British Pound Sterling large speculator standing this week was a net position of -8,545 contracts in the data reported through Tuesday. This was a weekly gain of 15,060 contracts from the previous week which had a total of -23,605 net contracts.

This week’s current strength score (the trader positioning range over the past three years, measured from 0 to 100) shows the speculators are currently Bullish with a score of 67.8 percent. The commercials are Bearish with a score of 35.2 percent and the small traders (not shown in chart) are Bullish with a score of 54.0 percent.

BRITISH POUND StatisticsSPECULATORSCOMMERCIALSSMALL TRADERS
– Percent of Open Interest Longs:22.660.713.6
– Percent of Open Interest Shorts:26.956.014.0
– Net Position:-8,5459,323-778
– Gross Longs:44,709120,22026,951
– Gross Shorts:53,254110,89727,729
– Long to Short Ratio:0.8 to 11.1 to 11.0 to 1
NET POSITION TREND:
– Strength Index Score (3 Year Range Pct):67.835.254.0
– Strength Index Reading (3 Year Range):BullishBearishBullish
NET POSITION MOVEMENT INDEX:
– 6-Week Change in Strength Index:30.4-30.017.8


Japanese Yen Futures:

Japanese Yen Forex Futures COT Chart
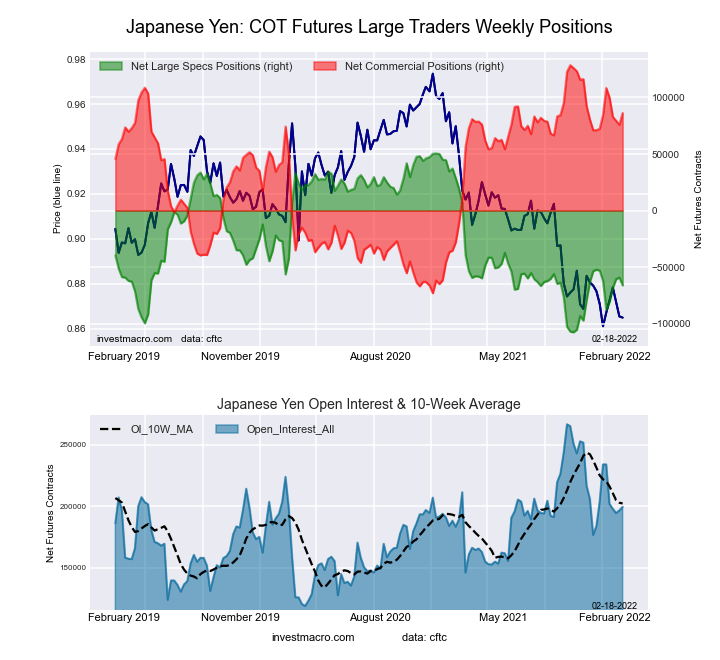
The Japanese Yen large speculator standing this week was a net position of -59,148 contracts in the data reported through Tuesday. This was a weekly boost of 1,492 contracts from the previous week which had a total of -60,640 net contracts.

This week’s current strength score (the trader positioning range over the past three years, measured from 0 to 100) shows the speculators are currently Bearish with a score of 30.7 percent. The commercials are Bullish with a score of 73.9 percent and the small traders (not shown in chart) are Bearish-Extreme with a score of 13.5 percent.

JAPANESE YEN StatisticsSPECULATORSCOMMERCIALSSMALL TRADERS
– Percent of Open Interest Longs:8.081.29.0
– Percent of Open Interest Shorts:38.142.617.5
– Net Position:-59,14875,957-16,809
– Gross Longs:15,692159,60117,609
– Gross Shorts:74,84083,64434,418
– Long to Short Ratio:0.2 to 11.9 to 10.5 to 1
NET POSITION TREND:
– Strength Index Score (3 Year Range Pct):30.773.913.5
– Strength Index Reading (3 Year Range):BearishBullishBearish-Extreme
NET POSITION MOVEMENT INDEX:
– 6-Week Change in Strength Index:-3.81.85.3


Swiss Franc Futures:

Swiss Franc Forex Futures COT Chart
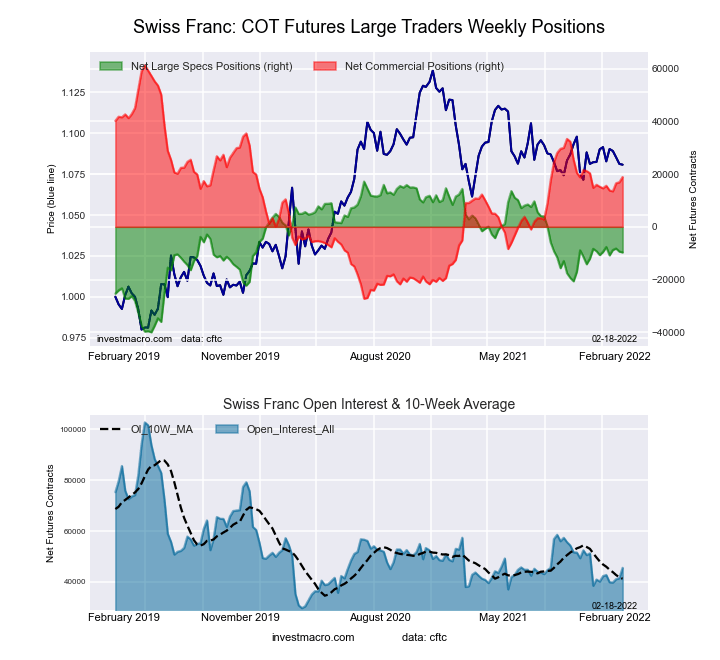
The Swiss Franc large speculator standing this week was a net position of -9,399 contracts in the data reported through Tuesday. This was a weekly decline of -1,160 contracts from the previous week which had a total of -8,239 net contracts.

This week’s current strength score (the trader positioning range over the past three years, measured from 0 to 100) shows the speculators are currently Bullish with a score of 53.5 percent. The commercials are Bearish with a score of 49.9 percent and the small traders (not shown in chart) are Bearish with a score of 41.2 percent.

SWISS FRANC StatisticsSPECULATORSCOMMERCIALSSMALL TRADERS
– Percent of Open Interest Longs:3.072.823.7
– Percent of Open Interest Shorts:25.632.141.8
– Net Position:-9,39916,918-7,519
– Gross Longs:1,23430,2159,838
– Gross Shorts:10,63313,29717,357
– Long to Short Ratio:0.1 to 12.3 to 10.6 to 1
NET POSITION TREND:
– Strength Index Score (3 Year Range Pct):53.549.941.2
– Strength Index Reading (3 Year Range):BullishBearishBearish
NET POSITION MOVEMENT INDEX:
– 6-Week Change in Strength Index:2.31.9-8.8


Canadian Dollar Futures:

Canadian Dollar Forex Futures COT Chart
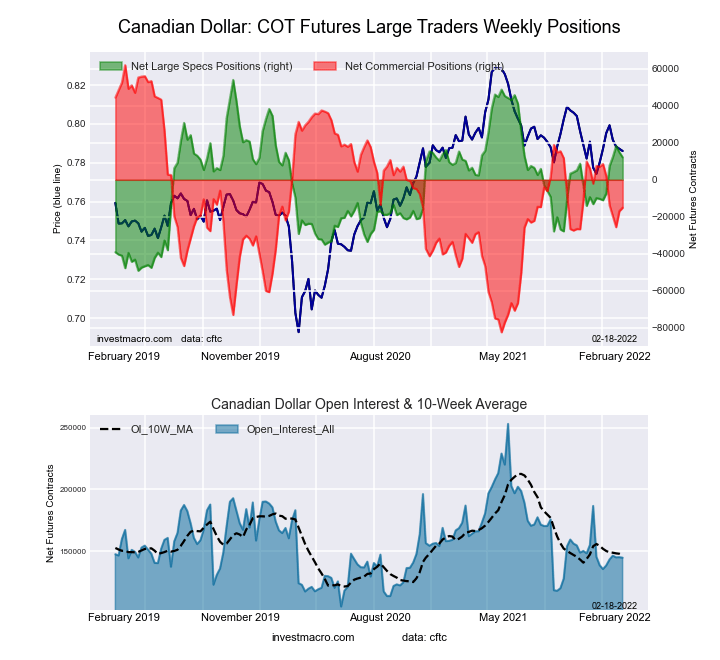
The Canadian Dollar large speculator standing this week was a net position of 14,886 contracts in the data reported through Tuesday. This was a weekly decline of -3,378 contracts from the previous week which had a total of 18,264 net contracts.

This week’s current strength score (the trader positioning range over the past three years, measured from 0 to 100) shows the speculators are currently Bullish with a score of 62.1 percent. The commercials are Bearish with a score of 45.4 percent and the small traders (not shown in chart) are Bearish with a score of 33.9 percent.

CANADIAN DOLLAR StatisticsSPECULATORSCOMMERCIALSSMALL TRADERS
– Percent of Open Interest Longs:37.740.218.9
– Percent of Open Interest Shorts:27.551.917.5
– Net Position:14,886-16,9582,072
– Gross Longs:54,76258,40427,480
– Gross Shorts:39,87675,36225,408
– Long to Short Ratio:1.4 to 10.8 to 11.1 to 1
NET POSITION TREND:
– Strength Index Score (3 Year Range Pct):62.145.433.9
– Strength Index Reading (3 Year Range):BullishBearishBearish
NET POSITION MOVEMENT INDEX:
– 6-Week Change in Strength Index:24.4-16.7-2.2


Australian Dollar Futures:

Australian Dollar Forex Futures COT Chart
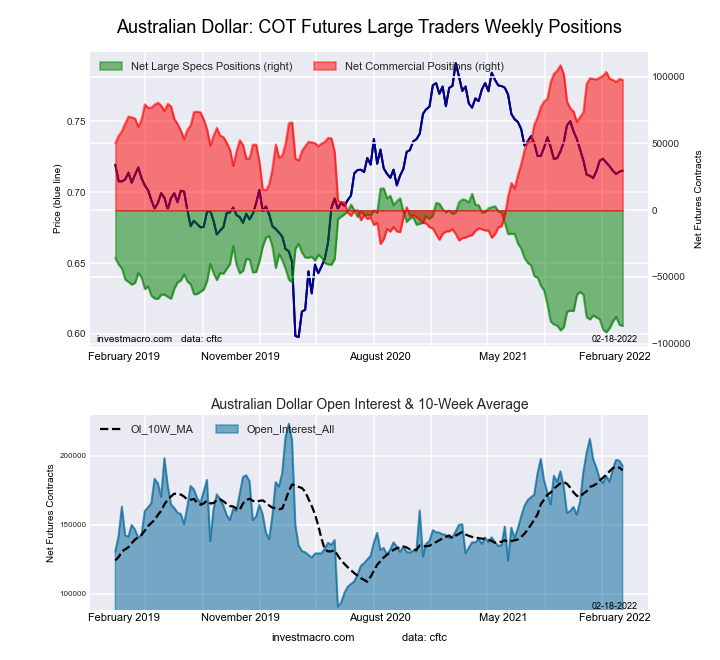
The Australian Dollar large speculator standing this week was a net position of -85,741 contracts in the data reported through Tuesday. This was a weekly reduction of -5,912 contracts from the previous week which had a total of -79,829 net contracts.

This week’s current strength score (the trader positioning range over the past three years, measured from 0 to 100) shows the speculators are currently Bearish-Extreme with a score of 5.3 percent. The commercials are Bullish-Extreme with a score of 92.3 percent and the small traders (not shown in chart) are Bearish with a score of 21.7 percent.

AUSTRALIAN DOLLAR StatisticsSPECULATORSCOMMERCIALSSMALL TRADERS
– Percent of Open Interest Longs:8.879.09.9
– Percent of Open Interest Shorts:52.528.916.3
– Net Position:-85,74198,357-12,616
– Gross Longs:17,323155,20319,485
– Gross Shorts:103,06456,84632,101
– Long to Short Ratio:0.2 to 12.7 to 10.6 to 1
NET POSITION TREND:
– Strength Index Score (3 Year Range Pct):5.392.321.7
– Strength Index Reading (3 Year Range):Bearish-ExtremeBullish-ExtremeBearish
NET POSITION MOVEMENT INDEX:
– 6-Week Change in Strength Index:-3.7-0.812.5


New Zealand Dollar Futures:

New Zealand Dollar Forex Futures COT Chart
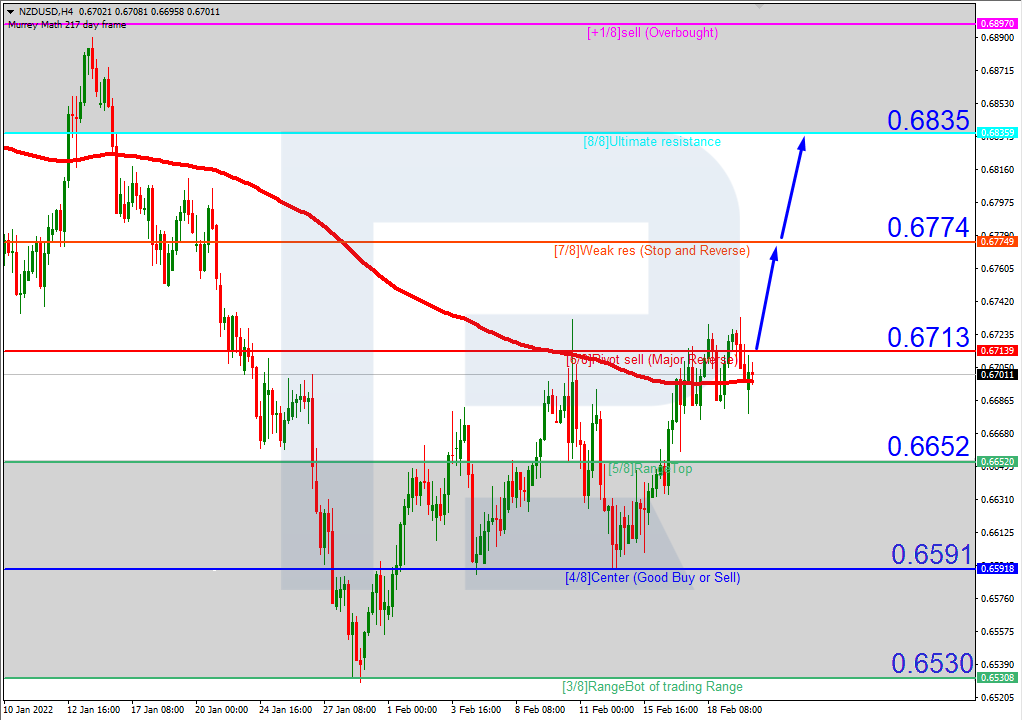
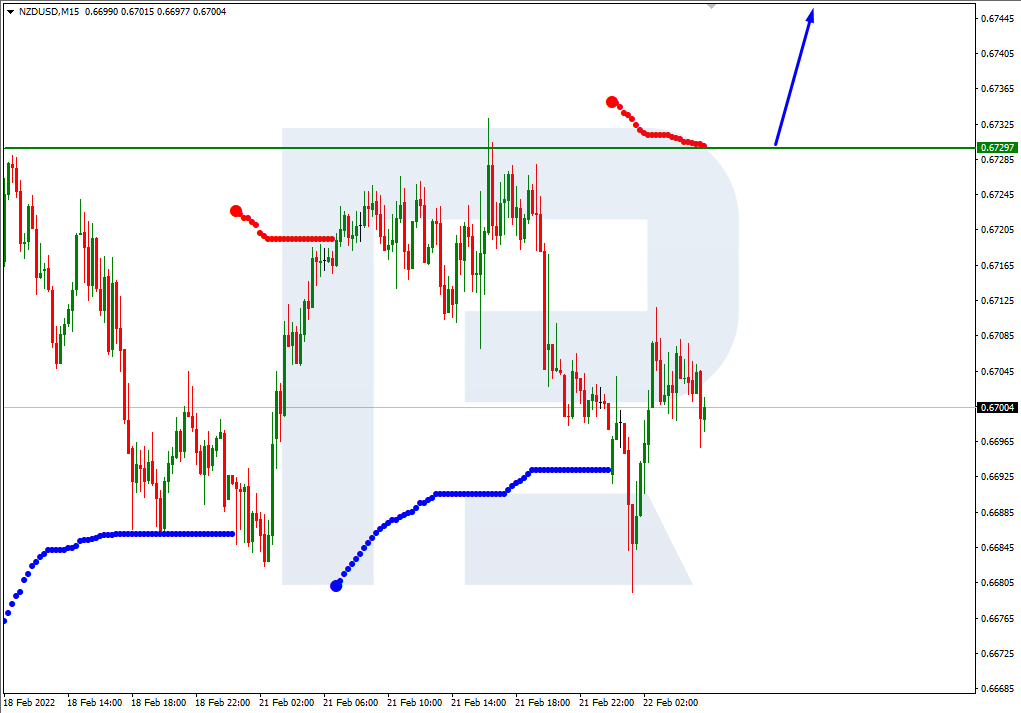
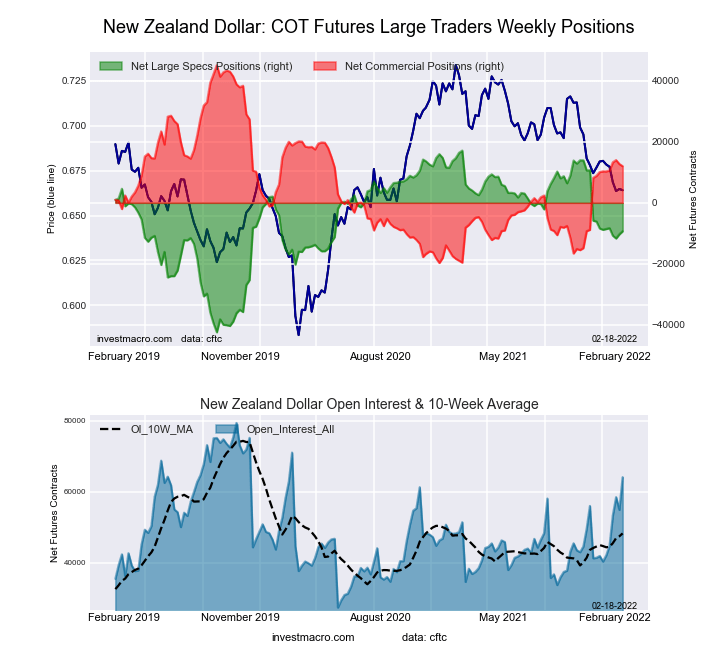
The New Zealand Dollar large speculator standing this week was a net position of -10,366 contracts in the data reported through Tuesday. This was a weekly increase of 1,332 contracts from the previous week which had a total of -11,698 net contracts.

This week’s current strength score (the trader positioning range over the past three years, measured from 0 to 100) shows the speculators are currently Bullish with a score of 53.9 percent. The commercials are Bullish with a score of 50.0 percent and the small traders (not shown in chart) are Bearish with a score of 24.7 percent.

NEW ZEALAND DOLLAR StatisticsSPECULATORSCOMMERCIALSSMALL TRADERS
– Percent of Open Interest Longs:31.361.25.6
– Percent of Open Interest Shorts:50.238.010.0
– Net Position:-10,36612,733-2,367
– Gross Longs:17,16833,5913,097
– Gross Shorts:27,53420,8585,464
– Long to Short Ratio:0.6 to 11.6 to 10.6 to 1
NET POSITION TREND:
– Strength Index Score (3 Year Range Pct):53.950.024.7
– Strength Index Reading (3 Year Range):BullishBullishBearish
NET POSITION MOVEMENT INDEX:
– 6-Week Change in Strength Index:-3.34.1-7.9


Mexican Peso Futures:

Mexican Peso Futures COT Chart
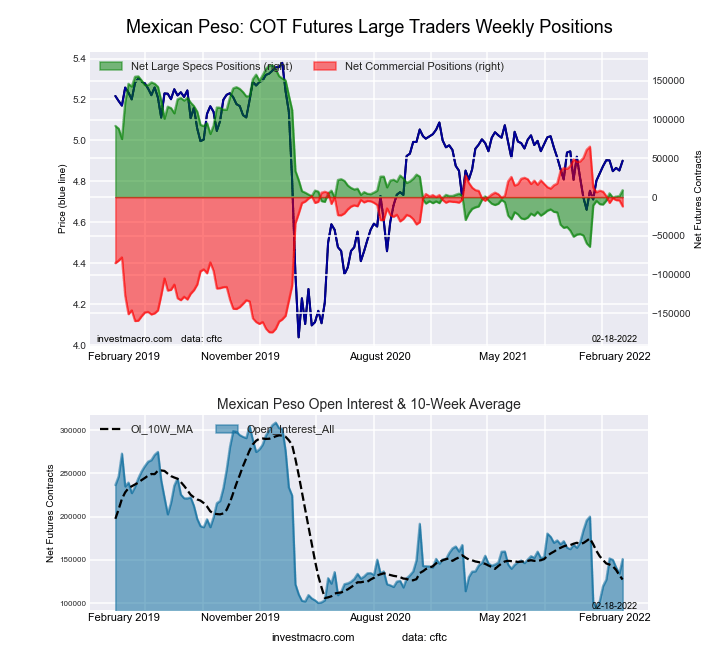
The Mexican Peso large speculator standing this week was a net position of 1,244 contracts in the data reported through Tuesday. This was a weekly gain of 514 contracts from the previous week which had a total of 730 net contracts.

This week’s current strength score (the trader positioning range over the past three years, measured from 0 to 100) shows the speculators are currently Bearish with a score of 27.9 percent. The commercials are Bullish with a score of 71.1 percent and the small traders (not shown in chart) are Bullish with a score of 55.0 percent.

MEXICAN PESO StatisticsSPECULATORSCOMMERCIALSSMALL TRADERS
– Percent of Open Interest Longs:33.661.34.5
– Percent of Open Interest Shorts:32.764.32.4
– Net Position:1,244-4,0732,829
– Gross Longs:45,09782,2876,067
– Gross Shorts:43,85386,3603,238
– Long to Short Ratio:1.0 to 11.0 to 11.9 to 1
NET POSITION TREND:
– Strength Index Score (3 Year Range Pct):27.971.155.0
– Strength Index Reading (3 Year Range):BearishBullishBullish
NET POSITION MOVEMENT INDEX:
– 6-Week Change in Strength Index:4.4-5.29.1


Brazilian Real Futures:

Brazil Real Futures COT Chart
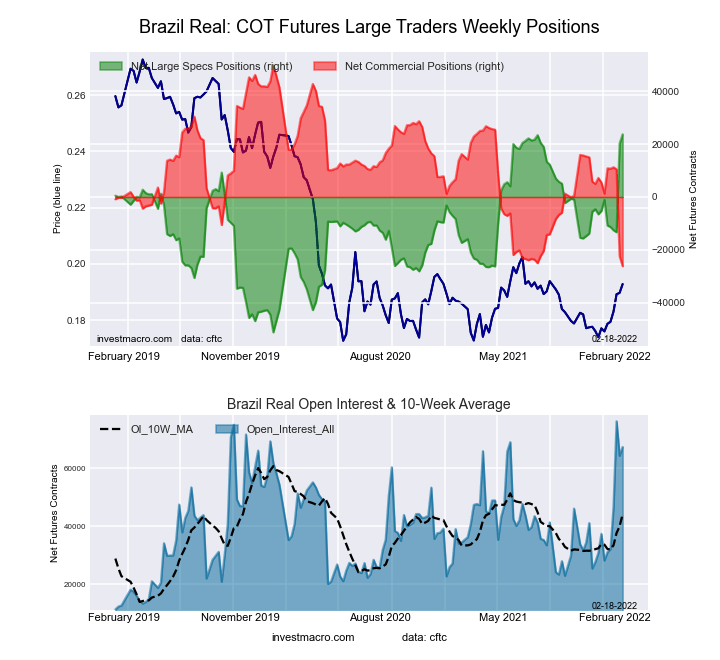
The Brazilian Real large speculator standing this week was a net position of 20,246 contracts in the data reported through Tuesday. This was a weekly rise of 33,599 contracts from the previous week which had a total of -13,353 net contracts.

This week’s current strength score (the trader positioning range over the past three years, measured from 0 to 100) shows the speculators are currently Bullish-Extreme with a score of 95.7 percent. The commercials are Bearish-Extreme with a score of 3.5 percent and the small traders (not shown in chart) are Bullish-Extreme with a score of 91.7 percent.

BRAZIL REAL StatisticsSPECULATORSCOMMERCIALSSMALL TRADERS
– Percent of Open Interest Longs:76.517.65.7
– Percent of Open Interest Shorts:45.052.52.3
– Net Position:20,246-22,4322,186
– Gross Longs:49,17011,3363,666
– Gross Shorts:28,92433,7681,480
– Long to Short Ratio:1.7 to 10.3 to 12.5 to 1
NET POSITION TREND:
– Strength Index Score (3 Year Range Pct):95.73.591.7
– Strength Index Reading (3 Year Range):Bullish-ExtremeBearish-ExtremeBullish-Extreme
NET POSITION MOVEMENT INDEX:
– 6-Week Change in Strength Index:34.2-37.228.4


Russian Ruble Futures:

Russian Ruble Futures COT Chart
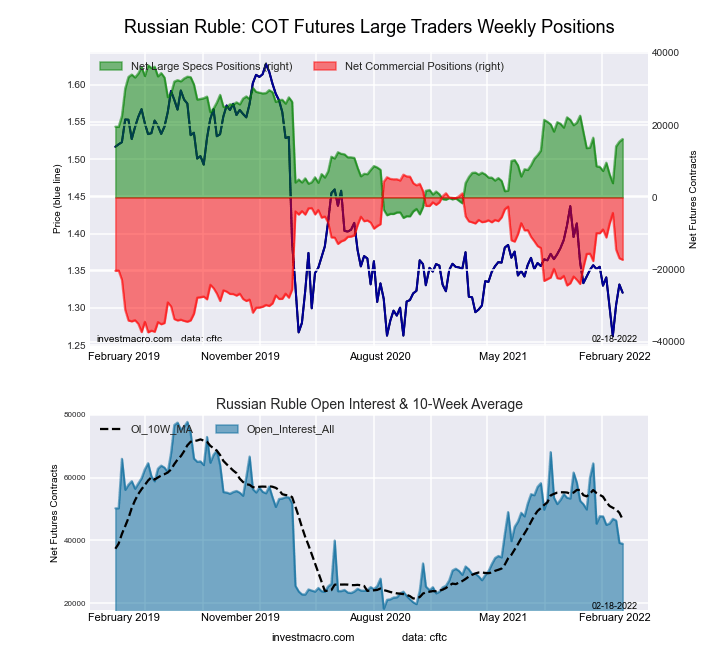
The Russian Ruble large speculator standing this week was a net position of 15,443 contracts in the data reported through Tuesday. This was a weekly boost of 1,292 contracts from the previous week which had a total of 14,151 net contracts.

This week’s current strength score (the trader positioning range over the past three years, measured from 0 to 100) shows the speculators are currently Bearish with a score of 49.9 percent. The commercials are Bearish with a score of 46.9 percent and the small traders (not shown in chart) are Bullish with a score of 72.5 percent.

RUSSIAN RUBLE StatisticsSPECULATORSCOMMERCIALSSMALL TRADERS
– Percent of Open Interest Longs:50.143.46.5
– Percent of Open Interest Shorts:10.786.33.0
– Net Position:15,443-16,8391,396
– Gross Longs:19,65717,0212,555
– Gross Shorts:4,21433,8601,159
– Long to Short Ratio:4.7 to 10.5 to 12.2 to 1
NET POSITION TREND:
– Strength Index Score (3 Year Range Pct):49.946.972.5
– Strength Index Reading (3 Year Range):BearishBearishBullish
NET POSITION MOVEMENT INDEX:
– 6-Week Change in Strength Index:16.5-15.9-0.7


Bitcoin Futures:

Bitcoin Crypto Futures COT Chart
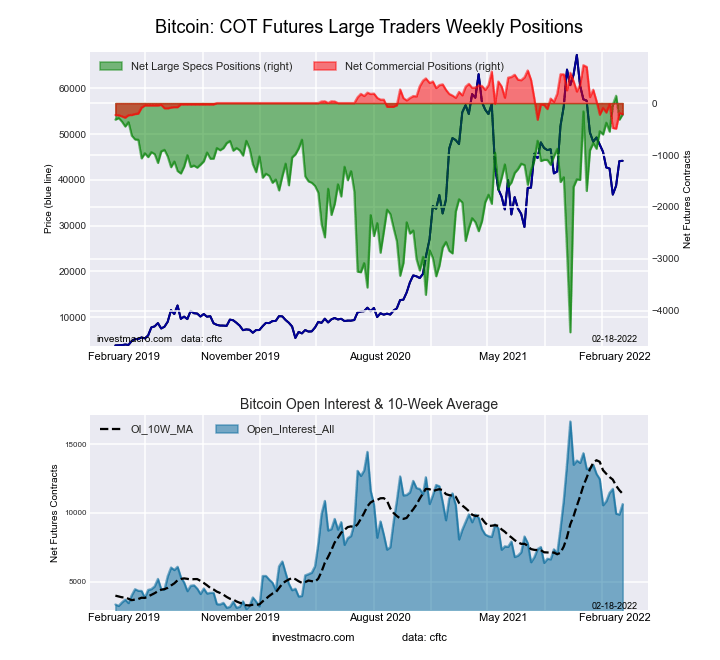
The Bitcoin large speculator standing this week was a net position of -319 contracts in the data reported through Tuesday. This was a weekly reduction of -460 contracts from the previous week which had a total of 141 net contracts.

This week’s current strength score (the trader positioning range over the past three years, measured from 0 to 100) shows the speculators are currently Bullish-Extreme with a score of 89.9 percent. The commercials are Bearish with a score of 24.8 percent and the small traders (not shown in chart) are Bearish with a score of 24.5 percent.

BITCOIN StatisticsSPECULATORSCOMMERCIALSSMALL TRADERS
– Percent of Open Interest Longs:78.43.814.9
– Percent of Open Interest Shorts:81.65.79.8
– Net Position:-319-189508
– Gross Longs:7,7513761,474
– Gross Shorts:8,070565966
– Long to Short Ratio:1.0 to 10.7 to 11.5 to 1
NET POSITION TREND:
– Strength Index Score (3 Year Range Pct):89.924.824.5
– Strength Index Reading (3 Year Range):Bullish-ExtremeBearishBearish
NET POSITION MOVEMENT INDEX:
– 6-Week Change in Strength Index:4.92.9-5.9


Article By InvestMacroReceive our weekly COT Reports by Email

*COT Report: The COT data, released weekly to the public each Friday, is updated through the most recent Tuesday (data is 3 days old) and shows a quick view of how large speculators or non-commercials (for-profit traders) were positioned in the futures markets.

The CFTC categorizes trader positions according to commercial hedgers (traders who use futures contracts for hedging as part of the business), non-commercials (large traders who speculate to realize trading profits) and nonreportable traders (usually small traders/speculators) as well as their open interest (contracts open in the market at time of reporting).See CFTC criteria here.

USDCAD Final Zigzag [Z] Heading To 1.296

By Orbex

USDCAD

The current USDCAD structure indicates the formation of a bullish zigzag [Z] consisting of sub-waves (A)-(B)-(C) and being a simple zigzag.

This simple zigzag is located in the last part of the triple three [W]-[X]-[Y]-[X]-[Z]. Wave [Y] has taken the form of a triple zigzag. Wave [X] is a simple bearish zigzag (A)-(B)-(C), which is also fully complete.

The wave (C), which is currently under development, marked with a blue letter, is of the greatest interest at the moment. At the level of 1.296, the entire wave [Z] will be at 76.4% of wave [Y]. So at that level, we can expect the completion of the impulse (C). This is currently under construction.

USDCAD

Alternatively, the development of the primary bearish intervening wave [X] consisting of sub-waves (W)-(X)-(Y) has ended. These sub-waves all together make up a bearish triple zigzag. And within all the active parts are zigzags A-B-C, consisting of minor waves.

(W) and (X) could have fully formed, while (Y) is still under construction. As part of wave (Y), the development of correction B has recently finished. In the short term, market participants can expect a decline in the impulse wave C to the 1.245 area.

The target is determined by the previous minimum, which was formed by the wave (W).


Orbex-LogoArticle by Orbex

Orbex is a fully licensed broker that was established in 2011. Founded with a mission to serve its traders responsibly and provides traders with access to the world’s largest and most liquid financial markets. www.orbex.com

Iron Ore Prices Keep Rising, But What About AUDUSD?

By Orbex

– Yesterday, iron ore prices topped another 6-month high, harkening back to when there was broad speculation of a commodities supercycle.

This came a little ahead of the latest monthly traffic report from Hedland Port, the largest iron ore export port in Australia. It showed that there was a slight drop in exports during January to 48Mt from 50Mt in the prior month. Despite being lower, it is still at the top of the normal range.

The suggestion is that Chinese demand for raw materials, and in particular Australia’s largest export, remains robust. We should remember that last year there was concern that China would be cutting back on its iron ore imports after it cut down on electric smelting in a bid to phase out more polluting energy production.

Export figures show that fear hasn’t been borne out. And prices have been creeping higher as China’s regulators look to support the economy with easier monetary policy.

But that doesn’t mean everyone is happy

Following the news, China’s NDRC – which controls the economy and has plenary power over imports – announced it would enhance inspection tours of the iron ore market. This isn’t entirely surprising, as China has taken similar measures the last time iron ore broke above the $150/ton level.

A slight drop in Australian mining stocks and in the currency followed this move. However, the regulator’s move has not stopped commodity prices from moving significantly higher. And this is supporting the Aussie economy.

What about the Australian dollar?

At current rates, iron ore represents over half the total value of Australia’s exports, and therefore a major contributor to the country’s current account.

The well-known global logistics problems have been primarily affecting container ships. Booking shipping, of the type used to carry iron ore and coal from Australia, has not had similar difficulties.

The domestic situation for Australia relating to omicron continues to improve. But, by comparison, China has been struggling to contain the much more transmissible variant. Their policy of rolling lockdowns could have sudden impacts on the price of commodities and by extension the AUDUSD.

Where things can happen

For example, a few days ago a lockdown in the southern city of Baise sent aluminum prices to a multi-year high because certain processing facilities are concentrated in specific areas. Hubei province – the capital of which is Wuhan – is the largest steel production area. Panzhihua is another major steel-producing city that could affect markets if it were subject to a rolling lockdown. The third-largest steel-producing city in China is Anshan, the capital of the Liaoning province, which had rising cases over the last few days.

In general, the global economic recovery and high inflation could support commodity prices in the medium term. But the potential shocks from omicron aren’t completely gone yet. So the trajectory of the Aussie could still be shaky as it continues to respond to commodity prices.


Orbex-LogoArticle by Orbex

Orbex is a fully licensed broker that was established in 2011. Founded with a mission to serve its traders responsibly and provides traders with access to the world’s largest and most liquid financial markets. www.orbex.com

Intraday Market Analysis – USD Finds Support

By Orbex

USDJPY to test major resistance

USDJPY

The US dollar surged after consumer prices hit a 40-year high. Higher lows and then a close above the recent peak at 115.65 is an indication of strong bullish pressure.

This breakout has propelled the greenback to January’s high at 116.35. Its breach could trigger a runaway rally and resume the uptrend in the medium term.

An overbought RSI on the hourly chart may briefly restrain the bullish fever. 115.30 is the closest support and the bulls may see a pullback as an opportunity to stake in.

XAGUSD seeks support

XAGUSD

Bullions fell back after US Treasury yields soared over hot US inflation data. The psychological level of 22.00 has proven to be a solid demand area.

A break above 23.00 has forced sellers to cover, paving the way for an upward extension. 24.00 from a previous rectangle consolidation is the next resistance.

A bullish breakout would bring silver back to this year’s high at 24.70. On the downside, the resistance-turned-support at 22.80 could see buying interest in case of a retracement.

US 100 hits resistance

NASDAQ

The Nasdaq 100 struggles as record-high US inflation exacerbates rate hike concerns.

The previous rebound has eased selling pressure but hit resistance under 15350. The subsequent pullback bounced off the 61.8% Fibonacci retracement level (14400), which suggests buyers’ strong interest in keeping the index afloat.

Sentiment is still a tad cautious unless the bulls clear the said hurdle. Then the psychological level of 16000 could be within reach. 14500 is a key support in case of an extended consolidation.


Orbex-LogoArticle by Orbex

Orbex is a fully licensed broker that was established in 2011. Founded with a mission to serve its traders responsibly and provides traders with access to the world’s largest and most liquid financial markets. www.orbex.com

Fibonacci Retracements Analysis 11.02.2022 (AUDUSD, USDCAD)

Article By RoboForex.com

AUDUSD, “Australian Dollar vs US Dollar”

As we can see in the H4 chart, AUDUSD has completed the first correctional wave to the upside after testing 23.6% fibo. The current decline may be heading to break the low at 0.6967 and then continue down to 50.0% fibo at 0.6758. However, as long as the price is moving above the low, the pair may yet resume trading upwards to reach 38.2% and 50.0% fibo at 0.7364 and 0.7487 respectively.

AUDUSD_H4
Risk Warning: the result of previous trading operations do not guarantee the same results in the future

The H1 chart shows a more detailed structure of the current decline after divergence on MACD. The asset is approaching 50.0% fibo at 0.7108 and may later continue moving towards 61.8% and 76.0% fibo at 0.7075 and 0.7035 respectively. If the price breaks the local resistance at 0.7249, it may continue the ascending tendency.

AUDUSD_H1
Risk Warning: the result of previous trading operations do not guarantee the same results in the future

USDCAD, “US Dollar vs Canadian Dollar”

As we can see in the H4 chart, the asset is correcting within the rising wave and has already tested 61.8% fibo twice. The current impulse may finally break this level and continue growing towards 76.0% fibo and the high at 1.2839 and 1.2963 respectively. A breakout of the high will result in a further uptrend towards the long-term 38.2% fibo at 1.3023. The support is the low at 1.2450.

USDCAD_H4
Risk Warning: the result of previous trading operations do not guarantee the same results in the future

The H1 chart shows a more detailed structure of the current short-term correction. After testing 38.2% fibo several times, the descending wave has failed to break it and reach 50.0% fibo at 1.2623. At the moment, the asset is trading upwards to reach the local high at 1.2796.

USDCAD_H1

Article By RoboForex.com

Attention!
Forecasts presented in this section only reflect the author’s private opinion and should not be considered as guidance for trading. RoboForex LP bears no responsibility for trading results based on trading recommendations described in these analytical reviews.

The Analytical Overview of the Main Currency Pairs on 2022.02.11

by JustForex

The EUR/USD currency pair

Technical indicators of the currency pair:
  • Prev Open: 1.1422
  • Prev Close: 1.1427
  • % chg. over the last day: +0.04%

The number of new jobless claims in the US was 223,000, while analysts had expected 230,000. With the US inflation level being worse than forecast and the labor market continuing to recover, the Fed no longer needs to stimulate the economy. Markets are currently pricing a 0.5% rate hike in March, which is positive for the dollar index and negative for the euro.

Trading recommendations
  • Support levels: 1.1362, 1.1329, 1.1275
  • Resistance levels: 1.1423, 1.1481, 1.1534, 1.1617

From the technical point of view, the EUR/USD on the hourly time frame is bullish. But yesterday, on the CPI news, the price expanded the price range. The MACD indicator became negative, selling pressure is still high. Under such market conditions, buy trades should be looked at from the support level 1.1363. Sell trades are better to look for on intraday time frames from the resistance level of 1.1423.

Alternative scenario: if the price breaks out through the 1.1329 support level and fixes below, the mid-term uptrend will likely be broken.

News feed for 2022.02.11:
  • – German Consumer Price Index (m/m) at 09:00 (GMT+2);
  • – US Michigan Consumer Sentiment (m/m) at 17:00 (GMT+2).

The GBP/USD currency pair

Technical indicators of the currency pair:
  • Prev Open: 1.3533
  • Prev Close: 1.3561
  • % chg. over the last day: +0.20%

A mixed medium-term background is forming on the GBP/USD currency pair. The British pound now has fundamental support from the Bank of England because when interest rates rise, the national rate strengthens in the medium term. However, it should not be forgotten that the Fed is also preparing to raise interest rates since March and will likely do so more aggressively as US inflation continues to grow rapidly. A lot of macro statistics will come out from the UK today. Good data might help the pound avoid further depreciation amid the rising dollar index.

Trading recommendations
  • Support levels: 1.3475, 1.3457, 1.3434
  • Resistance levels: 1.3542, 1.3610, 1.3639, 1.3662

On the hourly time frame, the trend on GBP/USD is bullish. But yesterday, after the CPI news and “hawkish” statements of FED representatives, the British pound started to decline sharply amid the growth of the dollar index. Under such market conditions, buy trades should be looked at from the support level 1.3475. The resistance level of 1.3542 may be considered for opening sell deals, but only with additional confirmation in the form of sellers’ initiative.

Alternative scenario: if the price breaks out through the 1.3475 support level and consolidates below, the bullish scenario will be broken.

News feed for 2022.02.11:
  • – UK GDP (q/q) at 09:00 (GMT+2);
  • – UK Industrial Production (m/m) at 09:00 (GMT+2);
  • – UK Manufacturing Production (m/m) at 09:00 (GMT+2).

The USD/JPY currency pair

Technical indicators of the currency pair:
  • Prev Open: 115.45
  • Prev Close: 115.99
  • % chg. over the last day: +0.47%

The monetary policy of the Bank of Japan is now aimed at making the JPY cheaper because of the maximum stimulus. At the same time, the Fed plans to tighten its monetary policy aggressively. Such opposite policy of central banks contributes to the growth of USD/JPY quotes.

Trading recommendations
  • Support levels: 115.66, 115.15, 114.76
  • Resistance levels: 116.12, 116.50

The global trend on the USD/JPY currency pair is bullish. The Japanese yen keeps getting cheaper amid the rising dollar index and due to the ultra-soft monetary policy of the Bank of Japan. The MACD indicator indicates a divergence. Under such market conditions, it is best to look for buy deals on the lower time frames from the support level of 115.66. Sell positions can be looked at from the resistance level 116.12, but only with short targets and additional confirmation.

Alternative scenario: if the price fixes below 115.15, the uptrend will likely be broken.

There is no news feed for today.

The USD/CAD currency pair

Technical indicators of the currency pair:
  • Prev Open: 1.2666
  • Prev Close: 1.2720
  • % chg. over the last day: +0.42%

The Canadian dollar is a commodity currency, so it depends not only on the monetary policy of the Bank of Canada but also on the oil prices and the dollar index. The sharp increase in the dollar index after the negative CPI news in the US led to a decline in oil quotes. As a result, the USD/CAD currency pair sharply increased in price by the end of the trading day.

Trading recommendations
  • Support levels: 1.2720, 1.2649, 1.2600, 1.2506
  • Resistance levels: 1.2792

From a technical point of view, the USD/CAD currency pair is bullish. Yesterday the price reached the priority change level, but the buyers were very active at this level, and as a result, the price bounced sharply upwards. Now a wide corridor is forming on the hour timeframe, and the pressure of buyers remains high. Under such market conditions, it is better to look for buy trades on the lower time frames from the support level of 1.2720. There are no optimal entry points to sell deals for now.

Alternative scenario: if the price breaks through the 1.2649 support level and fixes below, the downtrend will likely resume.

There is no news feed for today.

by JustForex


This article reflects a personal opinion and should not be interpreted as an investment advice, and/or offer, and/or a persistent request for carrying out financial transactions, and/or a guarantee, and/or a forecast of future events.