
By Orbex
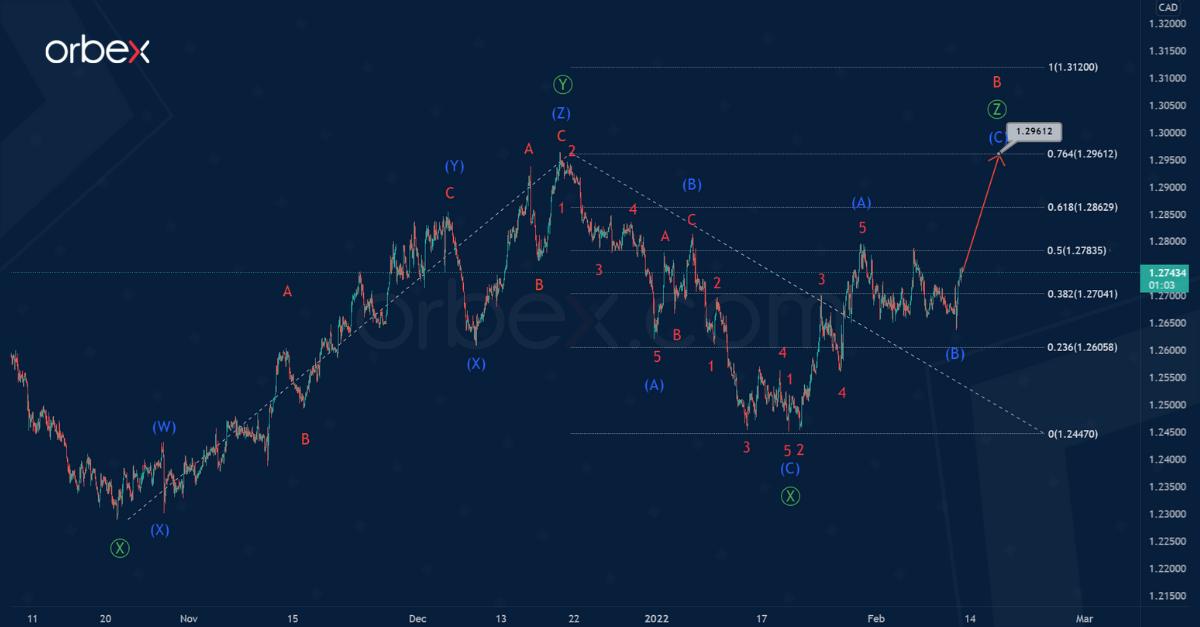
The current USDCAD structure indicates the formation of a bullish zigzag [Z] consisting of sub-waves (A)-(B)-(C) and being a simple zigzag.
This simple zigzag is located in the last part of the triple three [W]-[X]-[Y]-[X]-[Z]. Wave [Y] has taken the form of a triple zigzag. Wave [X] is a simple bearish zigzag (A)-(B)-(C), which is also fully complete.
The wave (C), which is currently under development, marked with a blue letter, is of the greatest interest at the moment. At the level of 1.296, the entire wave [Z] will be at 76.4% of wave [Y]. So at that level, we can expect the completion of the impulse (C). This is currently under construction.

Free Reports:
 Sign Up for Our Stock Market Newsletter – Get updated on News, Charts & Rankings of Public Companies when you join our Stocks Newsletter
 Get our Weekly Commitment of Traders Reports - See where the biggest traders (Hedge Funds and Commercial Hedgers) are positioned in the futures markets on a weekly basis.
Alternatively, the development of the primary bearish intervening wave [X] consisting of sub-waves (W)-(X)-(Y) has ended. These sub-waves all together make up a bearish triple zigzag. And within all the active parts are zigzags A-B-C, consisting of minor waves.
(W) and (X) could have fully formed, while (Y) is still under construction. As part of wave (Y), the development of correction B has recently finished. In the short term, market participants can expect a decline in the impulse wave C to the 1.245 area.
The target is determined by the previous minimum, which was formed by the wave (W).
![]() Article by Orbex
Article by Orbex
Orbex is a fully licensed broker that was established in 2011. Founded with a mission to serve its traders responsibly and provides traders with access to the world’s largest and most liquid financial markets. www.orbex.com

- COT Metals Charts: Weekly Speculator Bets see small gains for Silver & Gold Jul 12, 2026
- COT Bonds Charts: Speculator Bets led by SOFR 3-Months & 2-Year Bonds Jul 12, 2026
- COT Energy Charts: Weekly Speculator Changes led by Brent Oil Jul 12, 2026
- COT Soft Commodities Charts: Weekly Speculator Changes led by Sugar, Corn & Soybeans Jul 12, 2026
- The US and European stock indices are rising again amid renewed investor interest in the AI industry. Jul 10, 2026
- USD/JPY Falls as Yen Recovers Weekly Losses Jul 10, 2026
- Crude oil prices surged sharply by 7% in reaction to the rapid escalation of the conflict in the Middle East Jul 9, 2026
- Middle East Tensions Weigh on Gold Jul 9, 2026
- Pound Awaits Tighter Policy from Bank of England Jul 8, 2026
- The United States carried out airstrikes on Iran after Iran’s attacked tankers in the Strait of Hormuz. The RBNZ raised the interest rate to 2.5% Jul 8, 2026