
Article By RoboForex.com
AUDUSD, “Australian Dollar vs US Dollar”
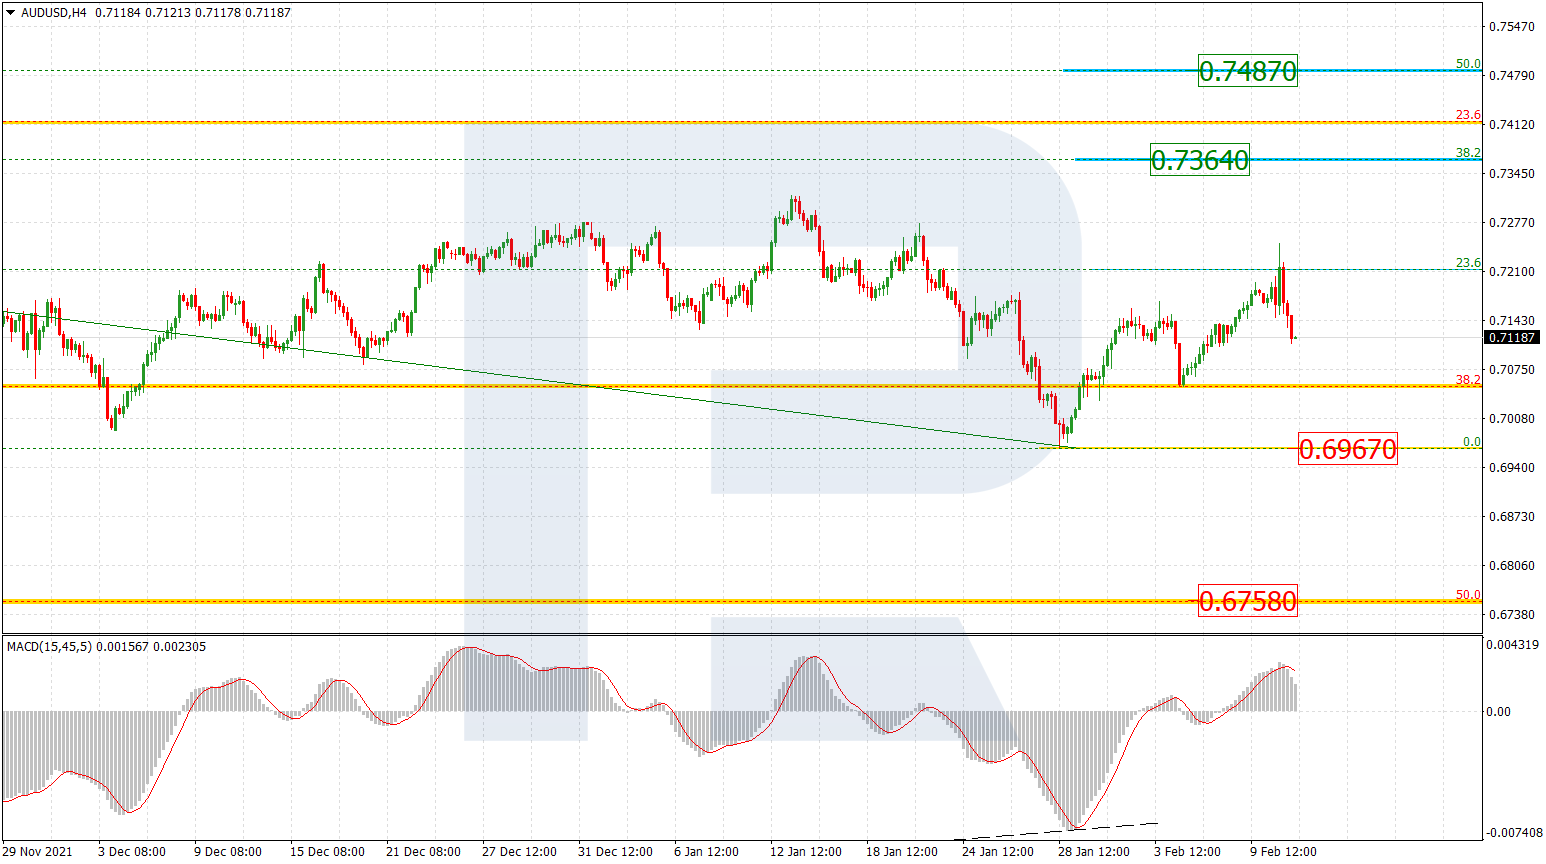
As we can see in the H4 chart, AUDUSD has completed the first correctional wave to the upside after testing 23.6% fibo. The current decline may be heading to break the low at 0.6967 and then continue down to 50.0% fibo at 0.6758. However, as long as the price is moving above the low, the pair may yet resume trading upwards to reach 38.2% and 50.0% fibo at 0.7364 and 0.7487 respectively.

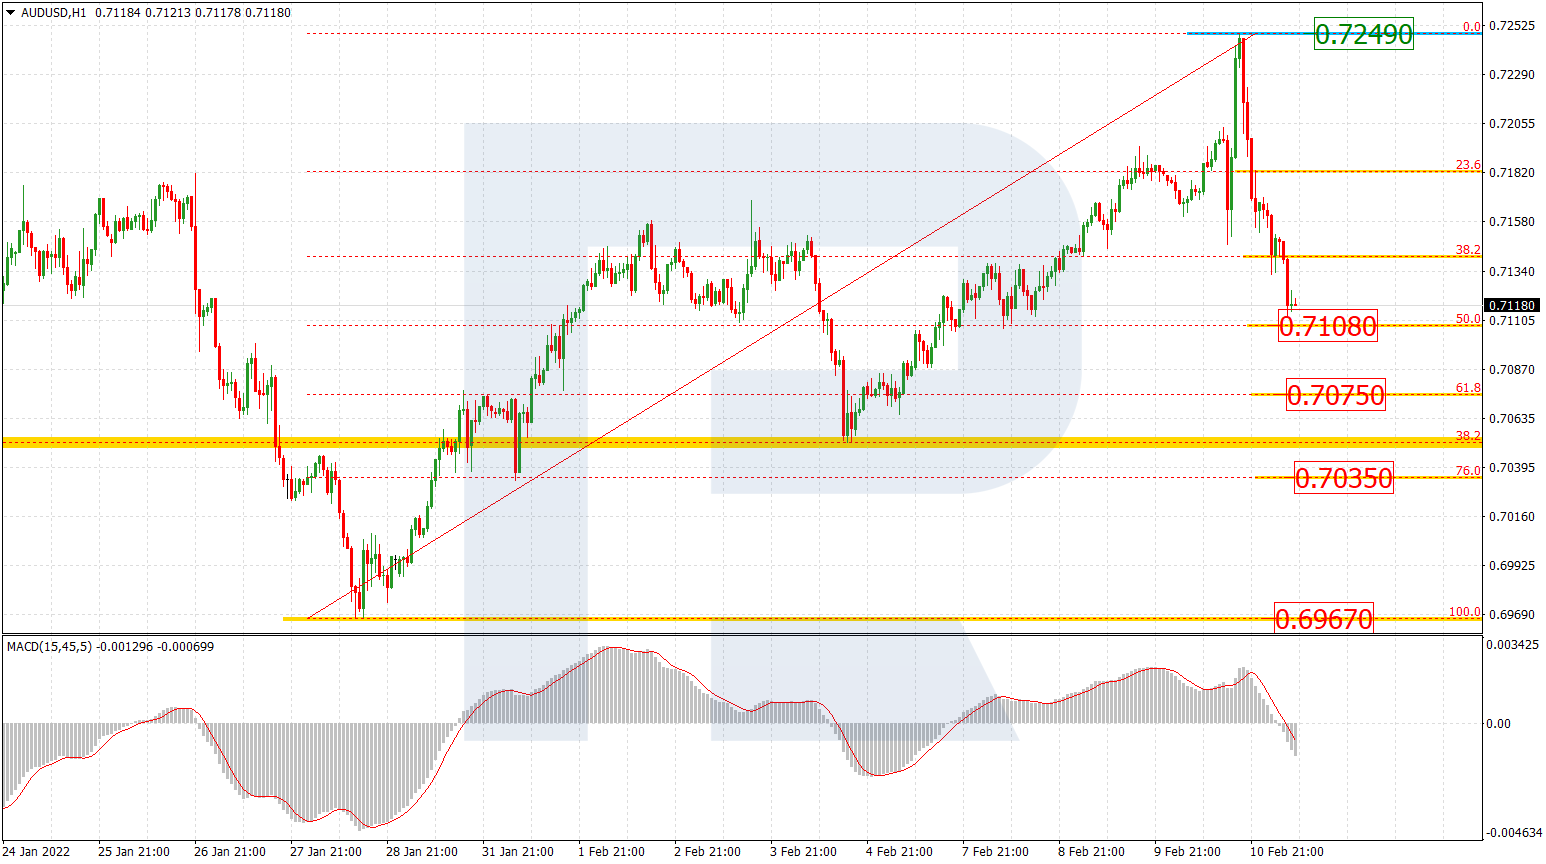
The H1 chart shows a more detailed structure of the current decline after divergence on MACD. The asset is approaching 50.0% fibo at 0.7108 and may later continue moving towards 61.8% and 76.0% fibo at 0.7075 and 0.7035 respectively. If the price breaks the local resistance at 0.7249, it may continue the ascending tendency.
Free Reports:
 Get our Weekly Commitment of Traders Reports - See where the biggest traders (Hedge Funds and Commercial Hedgers) are positioned in the futures markets on a weekly basis.
 Sign Up for Our Stock Market Newsletter – Get updated on News, Charts & Rankings of Public Companies when you join our Stocks Newsletter
USDCAD, “US Dollar vs Canadian Dollar”
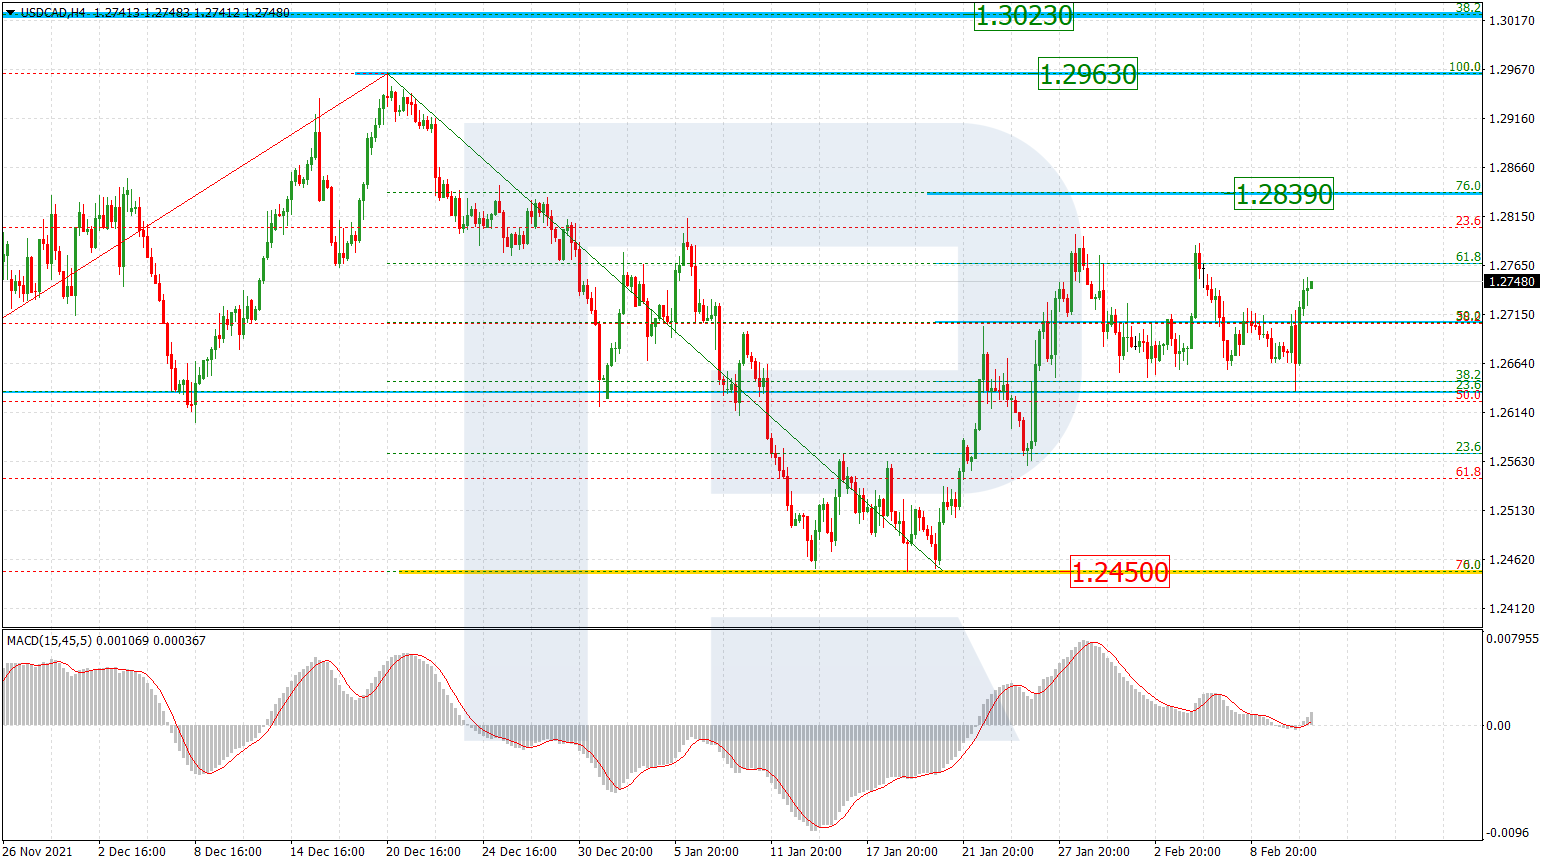
As we can see in the H4 chart, the asset is correcting within the rising wave and has already tested 61.8% fibo twice. The current impulse may finally break this level and continue growing towards 76.0% fibo and the high at 1.2839 and 1.2963 respectively. A breakout of the high will result in a further uptrend towards the long-term 38.2% fibo at 1.3023. The support is the low at 1.2450.
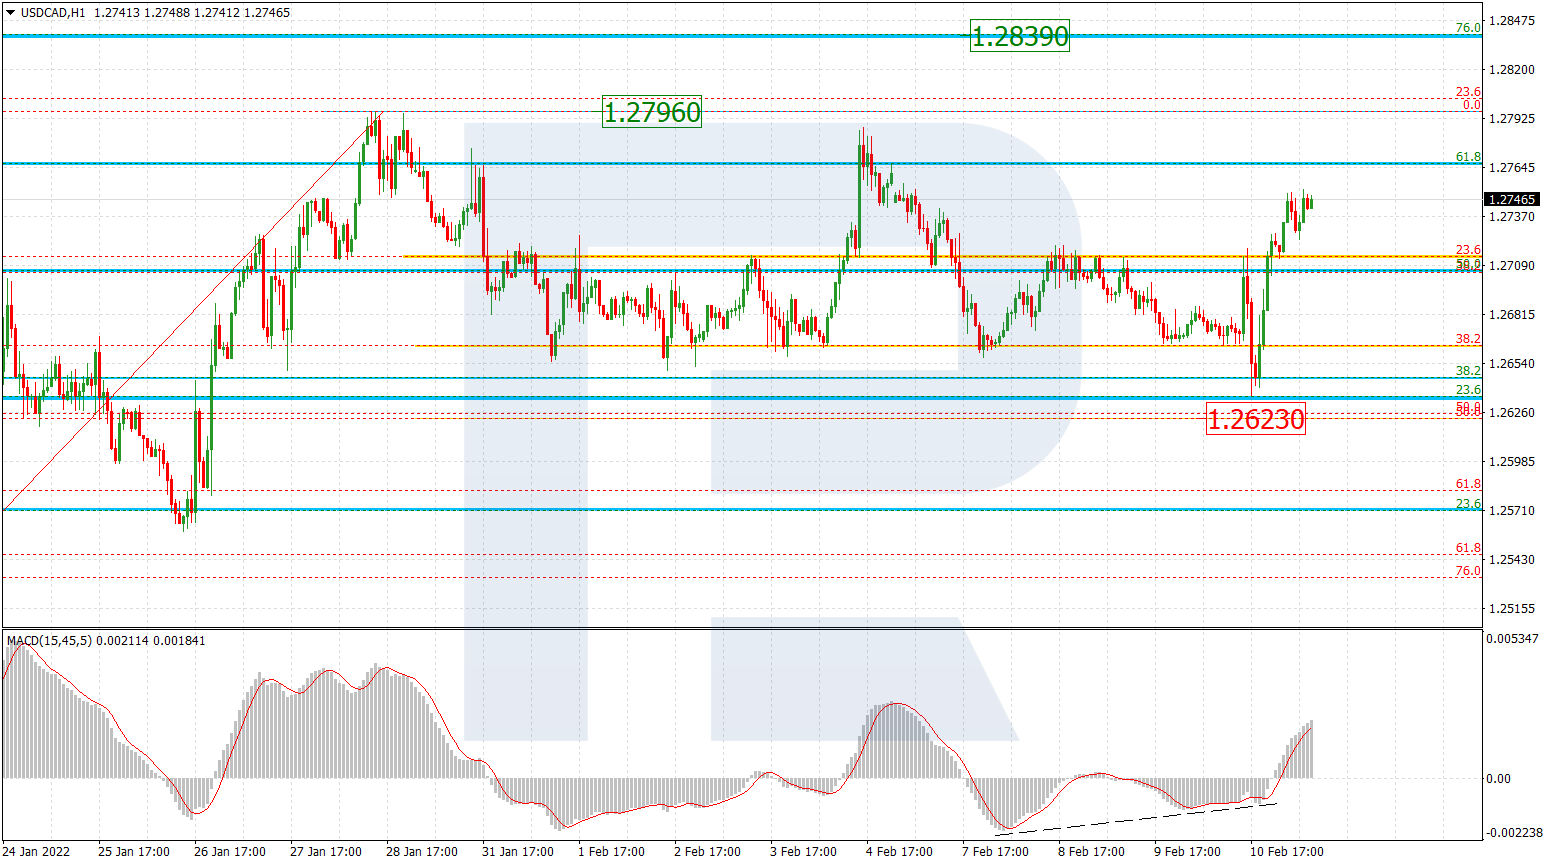
The H1 chart shows a more detailed structure of the current short-term correction. After testing 38.2% fibo several times, the descending wave has failed to break it and reach 50.0% fibo at 1.2623. At the moment, the asset is trading upwards to reach the local high at 1.2796.
Article By RoboForex.com
Attention!
Forecasts presented in this section only reflect the author’s private opinion and should not be considered as guidance for trading. RoboForex LP bears no responsibility for trading results based on trading recommendations described in these analytical reviews.

- Oil prices jumped 4% amid a new wave of escalation between the US and Iran Jul 13, 2026
- EUR/USD: US Inflation Will Determine Everything Jul 13, 2026
- COT Metals Charts: Weekly Speculator Bets see small gains for Silver & Gold Jul 12, 2026
- COT Bonds Charts: Speculator Bets led by SOFR 3-Months & 2-Year Bonds Jul 12, 2026
- COT Energy Charts: Weekly Speculator Changes led by Brent Oil Jul 12, 2026
- COT Soft Commodities Charts: Weekly Speculator Changes led by Sugar, Corn & Soybeans Jul 12, 2026
- The US and European stock indices are rising again amid renewed investor interest in the AI industry. Jul 10, 2026
- USD/JPY Falls as Yen Recovers Weekly Losses Jul 10, 2026
- Crude oil prices surged sharply by 7% in reaction to the rapid escalation of the conflict in the Middle East Jul 9, 2026
- Middle East Tensions Weigh on Gold Jul 9, 2026