Archive for Forex and Currency News – Page 164

How Low Can The Euro Go?

By Orbex

The EURUSD is down 250 pips from the start of the year. But since early February it has taken a turn lower, which significantly accelerated after Russia invaded Ukraine. The next major support level appears to be 1.1000.

Will it fall that far, or even farther? Is there a chance for a rebound? What’s driving price action?

Yields are the name of the game

On a broader scale, the main driving price of euro pairs revolved around interest rate expectations. And most of the other majors are seeing high inflation. That said, this has pushed their central banks to raise rates, which in turn raises yields on bonds.

Meanwhile, the euro area has high inflation, but not as high as other countries. More importantly, there was an expectation that the ECB would keep rates in the negative throughout the rest of the year.

Sure, in late January there was some talk that the ECB would finally have to start addressing the inflation problem. Subsequently, there was a bit of a rally in the EURUSD. But German Q4 GDP came in negative, suggesting that the eurozone is looking forward to a period of slow economic growth.

On the one hand, that constrains the central bank’s ability to tighten, but on the other usually slow economic growth correlates with lower inflation.

What changed?

Even if the ECB were to take action to deal with inflation, the consensus is that it would not be as aggressive as other central banks, particularly the Fed.

This means the yield spread would continue to widen, meaning it was more “profitable” to invest in US bonds than in European ones. That supports the dollar, as investors buy dollars to buy bonds. And this also weakens the euro, as investors sell euros so they can afford to buy those dollars.

Then the invasion of Ukraine happened. And the consensus is that out of the major economies, Europe stands the most to lose, as they are the most connected to Russia and Ukraine. That’s not just in terms of oil and gas, but also food from Ukraine.

While that could lead to higher prices, it can impact economic growth as well. Substantially, that would squeeze the ECB on both sides, making monetary policy changes very difficult.

How long will it last?

Many European companies are closing facilities or suspending shipments to Russia and Ukraine. Maersk, Kuehne + Nagle, and Deutsche Post are among the big companies that won’t ship to Russia. One of the largest food producers in Europe, Kernel, has suspended operations.

With higher energy and food costs, European companies are likely to struggle in an already difficult environment, making investments in Europe less attractive.

The escape valve would be a quick resolution to the Ukraine crisis. In fact, this would allow businesses to resume and reduce fears that Russian gas will shut off. Fuel prices are spiking as energy firms seek to sign future contracts with non-Russian suppliers out of fear that Russian supply might not be available in the next months.

However, talks initially planned to resume today have been postponed. Both sides are demanding concessions from the other that they deem as non-starters. As the conflict threatens to drag out, Europe is likely to experience even more economic struggles (even if it could be worse in Russia). And that could continue to weaken the euro.

Test your strategy on how the euro will fare with Orbex – Open your account now.


Orbex-LogoArticle by Orbex

Orbex is a fully licensed broker that was established in 2011. Founded with a mission to serve its traders responsibly and provides traders with access to the world’s largest and most liquid financial markets. www.orbex.com

GBPJPY Impulse Trend Pushes To 160.77

By Orbex

GBPJPY

The GBPJPY currency pair is moving within a cycle impulse. Now the third part of this impulse is under development.

We can assume that the correction wave ④ of the primary degree was fully complete at the end of December. This correction took the form of an intermediate triple zigzag.

Currently, we see the price rise in the primary wave ⑤. This takes the form of an intermediate 5-wave impulse.

The primary wave ⑤ can complete its pattern near 160.77. At that level, it will be at 50% of wave ③.

GBPJPY

In the second variant, the wave ⑤ is a complete ending diagonal consisting of intermediate sub-waves (1)-(2)-(3)-(4)-(5).

Together with the primary wave ⑤, the cycle impulse sub-wave III ended. Then prices dropped in the development of a cycle correction IV. This wave can take the form of a primary double zigzag.

It is possible that wave IV will be at 38.2% of impulse III. In fact, it could complete its pattern near 147.36.

Don’t have an account yet? No stress! Open your Orbex account now!


Orbex-LogoArticle by Orbex

Orbex is a fully licensed broker that was established in 2011. Founded with a mission to serve its traders responsibly and provides traders with access to the world’s largest and most liquid financial markets. www.orbex.com

Ichimoku Cloud Analysis 02.03.2022 (EURJPY, XAGUSD, AUDUSD)

Article By RoboForex.com

EURJPY, “Euro vs Japanese Yen”

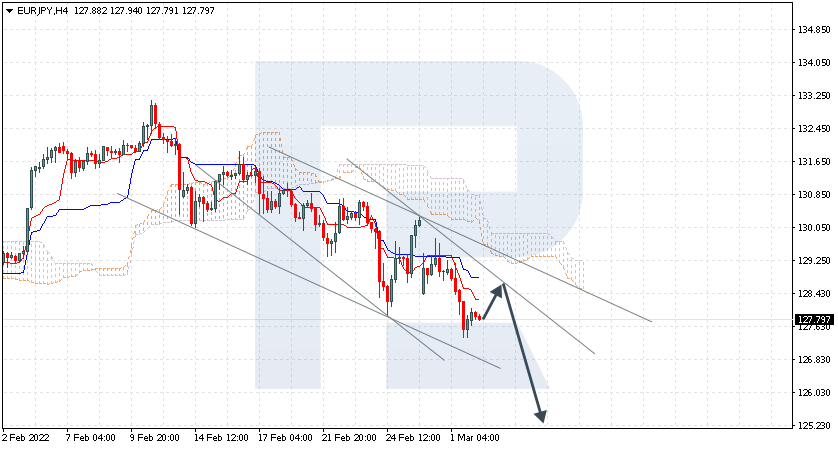
EURJPY is trading at 127.79; the instrument is moving below Ichimoku Cloud, thus indicating a descending tendency. The markets could indicate that the price may test Tenkan-Sen and Kijun-Sen at 128.75 and then resume moving downwards to reach 125.25. Another signal in favour of a further downtrend will be a rebound from the descending channel’s upside border. However, the bearish scenario may no longer be valid if the price breaks the cloud’s upside border and fixes above 130.45. In this case, the pair may continue growing towards 131.35.

EURJPY
Risk Warning: the result of previous trading operations do not guarantee the same results in the future

XAGUSD, “Silver vs US Dollar”

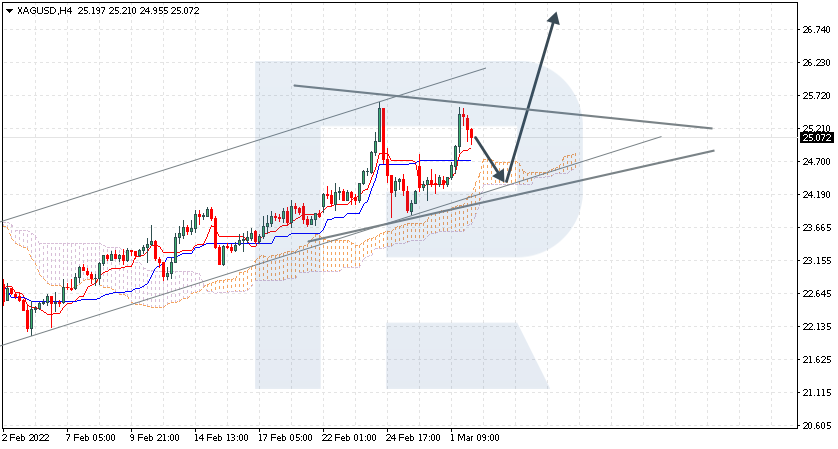
XAGUSD is trading at 25.07; the instrument is moving above Ichimoku Cloud, thus indicating an ascending tendency. The markets could indicate that the price may test the cloud’s downside border at 24.25 and then resume moving upwards to reach 26.85. Another signal in favour of a further uptrend will be a rebound from the rising channel’s downside border. However, the bullish scenario may no longer be valid if the price breaks the cloud’s downside border and fixes below 23.65. In this case, the pair may continue falling towards 22.75. To confirm further growth, the asset must break the upside border of the Triangle pattern and fix above 25.85.

XAGUSD
Risk Warning: the result of previous trading operations do not guarantee the same results in the future

AUDUSD, “Australian Dollar vs US Dollar”

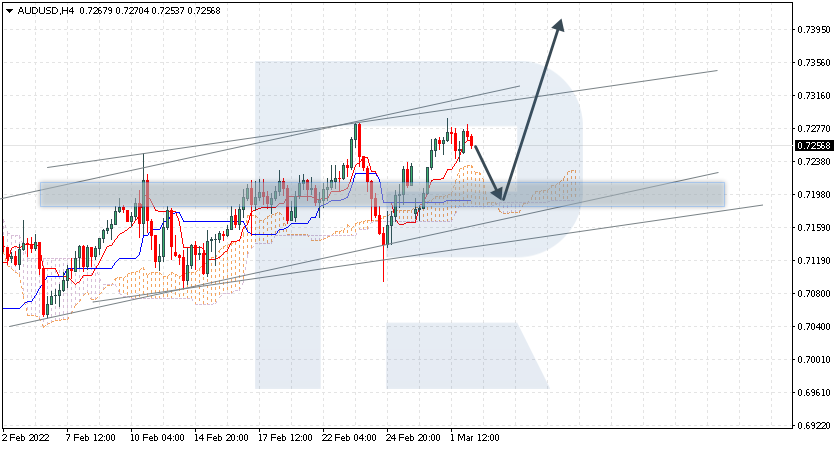
AUDUSD is trading at 0.7256; the instrument is moving above Ichimoku Cloud, thus indicating an ascending tendency. The markets could indicate that the price may test the cloud’s upside border at 0.7185 and then resume moving upwards to reach 0.7395. Another signal in favour of a further uptrend will be a rebound from the support level. However, the bullish scenario may no longer be valid if the price breaks the cloud’s downside border and fixes below 0.7135. In this case, the pair may continue falling towards 0.7045.

AUDUSD

Article By RoboForex.com

Attention!
Forecasts presented in this section only reflect the author’s private opinion and should not be considered as guidance for trading. RoboForex LP bears no responsibility for trading results based on trading recommendations described in these analytical reviews.

Murrey Math Lines 02.03.2022 (USDJPY, USDCAD)

Article By RoboForex.com

USDJPY, “US Dollar vs. Japanese Yen”

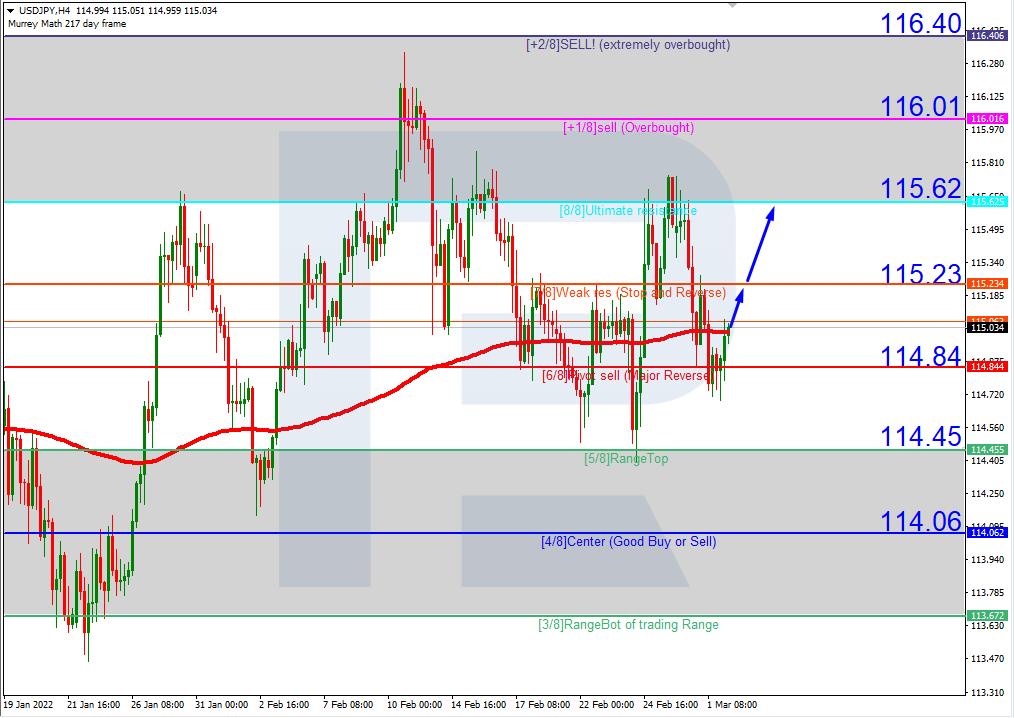
As we can see in the H4 chart, after rebounding from 6/8, USDJPY is trading above it. In this case, the price is expected to test 7/8, break it, and then continue growing to reach the resistance at 8/8. However, this scenario may no longer be valid if the price breaks 6/8 to the downside. After that, the instrument may reverse and fall towards the support at 4/8.

USDJPYH4
Risk Warning: the result of previous trading operations do not guarantee the same results in the future

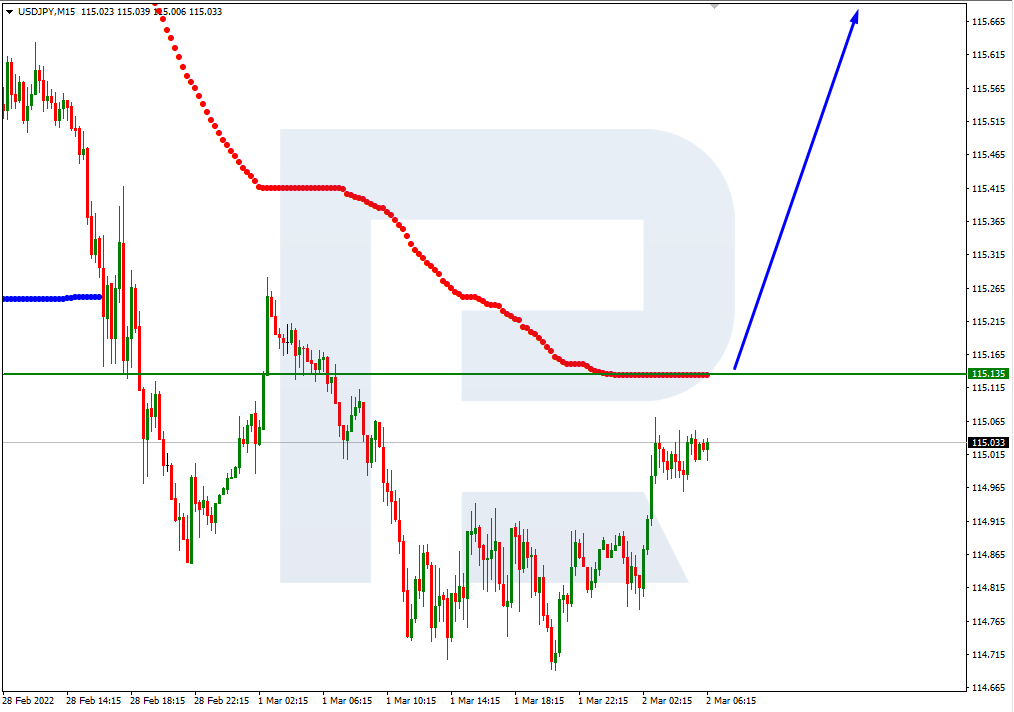
In the M15 chart, the pair may break the upside line of the VoltyChannel indicator and, as a result, continue trading upwards.

USDJPY_M15
Risk Warning: the result of previous trading operations do not guarantee the same results in the future

USDCAD, “US Dollar vs Canadian Dollar”

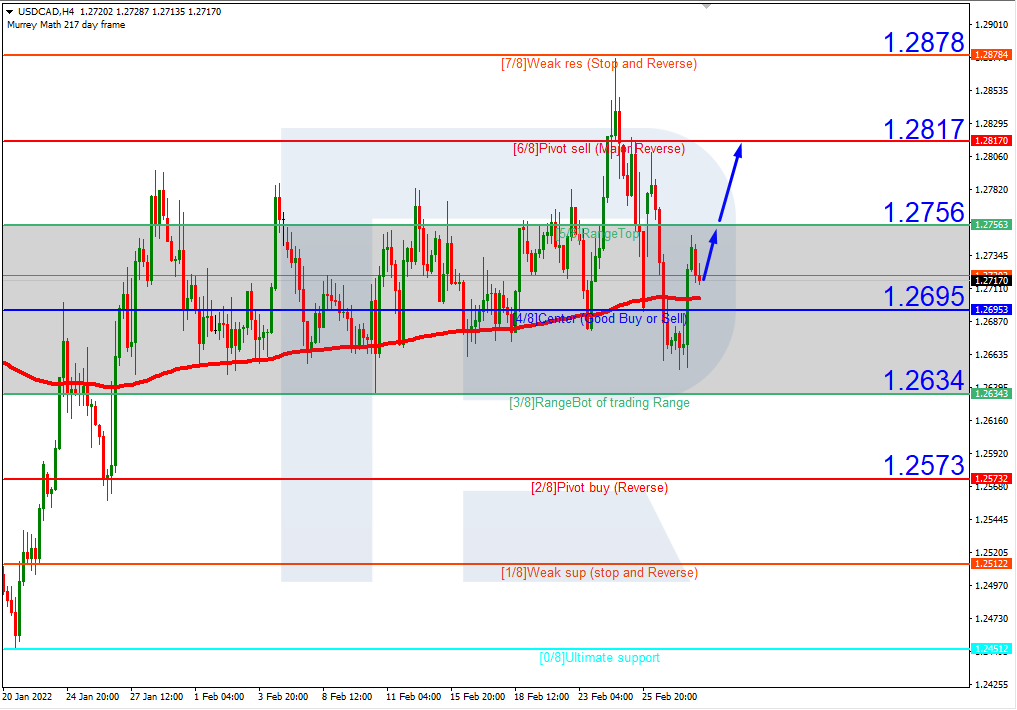
In the H4 chart, USDCAD is trading above the 200-day Moving Average to indicate a possible ascending tendency. In this case, the price is expected to test 5/8, break it, and continue growing towards the resistance at 6/8. Still, this scenario may no longer be valid if the price breaks the support at 4/8 to the downside. After that, the instrument may reverse and move downwards to reach 2/8.

USDCAD_H4
Risk Warning: the result of previous trading operations do not guarantee the same results in the future

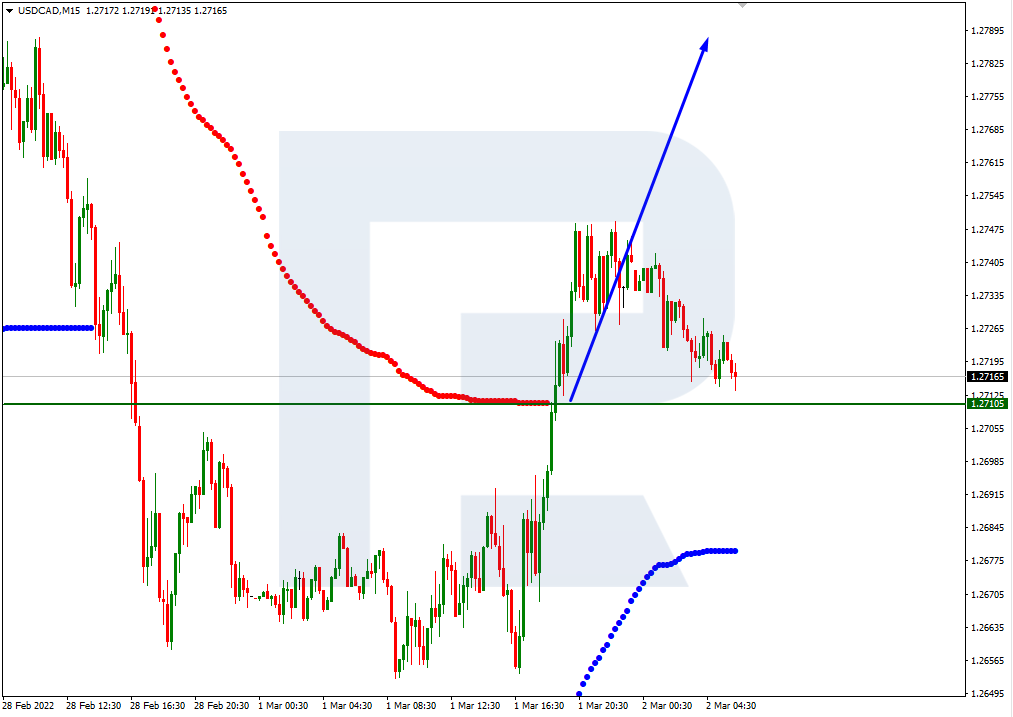
As we can see in the M15 chart, the pair has broken the upside line of the VoltyChannel indicator and, as a result, continue growing.

USDCAD_M15

Article By RoboForex.com

Attention!
Forecasts presented in this section only reflect the author’s private opinion and should not be considered as guidance for trading. RoboForex LP bears no responsibility for trading results based on trading recommendations described in these analytical reviews.

The Analytical Overview of the Main Currency Pairs on 2022.03.02

by JustForex

The EUR/USD currency pair

Technical indicators of the currency pair:
  • Prev Open: 1.1215
  • Prev Close: 1.1123
  • % chg. over the last day: -0.82%

The European currency fell to its lowest since June 2020 amid Russia’s invasion of Ukraine. Investors are buying dollars as a defensive asset, and energy prices are rising because of possible supply shortages. For this reason, currencies such as the euro and the British pound are losing value.

Trading recommendations
  • Support levels: 1.1107, 1.1032
  • Resistance levels: 1.1211, 1.1273, 1.1392, 1.1459

From the technical point of view, the trend on the EUR/USD currency pair on the hourly time frame is bearish. The MACD indicator is in the negative area, but there are signs of divergence to the buying side. Under such market conditions, it is best to look for sell trades on intraday time frames from the resistance level of 1.1211. Buy trades should be considered from the support level of 1.1107, but only with short targets.

Alternative scenario: if the price breaks out through the 1.1274 resistance level and fixes above, the mid-term uptrend will likely resume.

EUR/USD
News feed for 2022.03.02:
  • – Eurozone Consumer Price Index (m/m) at 12:00 (GMT+2);
  • – US ADP Nonfarm Employment Change (m/m) at 15:15 (GMT+2);
  • – US FOMC Member Bullard’s Speech at 16:30 (GMT+2);
  • – US Fed Chair Jerome Powell Testifies at 17:00 (GMT+2).

The GBP/USD currency pair

Technical indicators of the currency pair:
  • Prev Open: 1.3402
  • Prev Close: 1.3324
  • % chg. over the last day: -0.58%

The index of business activity in the manufacturing sector increased last month. This indicates that the region’s economy is recovering. However, analysts forecast a slowdown in the coming months due to Russian aggression against Ukraine and resulting economic sanctions, which will partly negatively affect European countries.

Trading recommendations
  • Support levels: 1.3274, 1.3220
  • Resistance levels: 1.3315, 1.3382, 1.3442, 1.3486, 1.3529, 1.3560

On the hourly time frame, the GBP/USD trend is bearish. Volatility remains high, sellers’ pressure has increased. Under such market conditions, buy trades should be considered from the support level of 1.3274, but it is better with confirmation. Resistance levels of 1.3315 and 1.3382 are good for sell deals, but only with an additional confirmation in the form of sellers’ initiative.

Alternative scenario: if the price breaks out through the 1.3442 resistance level and fixes above, the mid-term uptrend will likely resume.

GBP/USD
There is no news feed for today.

The USD/JPY currency pair

Technical indicators of the currency pair:
  • Prev Open: 114.98
  • Prev Close: 114.91
  • % chg. over the last day: -0.06%

The Japanese yen is a safe-haven currency in case of various financial shocks. With the beginning of Russia’s aggression against Ukraine, the Japanese yen has become a safe-haven currency for many investors, along with the US Dollar. For this reason, both the Japanese yen and Dollar Index are now inclined to rise, even though the policies of the central banks of the USA and Japan are diametrically opposite.

Trading recommendations
  • Support levels: 114.86, 114.78, 114.41
  • Resistance levels: 115.49, 115.69, 115.87, 116.32

The medium-term trend on the USD/JPY currency pair is bullish, but the structure is flatter, as the price has no single dynamics. The MACD indicator has become positive, and there is buying pressure. Under such market conditions, it is best to look for buy deals on the lower time frames from the support level of 114.86, but with additional confirmation. For sell deals, a resistance level of 115.49 may be considered.

Alternative scenario: if the price fixes below 114.41, the uptrend will likely be broken.

USD/JPY
There is no news feed for today.

The USD/CAD currency pair

Technical indicators of the currency pair:
  • Prev Open: 1.2667
  • Prev Close: 1.2741
  • % chg. over the last day: +0.58%

Today, an OPEC+ meeting will take place, at which decisions can be made to increase oil supplies to stop the energy price spike amid Russia’s invasion of Ukraine. There will also be a meeting of the Canadian Central Bank today. Analysts predict that the Bank of Canada will raise interest rates by 0.25% to stop the sharp rise in inflation in the country.

Trading recommendations
  • Support levels: 1.2723, 1.2694, 1.2653
  • Resistance levels: 1.2797, 1.2820, 1.2876

From the technical point of view, the USD/CAD currency pair trend is bearish. But today, USD/CAD quotes are growing against the background of increased aggression from Russia. It is worth trading only with short targets because both oil and the dollar index are now inclined to grow. Under such market conditions, it is better to look for buy trades on the lower time frames from the support level of 1.2723, but it is better with additional confirmation. For sell deals, it is better to consider the resistance level of 1.2797.

Alternative scenario: if the price breaks through and consolidates above 1.2797, the downtrend will most likely be broken.

USD/CAD
News feed for 2022.03.02:
  • – OPEC+ Meeting at 12:00 (GMT+2);
  • – Canada BoC Interest Rate Decision (m/m) at 17:00 (GMT+2);
  • – Canada BoC Rate Statement (m/m) at 17:00 (GMT+2).

by JustForex


This article reflects a personal opinion and should not be interpreted as an investment advice, and/or offer, and/or a persistent request for carrying out financial transactions, and/or a guarantee, and/or a forecast of future events.

Introduction To Forex Trading – FREE Live Webinar!

By Orbex

free live webinar

Calling all beginner Forex traders! We’ve put together a comprehensive webinar dedicated to teaching you how to trade the financial markets!

Next Monday, March 7th at 6 pm GMT, our seasoned market expert David Kindley will be going live on Zoom to cover all the basics you need to begin your online trading journey.

Sign up now for a chance to learn:

  • The basics of the FX markets
  • The advantages of trading CFDs
  • How volume and leverage affect trades
  • What to look out for when deciding on a trade

The webinar is free to attend, but seats are limited.

Book your spot today to start trading responsibly!

Register Now!


Orbex-LogoArticle by Orbex

Orbex is a fully licensed broker that was established in 2011. Founded with a mission to serve its traders responsibly and provides traders with access to the world’s largest and most liquid financial markets. www.orbex.com

AUDUSD Primary Intervening Wave Ⓧ To End Near 0.744

By Orbex

AUDUSD

AUDUSD seems to be forming a bearish triple Ⓦ-Ⓧ-Ⓨ-Ⓧ-Ⓩ zigzag.

At the time of writing, a bullish intervening wave Ⓧ is developing. This can take the form of an intermediate triple (W)-(X)-(Y)-(X)-(Z) zigzag.

In the upcoming trading weeks, prices could continue higher in (Z), more precisely in its final minor wave Z, as shown on the chart.

Prices could rise to the level of 0.744. At that level, the primary wave Ⓧ will be at 50% of the primary wave Ⓨ.

After reaching the specified level, the price could fall in the primary wave Ⓩ, below the minimum of 0.696 marked by the wave (X).

AUDUSD

It is also worth considering an alternative scenario in which the market is in the final part of the primary wave Ⓩ.

Most likely, this wave is a double zigzag (W)-(X)-(Y). To complete this double zigzag, an intermediate wave (Y) is necessary. According to the internal structure, this wave is similar to double zigzag W-X-Y of the minor degree.

In the near future, the price could lower in the minor wave Y to the level of 0.688. At the level of 0.688, the intermediate wave (Y) will be at 76.4% of the intermediate wave (W).

Finally, it is likely that the cycle wave z will develop above the maximum of 0.731.

Join our responsible trading community – Open your Orbex account now!


Orbex-LogoArticle by Orbex

Orbex is a fully licensed broker that was established in 2011. Founded with a mission to serve its traders responsibly and provides traders with access to the world’s largest and most liquid financial markets. www.orbex.com
Intraday Market Analysis – CHF Gains Momentum

By Orbex

USDCHF struggles for support

USDCHF

The Swiss franc rallies as new sanctions against Russia trigger a flight to safety.

The pair has met stiff resistance in the supply area (0.9290). Then a drop below 0.9220 and 0.9170 suggests that sentiment remains cautious and buyers are hesitant. 0.9150 is a key level to safeguard the greenback’s latest bounce.

A bearish breakout could send the pair to the daily support at 0.9110. An oversold RSI may attract some buying interest. The bulls need to reclaim 0.9230 before they could hope for a turnaround.

EURGBP attempts to rebound

EURGBP

The euro struggles amid escalation in Western sanctions.

A bullish attempt above 0.8400 indicates an upward bias as sellers cover their positions. 0.8310 has been solid support. And the market mood may become increasingly upbeat if buyers succeed in holding above this level.

An extended rally may send the single currency to the daily resistance at 0.8475, where a breakout may cause a bullish reversal in the weeks to come. On the downside, a fall below the said demand zone may send the euro to 0.8260.

US 100 to test key resistance

NASDAQ

The Nasdaq 100 bounces as Russia and Ukraine meet for peace talks.

The index saw bids near last May’s lows (13050), an important floor to prevent further bleeding. A rebound above 14050 has prompted some sellers to take profit, easing the downward pressure for the moment.

Price action is heading to the next resistance at 14500 which sits on the 30-day moving average, and high volume could be expected in this area of interest. A bullish breakout could boost sentiment in the short term and extend gains to 15280.


Orbex-LogoArticle by Orbex

Orbex is a fully licensed broker that was established in 2011. Founded with a mission to serve its traders responsibly and provides traders with access to the world’s largest and most liquid financial markets. www.orbex.com

Ichimoku Cloud Analysis 01.03.2022 (EURUSD, XAUUSD, GBPUSD)

Article By RoboForex.com

EURUSD, “Euro vs US Dollar”

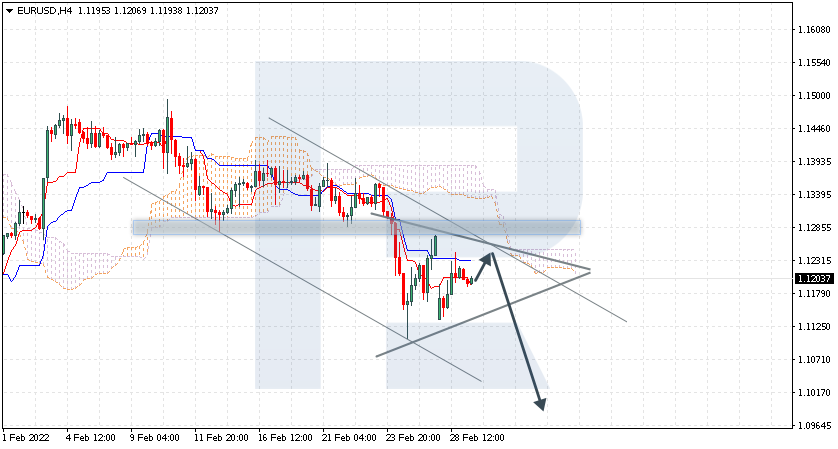
EURUSD is trading at 1.1203; the instrument is moving below Ichimoku Cloud, thus indicating a descending tendency. The markets could indicate that the price may test Tenkan-Sen and Kijun-Sen at 1.1230 and then resume moving downwards to reach 1.0995. Another signal in favour of a further downtrend will be a rebound from the descending channel’s upside border. However, the bearish scenario may no longer be valid if the price breaks the cloud’s upside border and fixes above 1.1415. In this case, the pair may continue growing towards 1.1505. To confirm further decline, the asset must break the downside border of the Triangle pattern and fix below 1.1125.

EURUSD
Risk Warning: the result of previous trading operations do not guarantee the same results in the future

XAUUSD, “Gold vs US Dollar”

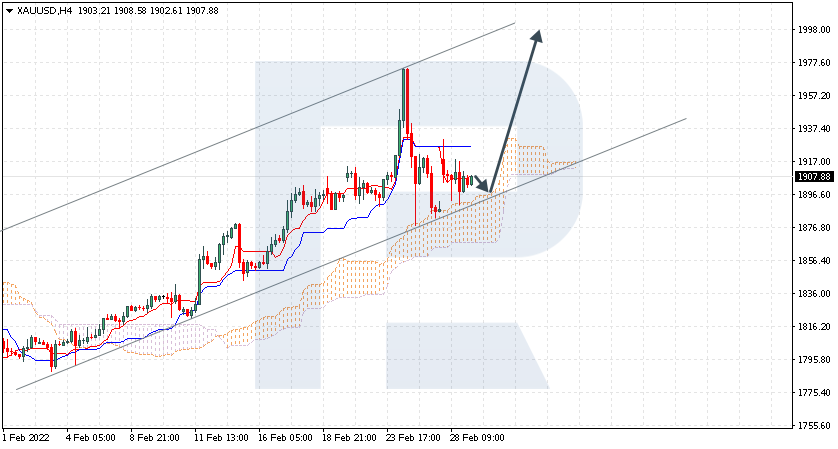
XAUUSD is trading at 1907.00; the instrument is moving above Ichimoku Cloud, thus indicating an ascending tendency. The markets could indicate that the price may test the cloud’s upside border at 1895.00 and then resume moving upwards to reach 1995.00. Another signal in favour of a further uptrend will be a rebound from the rising channel’s downside border. However, the bullish scenario may no longer be valid if the price breaks the cloud’s downside border and fixes below 1845.00. In this case, the pair may continue falling towards 1805.00.

XAUUSD
Risk Warning: the result of previous trading operations do not guarantee the same results in the future

GBPUSD, “Great Britain Pound vs US Dollar”

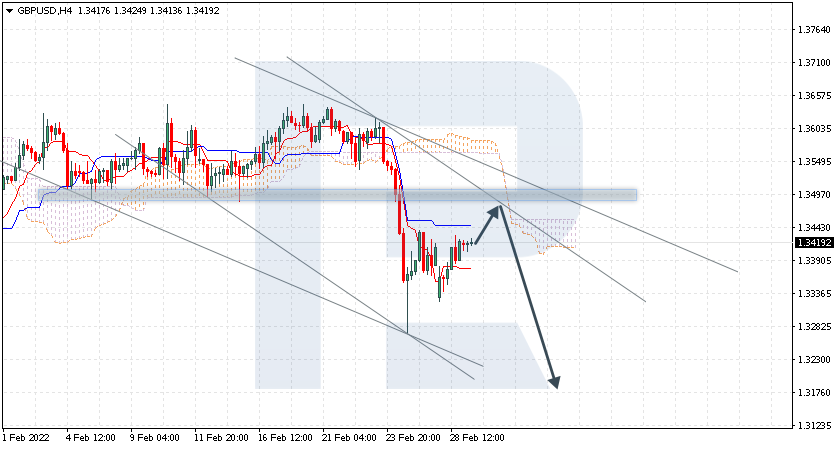
GBPUSD is trading at 1.3419; the instrument is moving below Ichimoku Cloud, thus indicating a descending tendency. The markets could indicate that the price may test the cloud’s downside border at 1.3455 and then resume moving downwards to reach 1.3175. Another signal in favour of a further downtrend will be a rebound from the descending channel’s upside. However, the bearish scenario may no longer be valid if the price breaks the cloud’s upside border and fixes above 1.3565. In this case, the pair may continue growing towards 1.3655.

GBPUSD
Risk Warning: the result of previous trading operations do not guarantee the same results in the future

Article By RoboForex.com

Attention!
Forecasts presented in this section only reflect the author’s private opinion and should not be considered as guidance for trading. RoboForex LP bears no responsibility for trading results based on trading recommendations described in these analytical reviews.

Japanese Candlesticks Analysis 01.03.2022 (EURUSD, USDJPY, EURGBP)

Article By RoboForex.com

EURUSD, “Euro vs US Dollar”

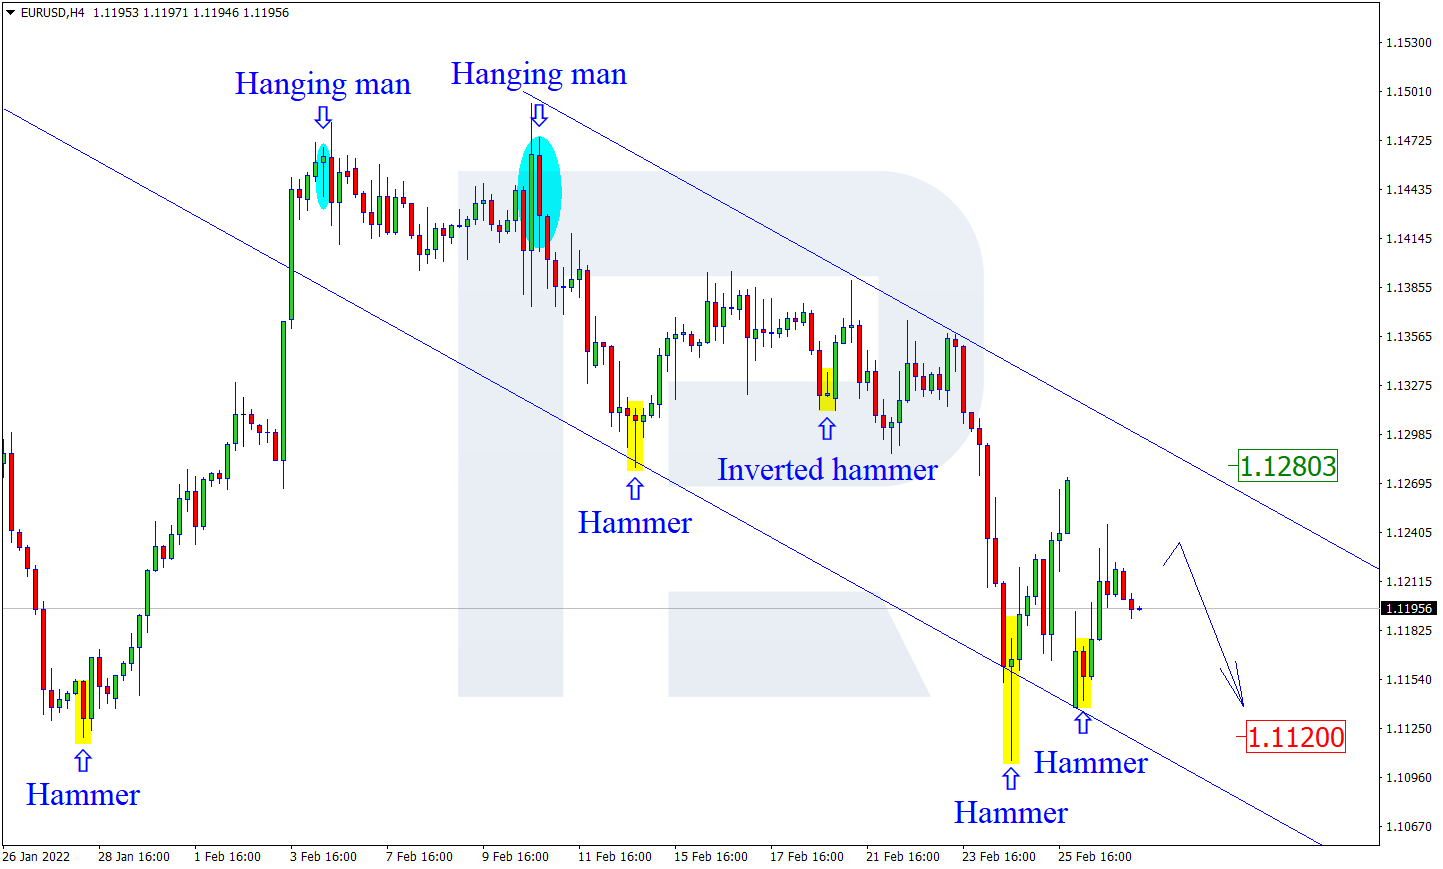
As we can see in the H4 chart, the asset has formed a Hammer reversal pattern close to the support level. At the moment, EURUSD is reversing and may form a new rising impulse. In this case, the upside target may be at 1.1280. However, an alternative scenario implies that the price may fall to reach 1.1120 without any corrections towards the resistance area.

EURUSD
Risk Warning: the result of previous trading operations do not guarantee the same results in the future

USDJPY, “US Dollar vs Japanese Yen”

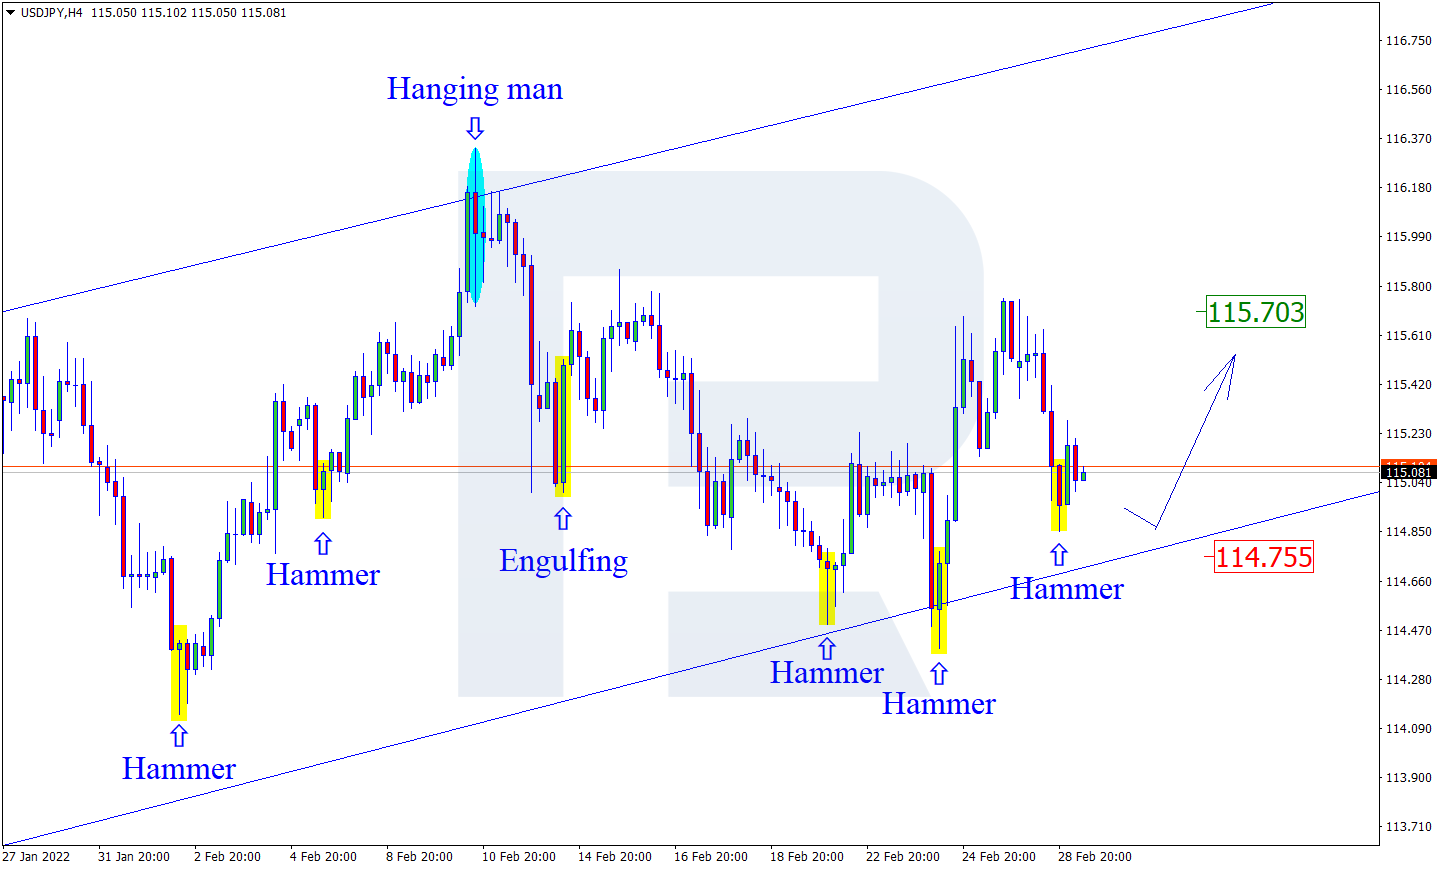
As we can see in the H4 chart, during the pullback, USDJPY has formed several reversal patterns, such as Hammer. At the moment, USDJPY is reversing and may start a new growth towards the resistance area. In this case, the upside target may be at 115.70. At the same time, an opposite scenario implies that the price may correct to reach 114.75 before resuming its uptrend.

USDJPY
Risk Warning: the result of previous trading operations do not guarantee the same results in the future

EURGBP, “Euro vs Great Britain Pound”

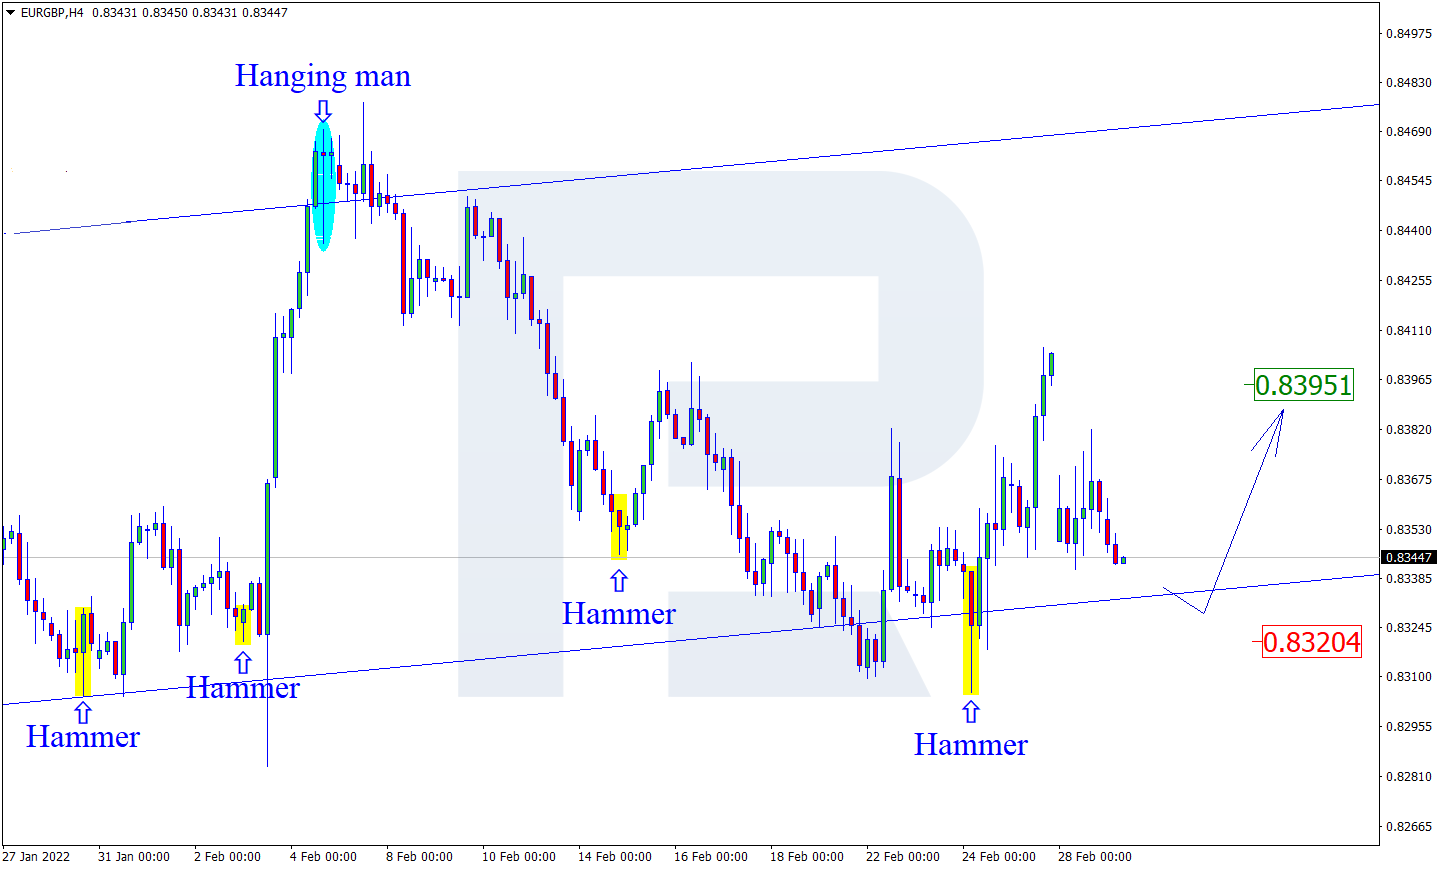
As we can see in the H4 chart, after forming a Hammer reversal pattern near the support area, EURGBP is reversing and may start another growth towards the resistance level. In this case, the upside target may be at 0.8395. Later, the market may test the level, break it, and continue the ascending tendency. Still, there might be an alternative scenario, according to which the asset may fall to reach 0.8320 before resuming its growth.

EURGBP

Article By RoboForex.com

Attention!
Forecasts presented in this section only reflect the author’s private opinion and should not be considered as guidance for trading. RoboForex LP bears no responsibility for trading results based on trading recommendations described in these analytical reviews.