by JustForex
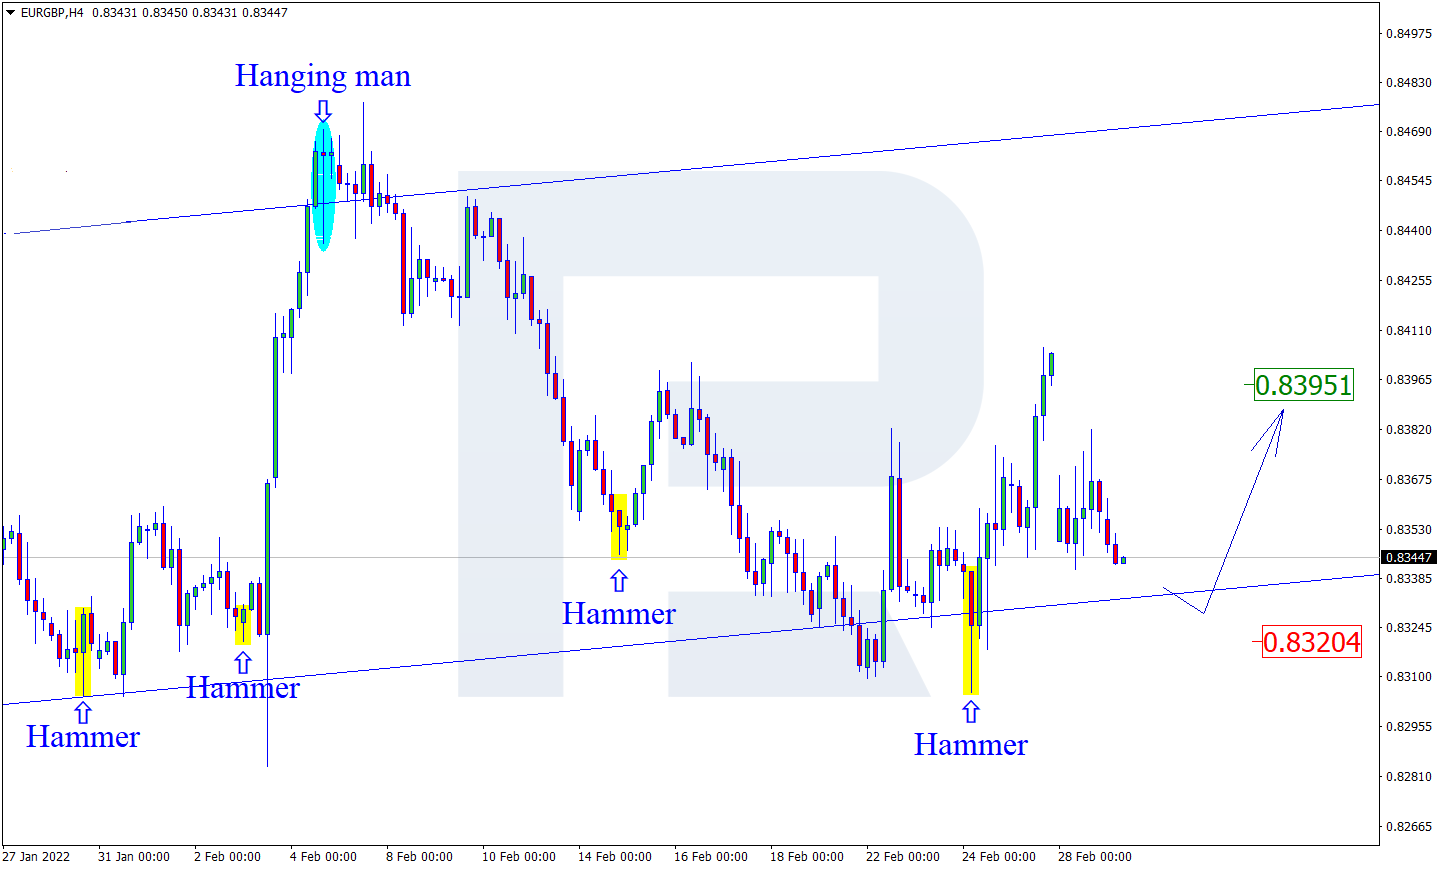
The EUR/USD currency pair
- Prev Open: 1.1215
- Prev Close: 1.1123
- % chg. over the last day: -0.82%
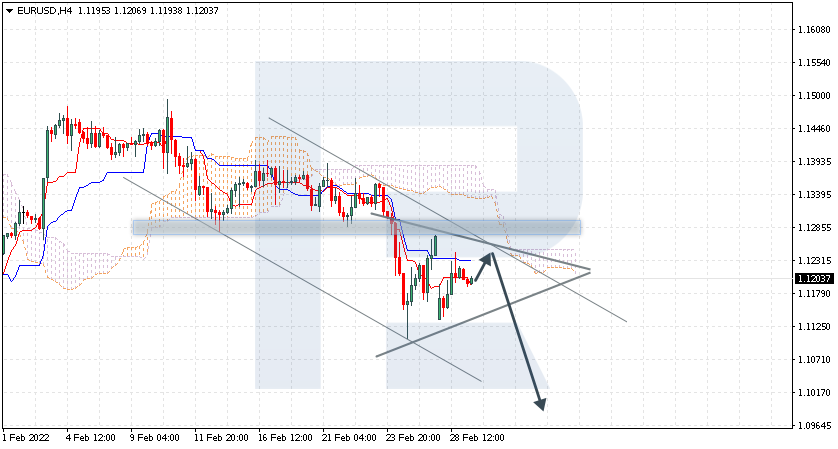
The European currency fell to its lowest since June 2020 amid Russia’s invasion of Ukraine. Investors are buying dollars as a defensive asset, and energy prices are rising because of possible supply shortages. For this reason, currencies such as the euro and the British pound are losing value.
- Support levels: 1.1107, 1.1032
- Resistance levels: 1.1211, 1.1273, 1.1392, 1.1459
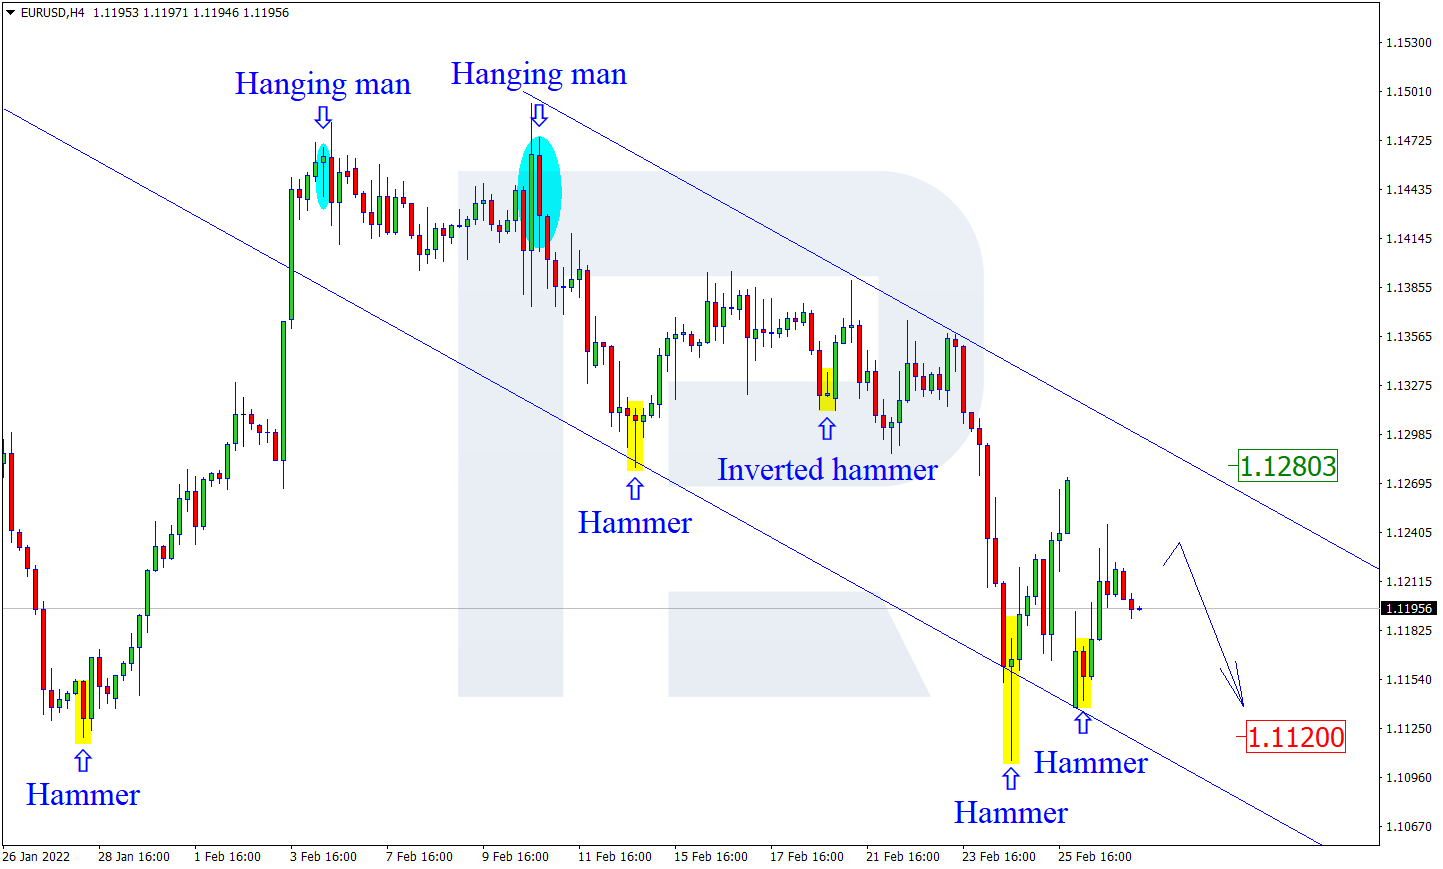
From the technical point of view, the trend on the EUR/USD currency pair on the hourly time frame is bearish. The MACD indicator is in the negative area, but there are signs of divergence to the buying side. Under such market conditions, it is best to look for sell trades on intraday time frames from the resistance level of 1.1211. Buy trades should be considered from the support level of 1.1107, but only with short targets.
Alternative scenario: if the price breaks out through the 1.1274 resistance level and fixes above, the mid-term uptrend will likely resume.

- – Eurozone Consumer Price Index (m/m) at 12:00 (GMT+2);
- – US ADP Nonfarm Employment Change (m/m) at 15:15 (GMT+2);
- – US FOMC Member Bullard’s Speech at 16:30 (GMT+2);
- – US Fed Chair Jerome Powell Testifies at 17:00 (GMT+2).
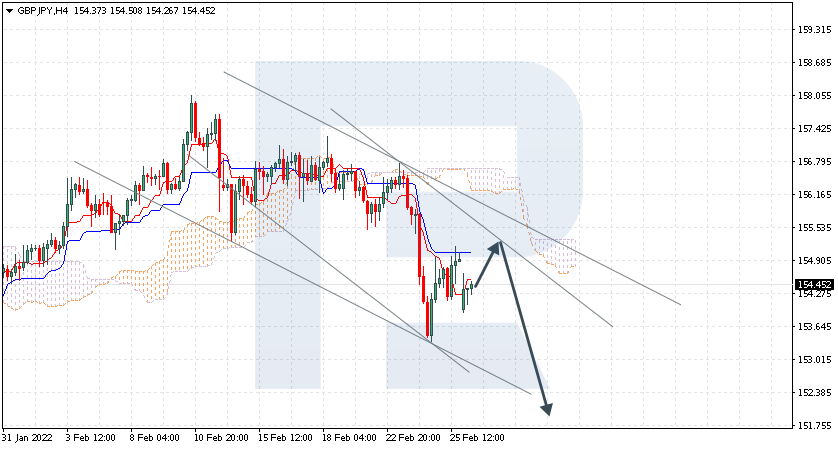
The GBP/USD currency pair
- Prev Open: 1.3402
- Prev Close: 1.3324
- % chg. over the last day: -0.58%
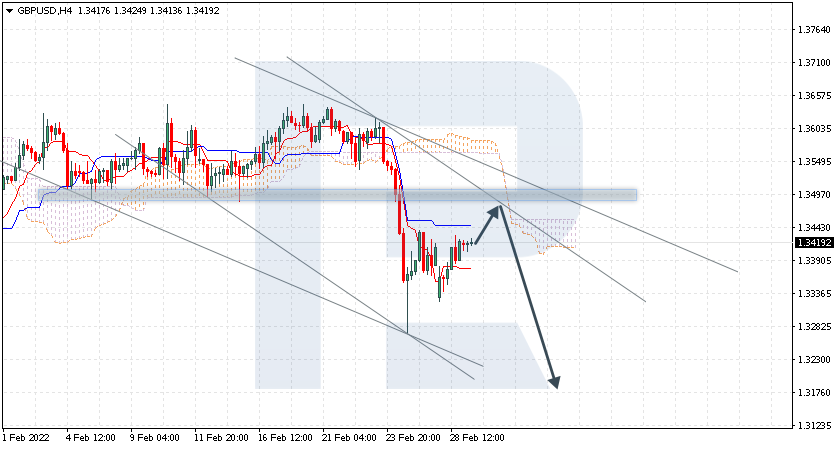
The index of business activity in the manufacturing sector increased last month. This indicates that the region’s economy is recovering. However, analysts forecast a slowdown in the coming months due to Russian aggression against Ukraine and resulting economic sanctions, which will partly negatively affect European countries.
- Support levels: 1.3274, 1.3220
- Resistance levels: 1.3315, 1.3382, 1.3442, 1.3486, 1.3529, 1.3560
On the hourly time frame, the GBP/USD trend is bearish. Volatility remains high, sellers’ pressure has increased. Under such market conditions, buy trades should be considered from the support level of 1.3274, but it is better with confirmation. Resistance levels of 1.3315 and 1.3382 are good for sell deals, but only with an additional confirmation in the form of sellers’ initiative.
Alternative scenario: if the price breaks out through the 1.3442 resistance level and fixes above, the mid-term uptrend will likely resume.

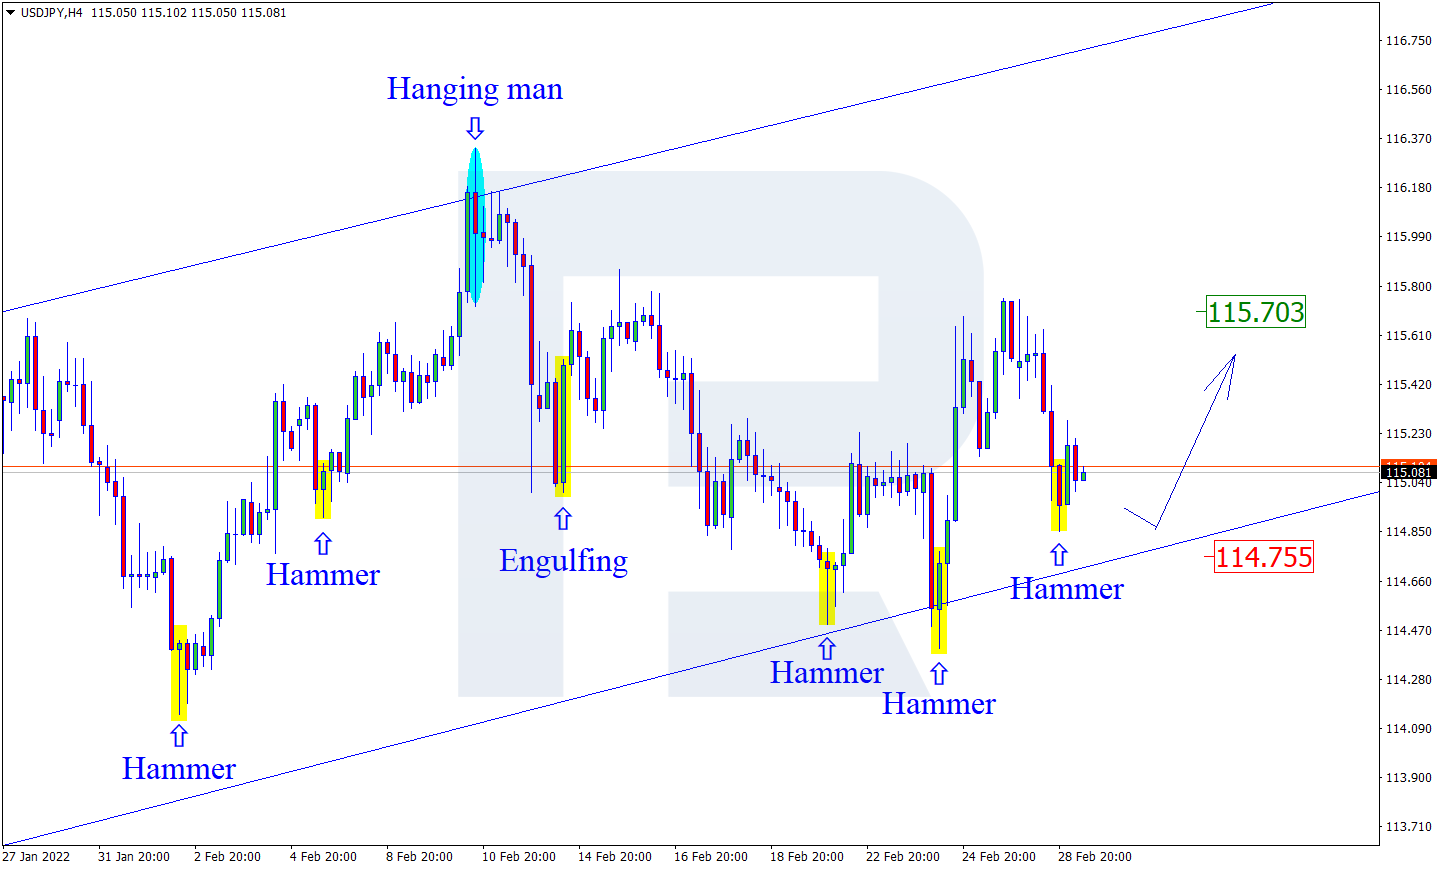
The USD/JPY currency pair
- Prev Open: 114.98
- Prev Close: 114.91
- % chg. over the last day: -0.06%
The Japanese yen is a safe-haven currency in case of various financial shocks. With the beginning of Russia’s aggression against Ukraine, the Japanese yen has become a safe-haven currency for many investors, along with the US Dollar. For this reason, both the Japanese yen and Dollar Index are now inclined to rise, even though the policies of the central banks of the USA and Japan are diametrically opposite.
- Support levels: 114.86, 114.78, 114.41
- Resistance levels: 115.49, 115.69, 115.87, 116.32
The medium-term trend on the USD/JPY currency pair is bullish, but the structure is flatter, as the price has no single dynamics. The MACD indicator has become positive, and there is buying pressure. Under such market conditions, it is best to look for buy deals on the lower time frames from the support level of 114.86, but with additional confirmation. For sell deals, a resistance level of 115.49 may be considered.
Alternative scenario: if the price fixes below 114.41, the uptrend will likely be broken.

The USD/CAD currency pair
- Prev Open: 1.2667
- Prev Close: 1.2741
- % chg. over the last day: +0.58%
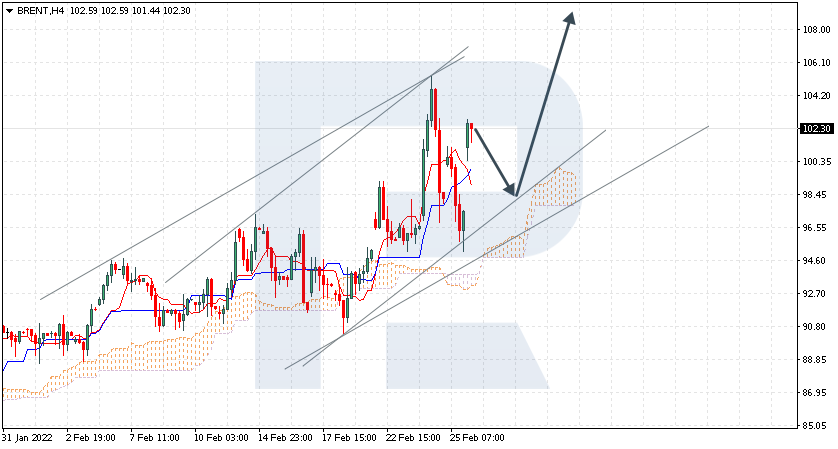
Today, an OPEC+ meeting will take place, at which decisions can be made to increase oil supplies to stop the energy price spike amid Russia’s invasion of Ukraine. There will also be a meeting of the Canadian Central Bank today. Analysts predict that the Bank of Canada will raise interest rates by 0.25% to stop the sharp rise in inflation in the country.
- Support levels: 1.2723, 1.2694, 1.2653
- Resistance levels: 1.2797, 1.2820, 1.2876
From the technical point of view, the USD/CAD currency pair trend is bearish. But today, USD/CAD quotes are growing against the background of increased aggression from Russia. It is worth trading only with short targets because both oil and the dollar index are now inclined to grow. Under such market conditions, it is better to look for buy trades on the lower time frames from the support level of 1.2723, but it is better with additional confirmation. For sell deals, it is better to consider the resistance level of 1.2797.
Alternative scenario: if the price breaks through and consolidates above 1.2797, the downtrend will most likely be broken.

- – OPEC+ Meeting at 12:00 (GMT+2);
- – Canada BoC Interest Rate Decision (m/m) at 17:00 (GMT+2);
- – Canada BoC Rate Statement (m/m) at 17:00 (GMT+2).
by JustForex
This article reflects a personal opinion and should not be interpreted as an investment advice, and/or offer, and/or a persistent request for carrying out financial transactions, and/or a guarantee, and/or a forecast of future events.