By InvestMacro | COT | Data Tables | COT Leaders | Downloads | COT Newsletter
Here are the latest charts and statistics for the Commitment of Traders (COT) data published by the Commodities Futures Trading Commission (CFTC).
The latest COT data is updated through Tuesday February 22nd and shows a quick view of how large traders (for-profit speculators and commercial entities) were positioned in the futures markets. All currency positions are in direct relation to the US dollar where, for example, a bet for the euro is a bet that the euro will rise versus the dollar while a bet against the euro will be a bet that the euro will decline versus the dollar.
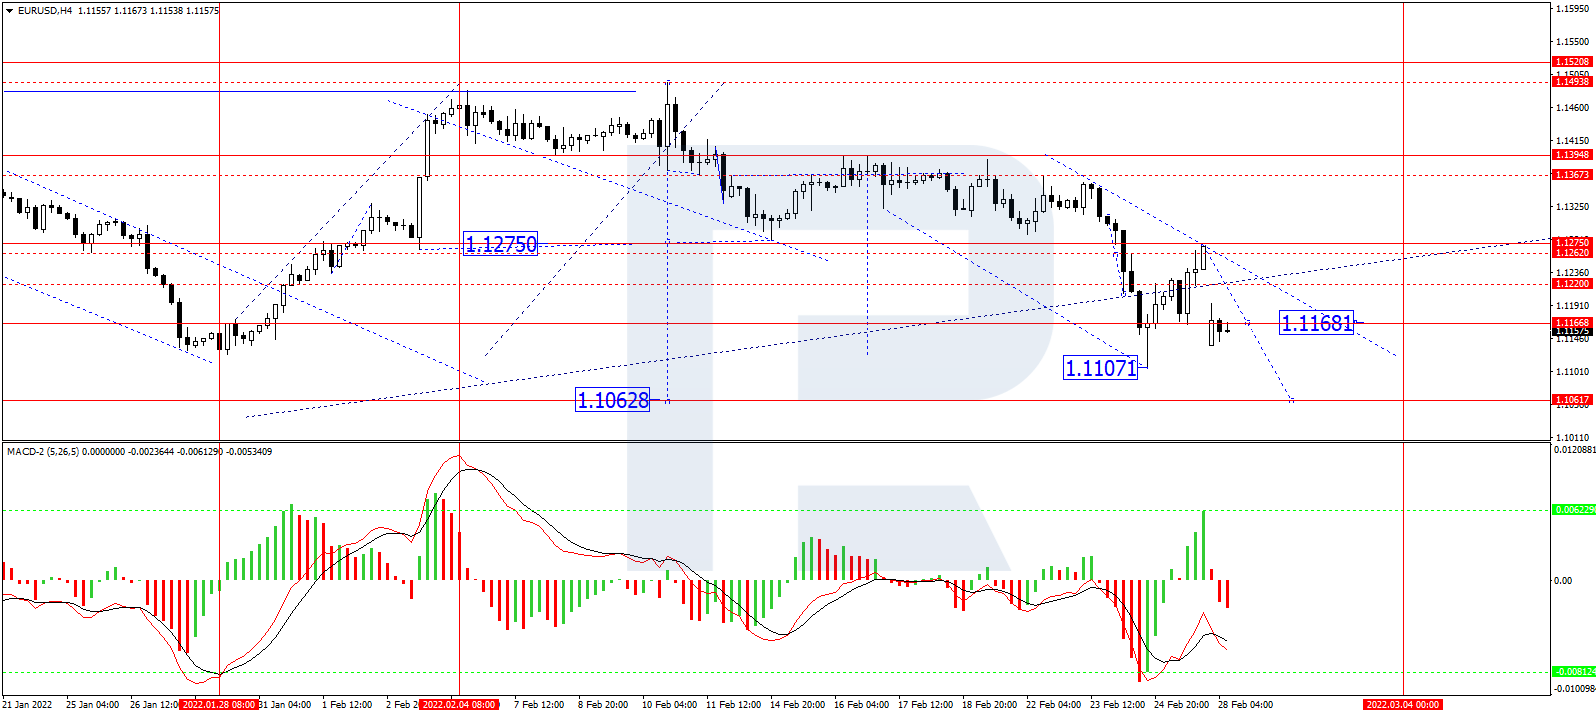
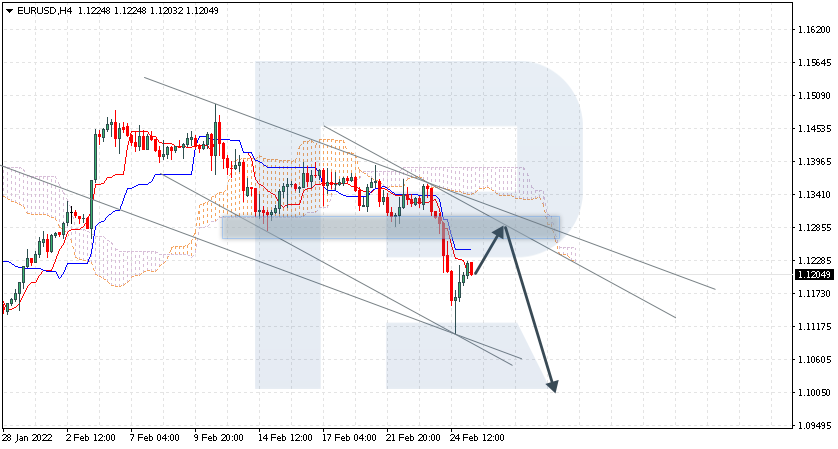
Highlighting the COT currency data was the further rise in bullish bets in the Euro currency futures contracts. Euro speculators raised their bullish bets for a third straight week this week and for the ninth time in the past ten weeks. Over this ten-week time-frame, Euro bets have gained by a total of +71,185 contracts, going from -10,162 net positions on December 12th to a total of +59,306 net positions through this Tuesday the 22nd of February (please note that this is a couple days before the Russian invasion of Ukraine). Overall, the current Euro standing is at the most bullish level of the past thirty-two weeks, dating back to July 13th when the net position was at +59,713 contracts.
Joining the Euro (11,725 contracts) with positive speculator changes this week were the yen (2,975 contracts), Brazil real (685 contracts), US Dollar Index (698 contracts), Australian dollar (2,614 contracts), Russian ruble (3,353 contracts) and the Mexican peso (7,851 contracts).
The currencies with declining bets were the Swiss franc (-1,272 contracts), British pound sterling (-8,046 contracts), New Zealand dollar (-2,218 contracts), Canadian dollar (-2,917 contracts) and Bitcoin (-68 contracts).
| Feb-22-2022 | OI | OI-Index | Spec-Net | Spec-Index | Com-Net | COM-Index | Smalls-Net | Smalls-Index |
|---|
| USD Index | 54,922 | 78 | 36,084 | 88 | -41,368 | 6 | 5,284 | 74 |
| EUR | 696,682 | 82 | 59,306 | 53 | -98,050 | 48 | 38,744 | 39 |
| GBP | 188,443 | 31 | -5,809 | 70 | 10,070 | 36 | -4,261 | 47 |
| JPY | 194,169 | 51 | -63,187 | 28 | 82,480 | 77 | -19,293 | 8 |
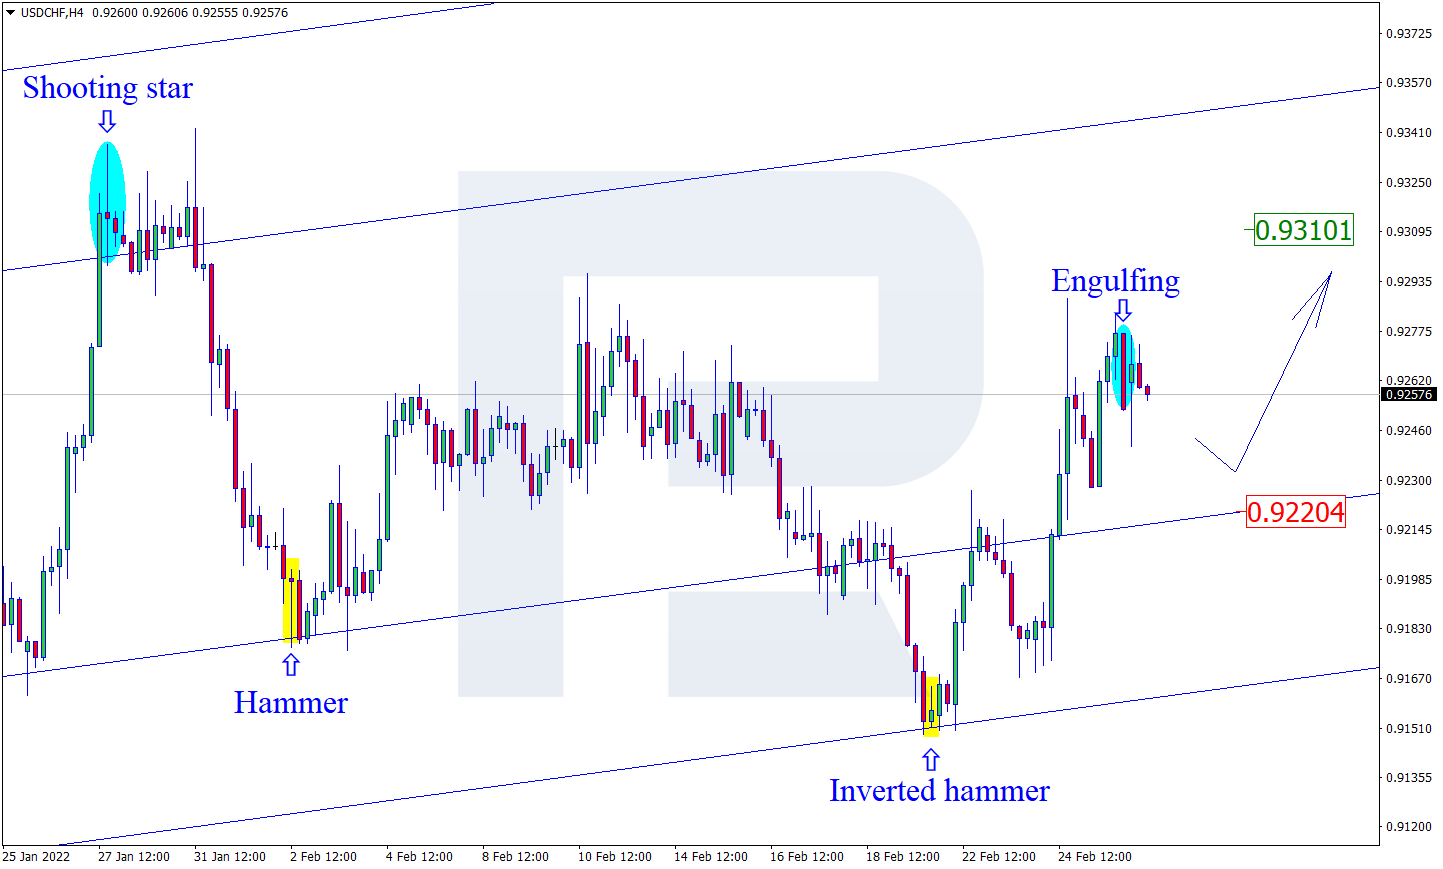
| CHF | 47,339 | 24 | -10,987 | 51 | 19,110 | 52 | -8,123 | 39 |
| CAD | 140,305 | 24 | 9,253 | 57 | -14,143 | 47 | 4,890 | 40 |
| AUD | 192,579 | 77 | -84,080 | 7 | 96,072 | 91 | -11,992 | 23 |
| NZD | 56,636 | 56 | -11,551 | 52 | 13,908 | 52 | -2,357 | 25 |
| MXN | 171,299 | 36 | 16,825 | 35 | -21,038 | 64 | 4,213 | 61 |
| RUB | 38,673 | 34 | 19,517 | 60 | -20,053 | 40 | 536 | 49 |
| BRL | 94,577 | 100 | 24,445 | 100 | -27,081 | 0 | 2,636 | 97 |
| Bitcoin | 11,007 | 59 | -283 | 91 | -256 | 0 | 539 | 25 |
US Dollar Index Futures:
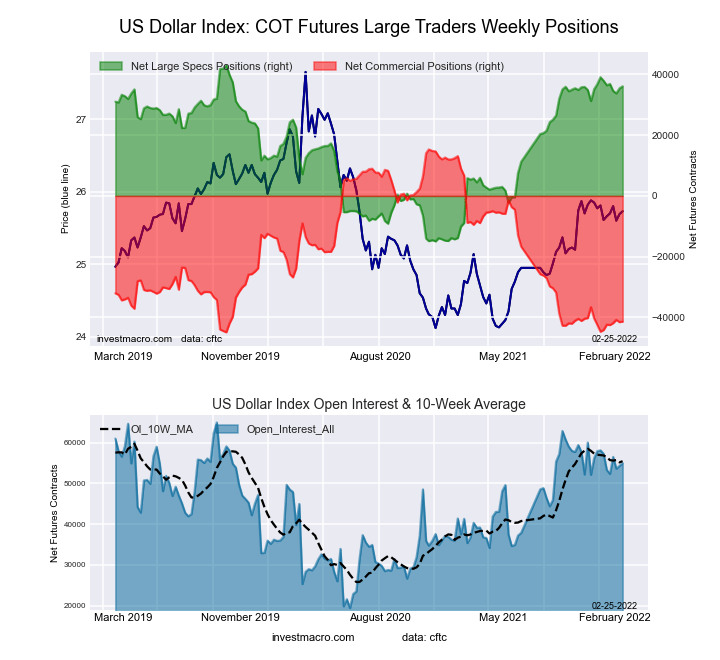 The US Dollar Index large speculator standing this week came in at a net position of 36,084 contracts in the data reported through Tuesday. This was a weekly lift of 698 contracts from the previous week which had a total of 35,386 net contracts.
This week’s current strength score (the trader positioning range over the past three years, measured from 0 to 100) shows the speculators are currently Bullish-Extreme with a score of 88.0 percent. The commercials are Bearish-Extreme with a score of 5.9 percent and the small traders (not shown in chart) are Bullish with a score of 74.3 percent.
| US DOLLAR INDEX Statistics | SPECULATORS | COMMERCIALS | SMALL TRADERS |
| – Percent of Open Interest Longs: | 79.6 | 5.0 | 12.7 |
| – Percent of Open Interest Shorts: | 13.9 | 80.3 | 3.1 |
| – Net Position: | 36,084 | -41,368 | 5,284 |
| – Gross Longs: | 43,726 | 2,742 | 6,969 |
| – Gross Shorts: | 7,642 | 44,110 | 1,685 |
| – Long to Short Ratio: | 5.7 to 1 | 0.1 to 1 | 4.1 to 1 |
| NET POSITION TREND: | | | |
| – Strength Index Score (3 Year Range Pct): | 88.0 | 5.9 | 74.3 |
| – Strength Index Reading (3 Year Range): | Bullish-Extreme | Bearish-Extreme | Bullish |
| NET POSITION MOVEMENT INDEX: | | | |
| – 6-Week Change in Strength Index: | -3.1 | 4.6 | -10.6 |
Euro Currency Futures:
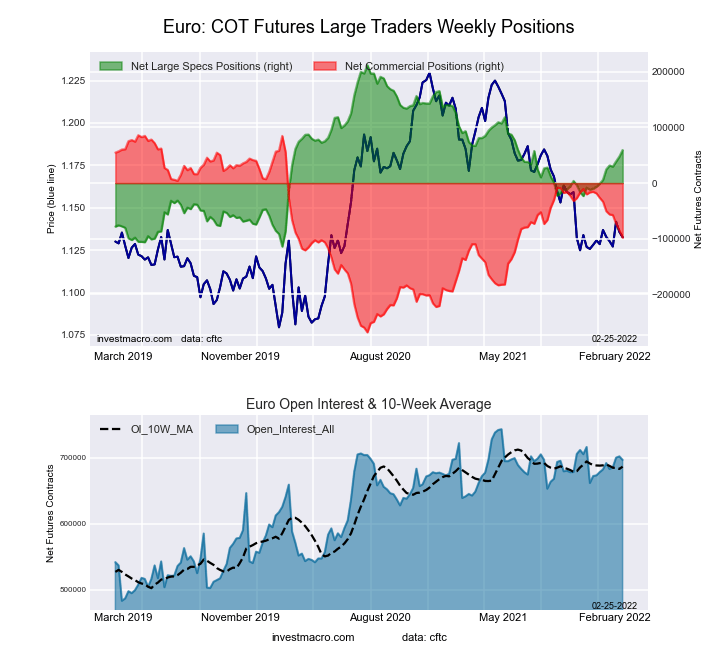 The Euro Currency large speculator standing this week came in at a net position of 59,306 contracts in the data reported through Tuesday. This was a weekly rise of 11,725 contracts from the previous week which had a total of 47,581 net contracts.
This week’s current strength score (the trader positioning range over the past three years, measured from 0 to 100) shows the speculators are currently Bullish with a score of 53.2 percent. The commercials are Bearish with a score of 48.0 percent and the small traders (not shown in chart) are Bearish with a score of 38.6 percent.
| EURO Currency Statistics | SPECULATORS | COMMERCIALS | SMALL TRADERS |
| – Percent of Open Interest Longs: | 30.7 | 54.5 | 12.8 |
| – Percent of Open Interest Shorts: | 22.2 | 68.6 | 7.3 |
| – Net Position: | 59,306 | -98,050 | 38,744 |
| – Gross Longs: | 214,195 | 379,583 | 89,334 |
| – Gross Shorts: | 154,889 | 477,633 | 50,590 |
| – Long to Short Ratio: | 1.4 to 1 | 0.8 to 1 | 1.8 to 1 |
| NET POSITION TREND: | | | |
| – Strength Index Score (3 Year Range Pct): | 53.2 | 48.0 | 38.6 |
| – Strength Index Reading (3 Year Range): | Bullish | Bearish | Bearish |
| NET POSITION MOVEMENT INDEX: | | | |
| – 6-Week Change in Strength Index: | 16.4 | -18.3 | 18.8 |
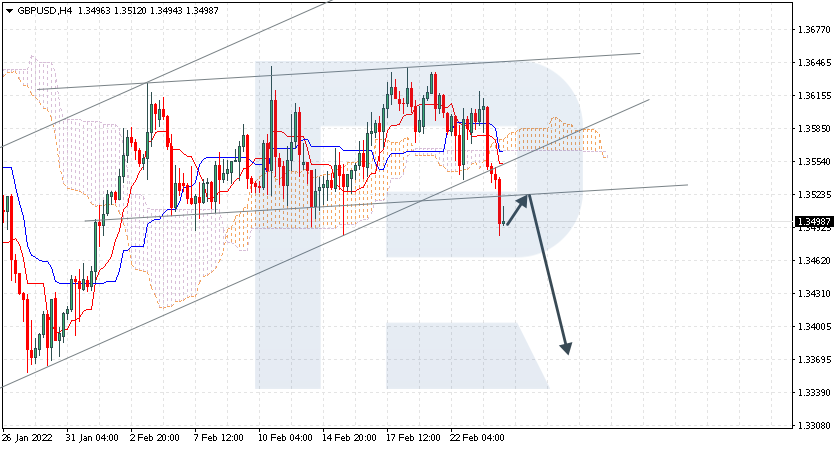
British Pound Sterling Futures:
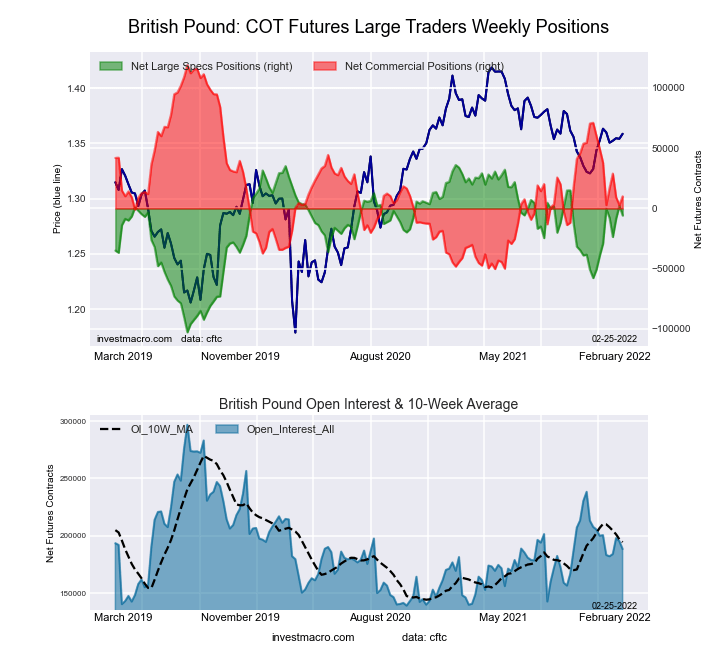 The British Pound Sterling large speculator standing this week came in at a net position of -5,809 contracts in the data reported through Tuesday. This was a weekly lowering of -8,046 contracts from the previous week which had a total of 2,237 net contracts.
This week’s current strength score (the trader positioning range over the past three years, measured from 0 to 100) shows the speculators are currently Bullish with a score of 69.8 percent. The commercials are Bearish with a score of 35.6 percent and the small traders (not shown in chart) are Bearish with a score of 46.8 percent.
| BRITISH POUND Statistics | SPECULATORS | COMMERCIALS | SMALL TRADERS |
| – Percent of Open Interest Longs: | 22.4 | 61.8 | 12.8 |
| – Percent of Open Interest Shorts: | 25.5 | 56.4 | 15.1 |
| – Net Position: | -5,809 | 10,070 | -4,261 |
| – Gross Longs: | 42,249 | 116,372 | 24,154 |
| – Gross Shorts: | 48,058 | 106,302 | 28,415 |
| – Long to Short Ratio: | 0.9 to 1 | 1.1 to 1 | 0.9 to 1 |
| NET POSITION TREND: | | | |
| – Strength Index Score (3 Year Range Pct): | 69.8 | 35.6 | 46.8 |
| – Strength Index Reading (3 Year Range): | Bullish | Bearish | Bearish |
| NET POSITION MOVEMENT INDEX: | | | |
| – 6-Week Change in Strength Index: | 16.8 | -16.5 | 9.5 |
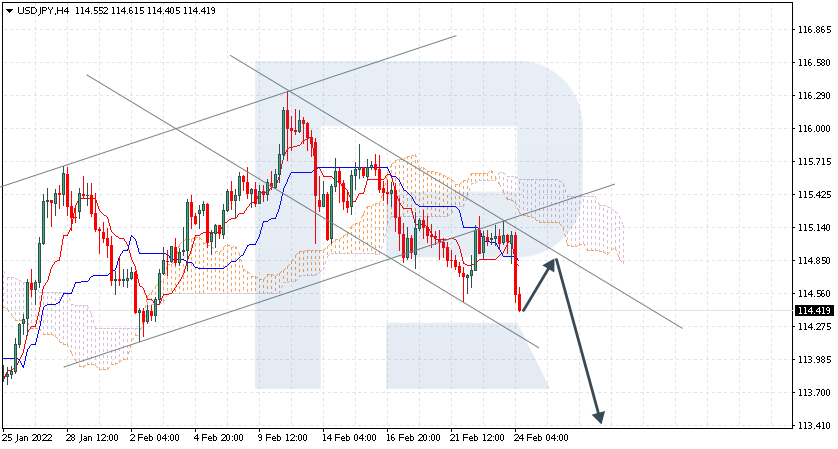
Japanese Yen Futures:
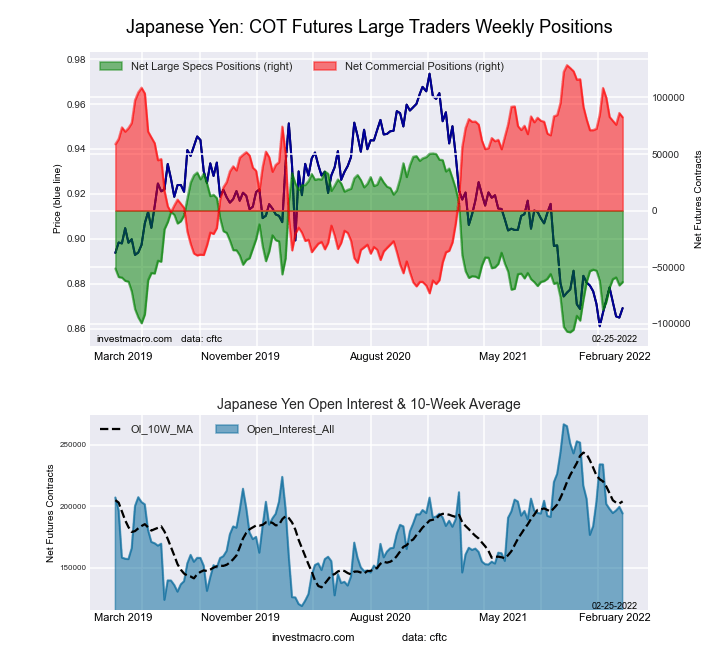 The Japanese Yen large speculator standing this week came in at a net position of -63,187 contracts in the data reported through Tuesday. This was a weekly rise of 2,975 contracts from the previous week which had a total of -66,162 net contracts.
This week’s current strength score (the trader positioning range over the past three years, measured from 0 to 100) shows the speculators are currently Bearish with a score of 28.1 percent. The commercials are Bullish with a score of 77.2 percent and the small traders (not shown in chart) are Bearish-Extreme with a score of 8.1 percent.
| JAPANESE YEN Statistics | SPECULATORS | COMMERCIALS | SMALL TRADERS |
| – Percent of Open Interest Longs: | 5.7 | 83.5 | 9.2 |
| – Percent of Open Interest Shorts: | 38.2 | 41.0 | 19.1 |
| – Net Position: | -63,187 | 82,480 | -19,293 |
| – Gross Longs: | 10,976 | 162,044 | 17,881 |
| – Gross Shorts: | 74,163 | 79,564 | 37,174 |
| – Long to Short Ratio: | 0.1 to 1 | 2.0 to 1 | 0.5 to 1 |
| NET POSITION TREND: | | | |
| – Strength Index Score (3 Year Range Pct): | 28.1 | 77.2 | 8.1 |
| – Strength Index Reading (3 Year Range): | Bearish | Bullish | Bearish-Extreme |
| NET POSITION MOVEMENT INDEX: | | | |
| – 6-Week Change in Strength Index: | 15.4 | -12.8 | 3.4 |
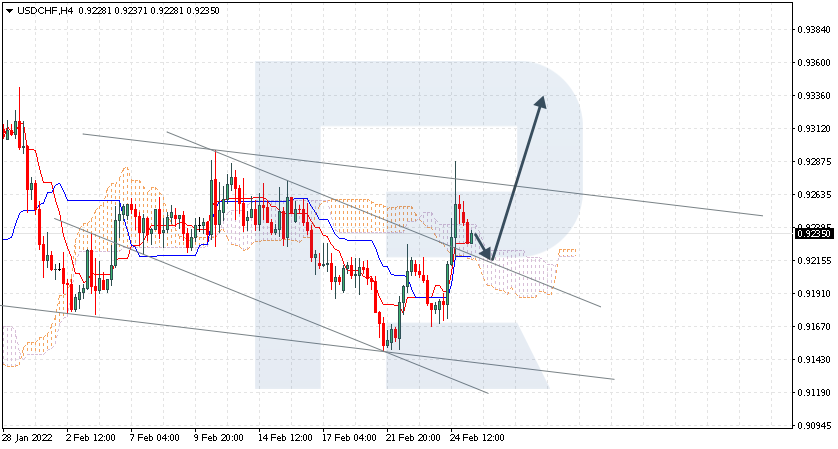
Swiss Franc Futures:
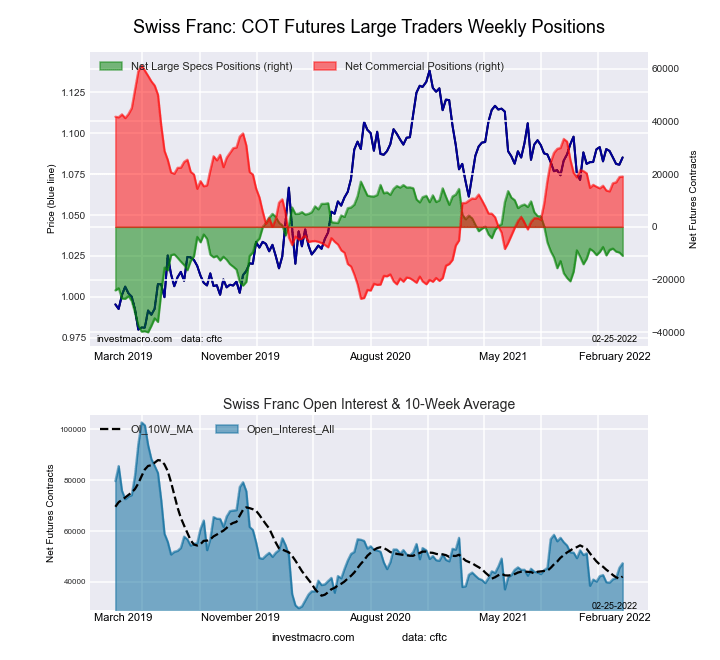 The Swiss Franc large speculator standing this week came in at a net position of -10,987 contracts in the data reported through Tuesday. This was a weekly decline of -1,272 contracts from the previous week which had a total of -9,715 net contracts.
This week’s current strength score (the trader positioning range over the past three years, measured from 0 to 100) shows the speculators are currently Bullish with a score of 50.8 percent. The commercials are Bullish with a score of 52.3 percent and the small traders (not shown in chart) are Bearish with a score of 39.4 percent.
| SWISS FRANC Statistics | SPECULATORS | COMMERCIALS | SMALL TRADERS |
| – Percent of Open Interest Longs: | 8.0 | 71.2 | 20.5 |
| – Percent of Open Interest Shorts: | 31.2 | 30.9 | 37.6 |
| – Net Position: | -10,987 | 19,110 | -8,123 |
| – Gross Longs: | 3,785 | 33,718 | 9,691 |
| – Gross Shorts: | 14,772 | 14,608 | 17,814 |
| – Long to Short Ratio: | 0.3 to 1 | 2.3 to 1 | 0.5 to 1 |
| NET POSITION TREND: | | | |
| – Strength Index Score (3 Year Range Pct): | 50.8 | 52.3 | 39.4 |
| – Strength Index Reading (3 Year Range): | Bullish | Bullish | Bearish |
| NET POSITION MOVEMENT INDEX: | | | |
| – 6-Week Change in Strength Index: | -5.8 | 4.0 | -0.5 |
Canadian Dollar Futures:
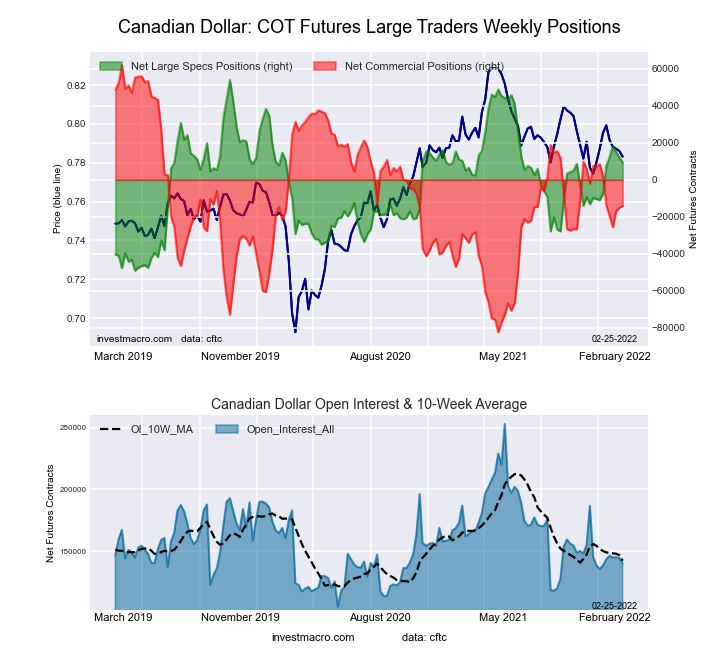 The Canadian Dollar large speculator standing this week came in at a net position of 9,253 contracts in the data reported through Tuesday. This was a weekly lowering of -2,917 contracts from the previous week which had a total of 12,170 net contracts.
This week’s current strength score (the trader positioning range over the past three years, measured from 0 to 100) shows the speculators are currently Bullish with a score of 56.6 percent. The commercials are Bearish with a score of 47.3 percent and the small traders (not shown in chart) are Bearish with a score of 39.5 percent.
| CANADIAN DOLLAR Statistics | SPECULATORS | COMMERCIALS | SMALL TRADERS |
| – Percent of Open Interest Longs: | 34.0 | 41.6 | 21.6 |
| – Percent of Open Interest Shorts: | 27.4 | 51.7 | 18.1 |
| – Net Position: | 9,253 | -14,143 | 4,890 |
| – Gross Longs: | 47,661 | 58,345 | 30,327 |
| – Gross Shorts: | 38,408 | 72,488 | 25,437 |
| – Long to Short Ratio: | 1.2 to 1 | 0.8 to 1 | 1.2 to 1 |
| NET POSITION TREND: | | | |
| – Strength Index Score (3 Year Range Pct): | 56.6 | 47.3 | 39.5 |
| – Strength Index Reading (3 Year Range): | Bullish | Bearish | Bearish |
| NET POSITION MOVEMENT INDEX: | | | |
| – 6-Week Change in Strength Index: | 16.1 | -11.2 | -1.0 |
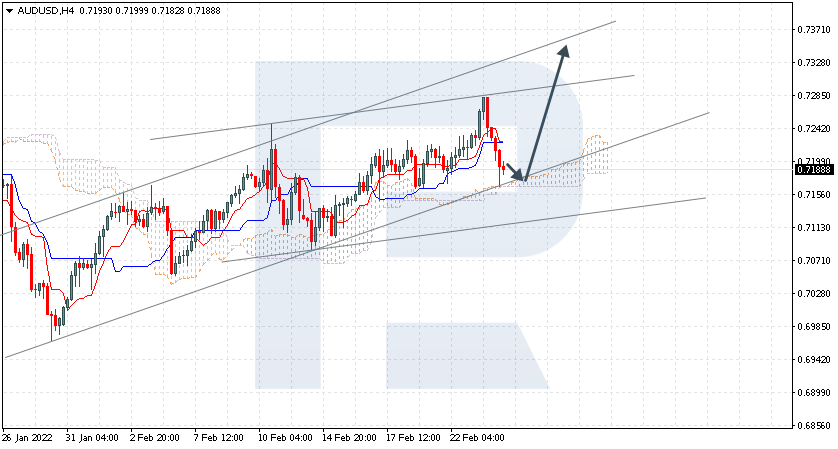
Australian Dollar Futures:
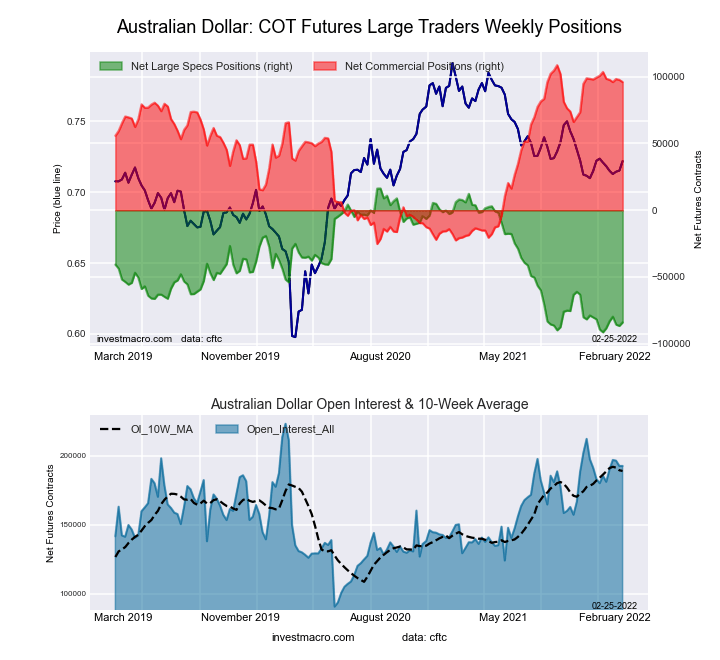 The Australian Dollar large speculator standing this week came in at a net position of -84,080 contracts in the data reported through Tuesday. This was a weekly lift of 2,614 contracts from the previous week which had a total of -86,694 net contracts.
This week’s current strength score (the trader positioning range over the past three years, measured from 0 to 100) shows the speculators are currently Bearish-Extreme with a score of 6.9 percent. The commercials are Bullish-Extreme with a score of 90.6 percent and the small traders (not shown in chart) are Bearish with a score of 23.2 percent.
| AUSTRALIAN DOLLAR Statistics | SPECULATORS | COMMERCIALS | SMALL TRADERS |
| – Percent of Open Interest Longs: | 6.0 | 81.7 | 9.6 |
| – Percent of Open Interest Shorts: | 49.7 | 31.9 | 15.8 |
| – Net Position: | -84,080 | 96,072 | -11,992 |
| – Gross Longs: | 11,553 | 157,416 | 18,459 |
| – Gross Shorts: | 95,633 | 61,344 | 30,451 |
| – Long to Short Ratio: | 0.1 to 1 | 2.6 to 1 | 0.6 to 1 |
| NET POSITION TREND: | | | |
| – Strength Index Score (3 Year Range Pct): | 6.9 | 90.6 | 23.2 |
| – Strength Index Reading (3 Year Range): | Bearish-Extreme | Bullish-Extreme | Bearish |
| NET POSITION MOVEMENT INDEX: | | | |
| – 6-Week Change in Strength Index: | 6.9 | -5.6 | 0.3 |
New Zealand Dollar Futures:
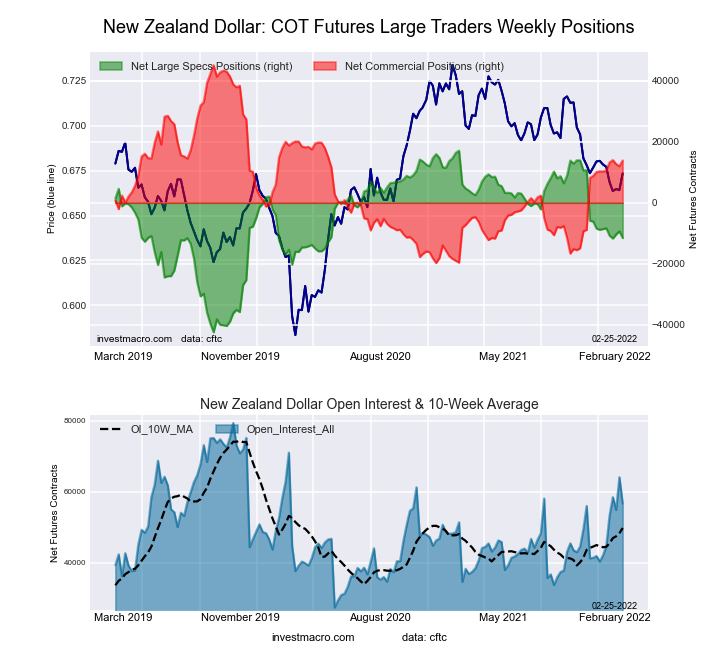 The New Zealand Dollar large speculator standing this week came in at a net position of -11,551 contracts in the data reported through Tuesday. This was a weekly reduction of -2,218 contracts from the previous week which had a total of -9,333 net contracts.
This week’s current strength score (the trader positioning range over the past three years, measured from 0 to 100) shows the speculators are currently Bullish with a score of 51.9 percent. The commercials are Bullish with a score of 51.8 percent and the small traders (not shown in chart) are Bearish with a score of 24.8 percent.
| NEW ZEALAND DOLLAR Statistics | SPECULATORS | COMMERCIALS | SMALL TRADERS |
| – Percent of Open Interest Longs: | 30.6 | 62.6 | 4.6 |
| – Percent of Open Interest Shorts: | 51.0 | 38.1 | 8.8 |
| – Net Position: | -11,551 | 13,908 | -2,357 |
| – Gross Longs: | 17,343 | 35,481 | 2,608 |
| – Gross Shorts: | 28,894 | 21,573 | 4,965 |
| – Long to Short Ratio: | 0.6 to 1 | 1.6 to 1 | 0.5 to 1 |
| NET POSITION TREND: | | | |
| – Strength Index Score (3 Year Range Pct): | 51.9 | 51.8 | 24.8 |
| – Strength Index Reading (3 Year Range): | Bullish | Bullish | Bearish |
| NET POSITION MOVEMENT INDEX: | | | |
| – 6-Week Change in Strength Index: | -4.9 | 5.6 | -7.5 |
Mexican Peso Futures:
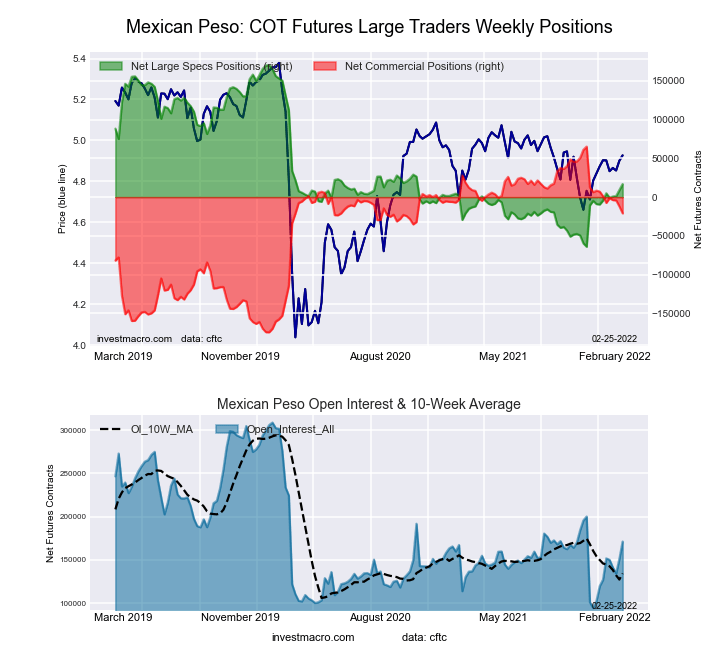 The Mexican Peso large speculator standing this week came in at a net position of 16,825 contracts in the data reported through Tuesday. This was a weekly lift of 7,851 contracts from the previous week which had a total of 8,974 net contracts.
This week’s current strength score (the trader positioning range over the past three years, measured from 0 to 100) shows the speculators are currently Bearish with a score of 34.5 percent. The commercials are Bullish with a score of 64.0 percent and the small traders (not shown in chart) are Bullish with a score of 60.9 percent.
| MEXICAN PESO Statistics | SPECULATORS | COMMERCIALS | SMALL TRADERS |
| – Percent of Open Interest Longs: | 42.5 | 53.0 | 4.1 |
| – Percent of Open Interest Shorts: | 32.7 | 65.3 | 1.7 |
| – Net Position: | 16,825 | -21,038 | 4,213 |
| – Gross Longs: | 72,846 | 90,784 | 7,091 |
| – Gross Shorts: | 56,021 | 111,822 | 2,878 |
| – Long to Short Ratio: | 1.3 to 1 | 0.8 to 1 | 2.5 to 1 |
| NET POSITION TREND: | | | |
| – Strength Index Score (3 Year Range Pct): | 34.5 | 64.0 | 60.9 |
| – Strength Index Reading (3 Year Range): | Bearish | Bullish | Bullish |
| NET POSITION MOVEMENT INDEX: | | | |
| – 6-Week Change in Strength Index: | 9.1 | -9.3 | 4.2 |
Brazilian Real Futures:
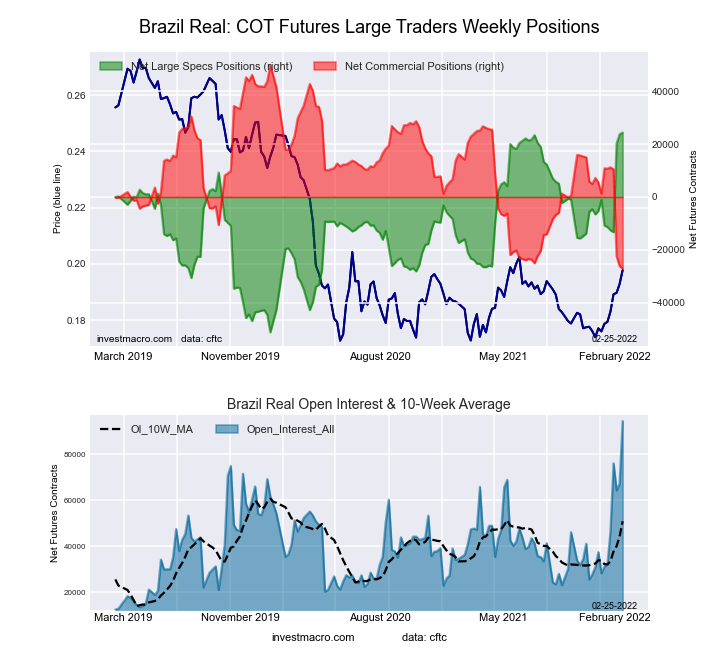 The Brazilian Real large speculator standing this week came in at a net position of 24,445 contracts in the data reported through Tuesday. This was a weekly lift of 685 contracts from the previous week which had a total of 23,760 net contracts.
This week’s current strength score (the trader positioning range over the past three years, measured from 0 to 100) shows the speculators are currently Bullish-Extreme with a score of 100.0 percent. The commercials are Bearish-Extreme with a score of 0.0 percent and the small traders (not shown in chart) are Bullish-Extreme with a score of 97.0 percent.
| BRAZIL REAL Statistics | SPECULATORS | COMMERCIALS | SMALL TRADERS |
| – Percent of Open Interest Longs: | 55.0 | 40.2 | 4.8 |
| – Percent of Open Interest Shorts: | 29.1 | 68.9 | 2.0 |
| – Net Position: | 24,445 | -27,081 | 2,636 |
| – Gross Longs: | 51,990 | 38,039 | 4,541 |
| – Gross Shorts: | 27,545 | 65,120 | 1,905 |
| – Long to Short Ratio: | 1.9 to 1 | 0.6 to 1 | 2.4 to 1 |
| NET POSITION TREND: | | | |
| – Strength Index Score (3 Year Range Pct): | 100.0 | 0.0 | 97.0 |
| – Strength Index Reading (3 Year Range): | Bullish-Extreme | Bearish-Extreme | Bullish-Extreme |
| NET POSITION MOVEMENT INDEX: | | | |
| – 6-Week Change in Strength Index: | 46.6 | -49.2 | 31.8 |
Russian Ruble Futures:
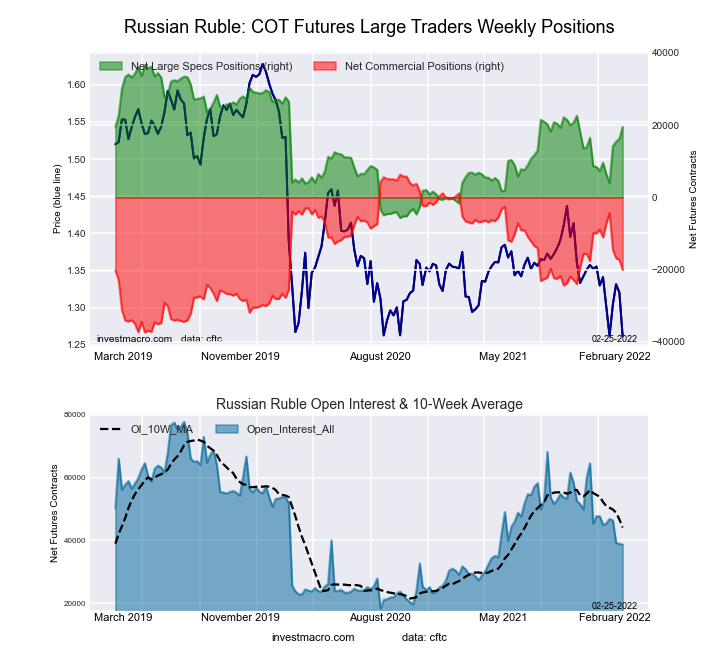 The Russian Ruble large speculator standing this week came in at a net position of 19,517 contracts in the data reported through Tuesday. This was a weekly lift of 3,353 contracts from the previous week which had a total of 16,164 net contracts.
This week’s current strength score (the trader positioning range over the past three years, measured from 0 to 100) shows the speculators are currently Bullish with a score of 59.6 percent. The commercials are Bearish with a score of 39.6 percent and the small traders (not shown in chart) are Bearish with a score of 49.1 percent.
| RUSSIAN RUBLE Statistics | SPECULATORS | COMMERCIALS | SMALL TRADERS |
| – Percent of Open Interest Longs: | 58.5 | 35.9 | 5.6 |
| – Percent of Open Interest Shorts: | 8.0 | 87.8 | 4.2 |
| – Net Position: | 19,517 | -20,053 | 536 |
| – Gross Longs: | 22,625 | 13,895 | 2,152 |
| – Gross Shorts: | 3,108 | 33,948 | 1,616 |
| – Long to Short Ratio: | 7.3 to 1 | 0.4 to 1 | 1.3 to 1 |
| NET POSITION TREND: | | | |
| – Strength Index Score (3 Year Range Pct): | 59.6 | 39.6 | 49.1 |
| – Strength Index Reading (3 Year Range): | Bullish | Bearish | Bearish |
| NET POSITION MOVEMENT INDEX: | | | |
| – 6-Week Change in Strength Index: | 23.4 | -20.6 | -25.0 |
Bitcoin Futures:
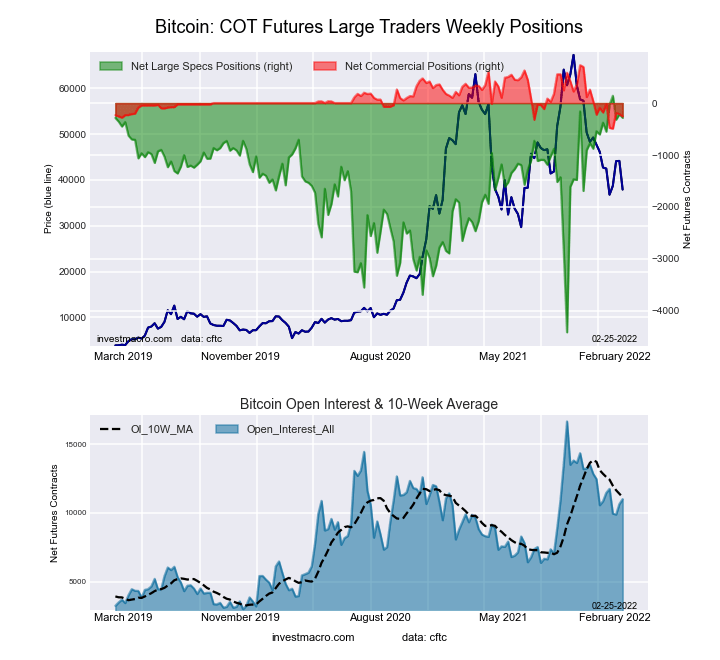 The Bitcoin large speculator standing this week came in at a net position of -283 contracts in the data reported through Tuesday. This was a weekly lowering of -68 contracts from the previous week which had a total of -215 net contracts.
This week’s current strength score (the trader positioning range over the past three years, measured from 0 to 100) shows the speculators are currently Bullish-Extreme with a score of 90.7 percent. The commercials are Bearish-Extreme with a score of 19.3 percent and the small traders (not shown in chart) are Bearish with a score of 25.2 percent.
| BITCOIN Statistics | SPECULATORS | COMMERCIALS | SMALL TRADERS |
| – Percent of Open Interest Longs: | 77.2 | 2.9 | 12.2 |
| – Percent of Open Interest Shorts: | 79.8 | 5.3 | 7.3 |
| – Net Position: | -283 | -256 | 539 |
| – Gross Longs: | 8,501 | 322 | 1,338 |
| – Gross Shorts: | 8,784 | 578 | 799 |
| – Long to Short Ratio: | 1.0 to 1 | 0.6 to 1 | 1.7 to 1 |
| NET POSITION TREND: | | | |
| – Strength Index Score (3 Year Range Pct): | 90.7 | 19.3 | 25.2 |
| – Strength Index Reading (3 Year Range): | Bullish-Extreme | Bearish-Extreme | Bearish |
| NET POSITION MOVEMENT INDEX: | | | |
| – 6-Week Change in Strength Index: | 2.1 | -6.1 | -0.5 |
Article By InvestMacro – Receive our weekly COT Reports by Email
*COT Report: The COT data, released weekly to the public each Friday, is updated through the most recent Tuesday (data is 3 days old) and shows a quick view of how large speculators or non-commercials (for-profit traders) were positioned in the futures markets.
The CFTC categorizes trader positions according to commercial hedgers (traders who use futures contracts for hedging as part of the business), non-commercials (large traders who speculate to realize trading profits) and nonreportable traders (usually small traders/speculators) as well as their open interest (contracts open in the market at time of reporting).See CFTC criteria here.


