Archive for Forex and Currency News – Page 16

US Dollar faces pivotal week: politics and economic data in focus

By RoboForex Analytical Department 

EUR/USD opened the week steady, trading near 1.1418, as markets brace for a series of key economic reports and political developments.

Markets eye trade talks and macro indicators

Investor sentiment remains cautiously optimistic ahead of the US-China trade meeting, set to take place in London today, following President Donald Trump’s announcement last week. Hopes for progress in trade negotiations are helping stabilise the market mood.

On the economic front, a heavy data calendar lies ahead. Markets are closely watching the release of several US macroeconomic indicators:

  • Consumer Price Index (CPI) on Wednesday
  • Producer Price Index (PPI) and the University of Michigan Consumer Sentiment Index on Friday

These reports are expected to provide clearer insights into the effects of tariffs on inflation and the overall direction of the US economy.

Last Friday, the US dollar gained strength following an upbeat employment report for May, which showed stronger-than-expected job growth. However, the broader picture remains mixed, with recent readings on private employment, unemployment claims, and the services PMI pointing to ongoing economic fragility.

Technical analysis of EUR/USD

On the H4 chart, EUR/USD has reached the growth wave target at 1.1494. A correction phase is currently unfolding, with the first target at 1.1365. After touching this level, a rebound to 1.1438 is possible. This could be followed by a new downward wave towards 1.1275, with a longer-term prospect of a decline to 1.1210. The MACD indicator supports this scenario, with its signal line above zero but pointing sharply downwards, indicating a shift towards bearish momentum.

On the H1 chart, the pair has completed the first downward wave, reaching a local target at 1.1372. A corrective bounce to 1.1438 (a test from below) is now on the radar. This move will determine whether EUR/USD resumes its upward correction or extends its decline.


Conclusion

EUR/USD is entering a critical week, with US economic data and trade talks in the spotlight. A corrective move to 1.1438 appears likely in the short term, but further downside towards 1.1365, 1.1275, and 1.1210 remains on the table depending on data outcomes and broader risk sentiment. Technical indicators suggest a shift in momentum, with consolidation and correction likely before the next directional move.


Disclaimer

Any forecasts contained herein are based on the author’s particular opinion. This analysis may not be treated as trading advice. RoboForex bears no responsibility for trading results based on trading recommendations and reviews contained herein.

US Dollar Index Bets see slight rebound back into Bullish Level

By InvestMacro

Speculators OI FX Futures COT Chart


Here are the latest charts and statistics for the Commitment of Traders (COT) data published by the Commodities Futures Trading Commission (CFTC).

The latest COT data is updated through Tuesday June 3rd and shows a quick view of how large market participants (for-profit speculators and commercial traders) were positioned in the futures markets. All currency positions are in direct relation to the US dollar where, for example, a bet for the euro is a bet that the euro will rise versus the dollar while a bet against the euro will be a bet that the euro will decline versus the dollar.

Weekly Speculator Changes led by Euro & Mexican Peso

Speculators Nets FX Futures COT Chart
The COT currency market speculator bets were overall lower this week as four out of the eleven currency markets we cover had higher positioning while the other seven markets had lower speculator contracts.

Leading the gains for the currency markets was the EuroFX (3,290 contracts), the Mexican Peso (3,047 contracts), the New Zealand Dollar (712 contracts) and the US Dollar Index (703 contracts) also showing positive weeks.

The currencies seeing declines in speculator bets on the week were the Brazilian Real (-16,046 contracts), the Japanese Yen (-12,863 contracts), the Canadian Dollar (-4,548 contracts), the Australian Dollar (-1,975 contracts), the Swiss Franc (-583 contracts), the British Pound (-164 contracts) and with Bitcoin (-38 contracts) also registering lower bets on the week.

US Dollar Index Bets see slight rebound back into Bullish Level

Highlighting the Currency Speculator data this week, was a bounce back into bullish territory for the U.S. Dollar Index. This week’s data marks the first bullish level in the past seven weeks as speculators have now advanced their weekly bullish bets modestly for a fourth straight week.

The U.S. Dollar has been on the defensive against most of the other major currencies this year and the Dollar Index price has fallen under the significant psychological level of 100.00 for the first time since July of 2023. The U.S. Dollar is currently down approximately 10% since the beginning of the new year coinciding with a dip in speculator sentiment as well.

Roundup: Currency Speculator Positioning

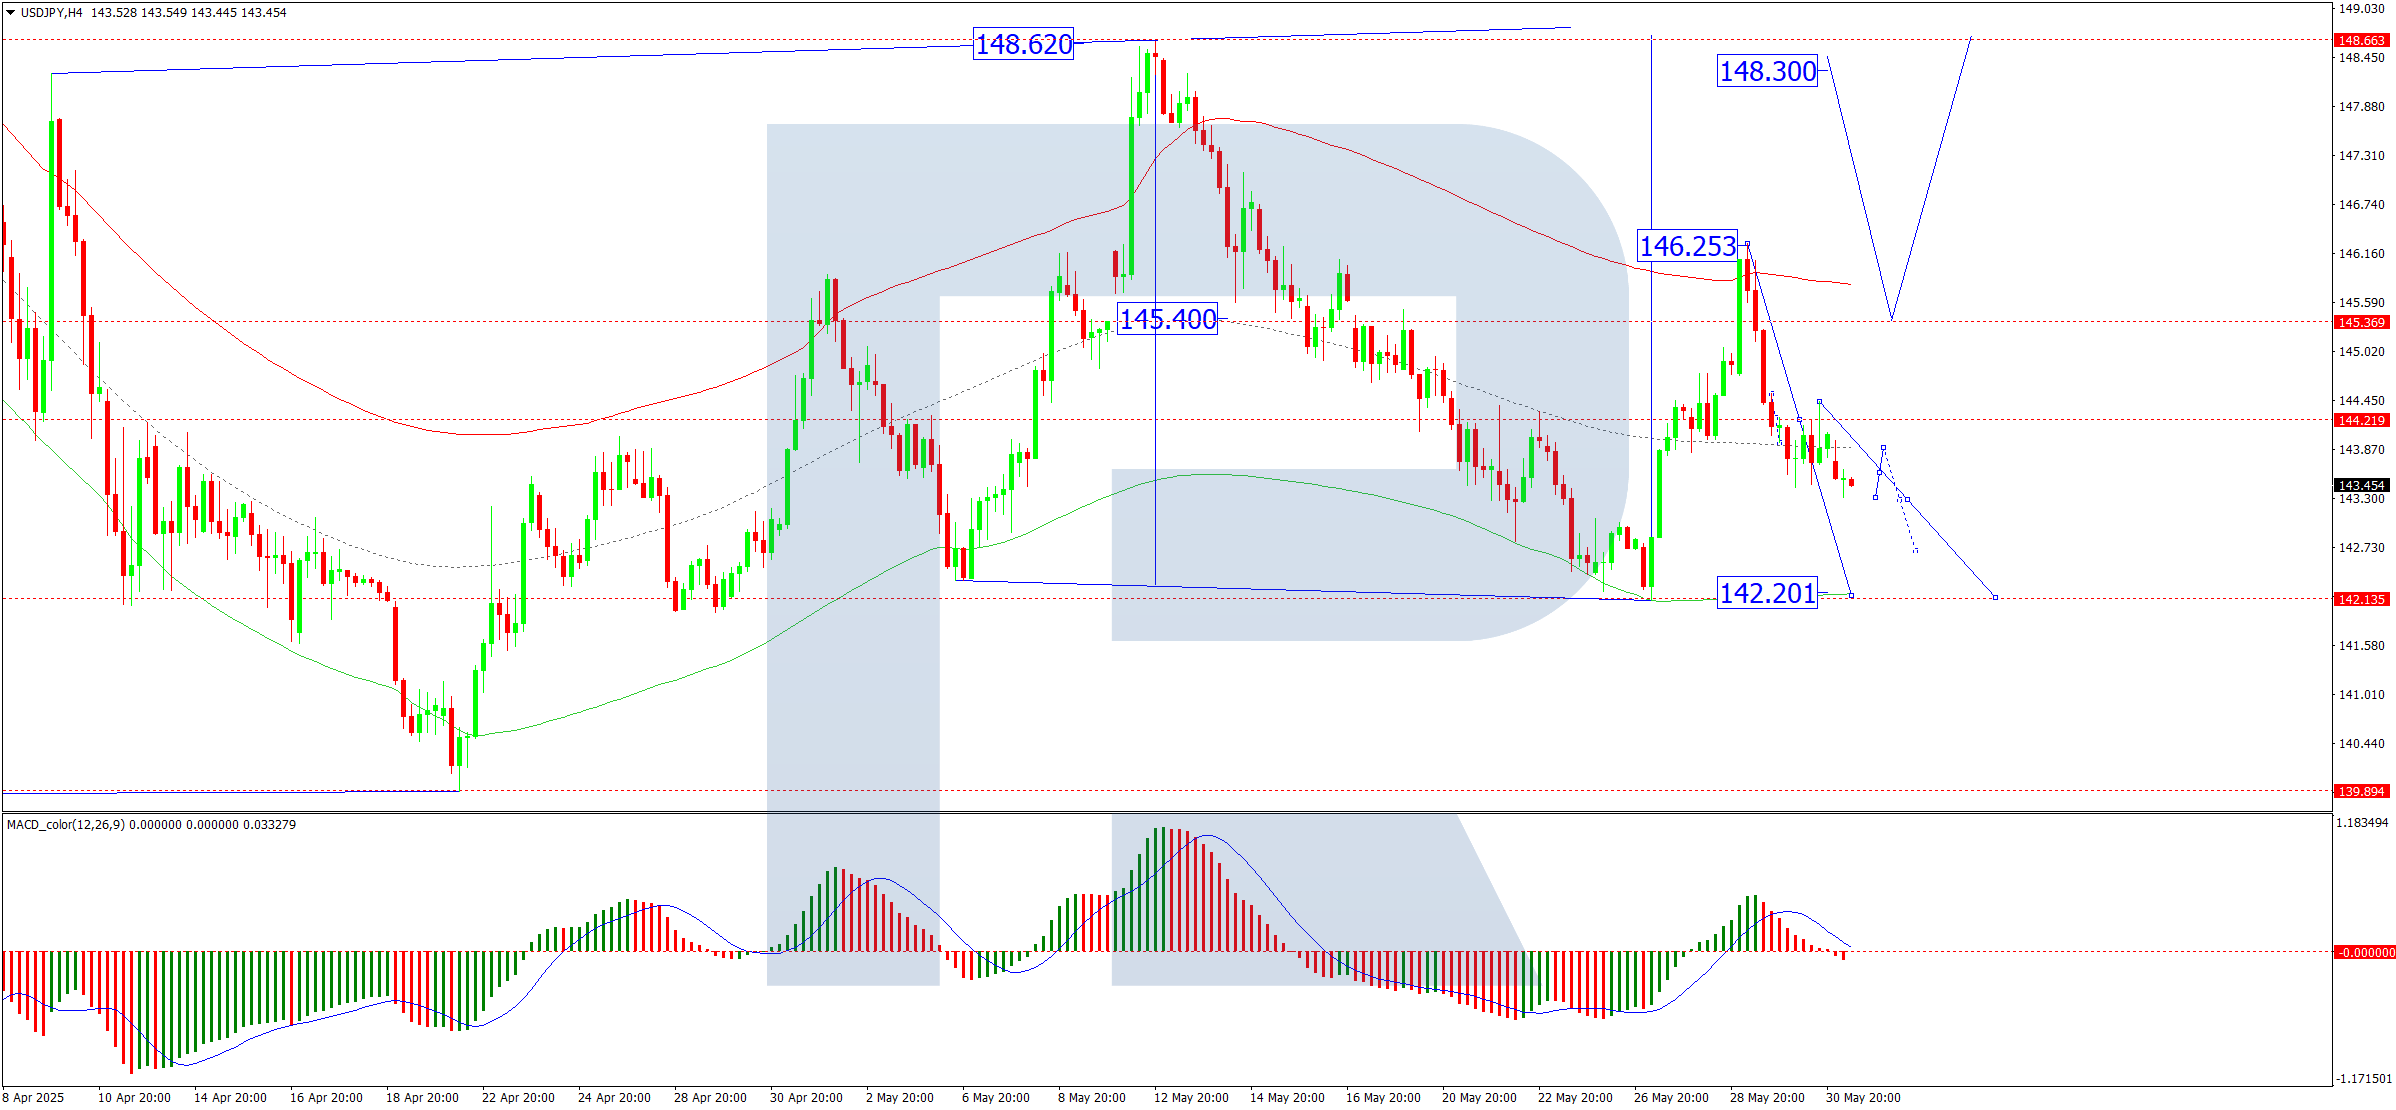
  • Japanese Yen: – Speculators pulled back somewhat sharply in the latest data (-12,863 contracts). The yen continues to have an extreme bullish strength score with the speculator position near the top of its range of over +151,000 net contracts.
  • Brazilian Real: – Speculators dropped their bullish bets also relatively sharply in the latest data. The BRL is coming off of a record high speculator position in the past couple of months.
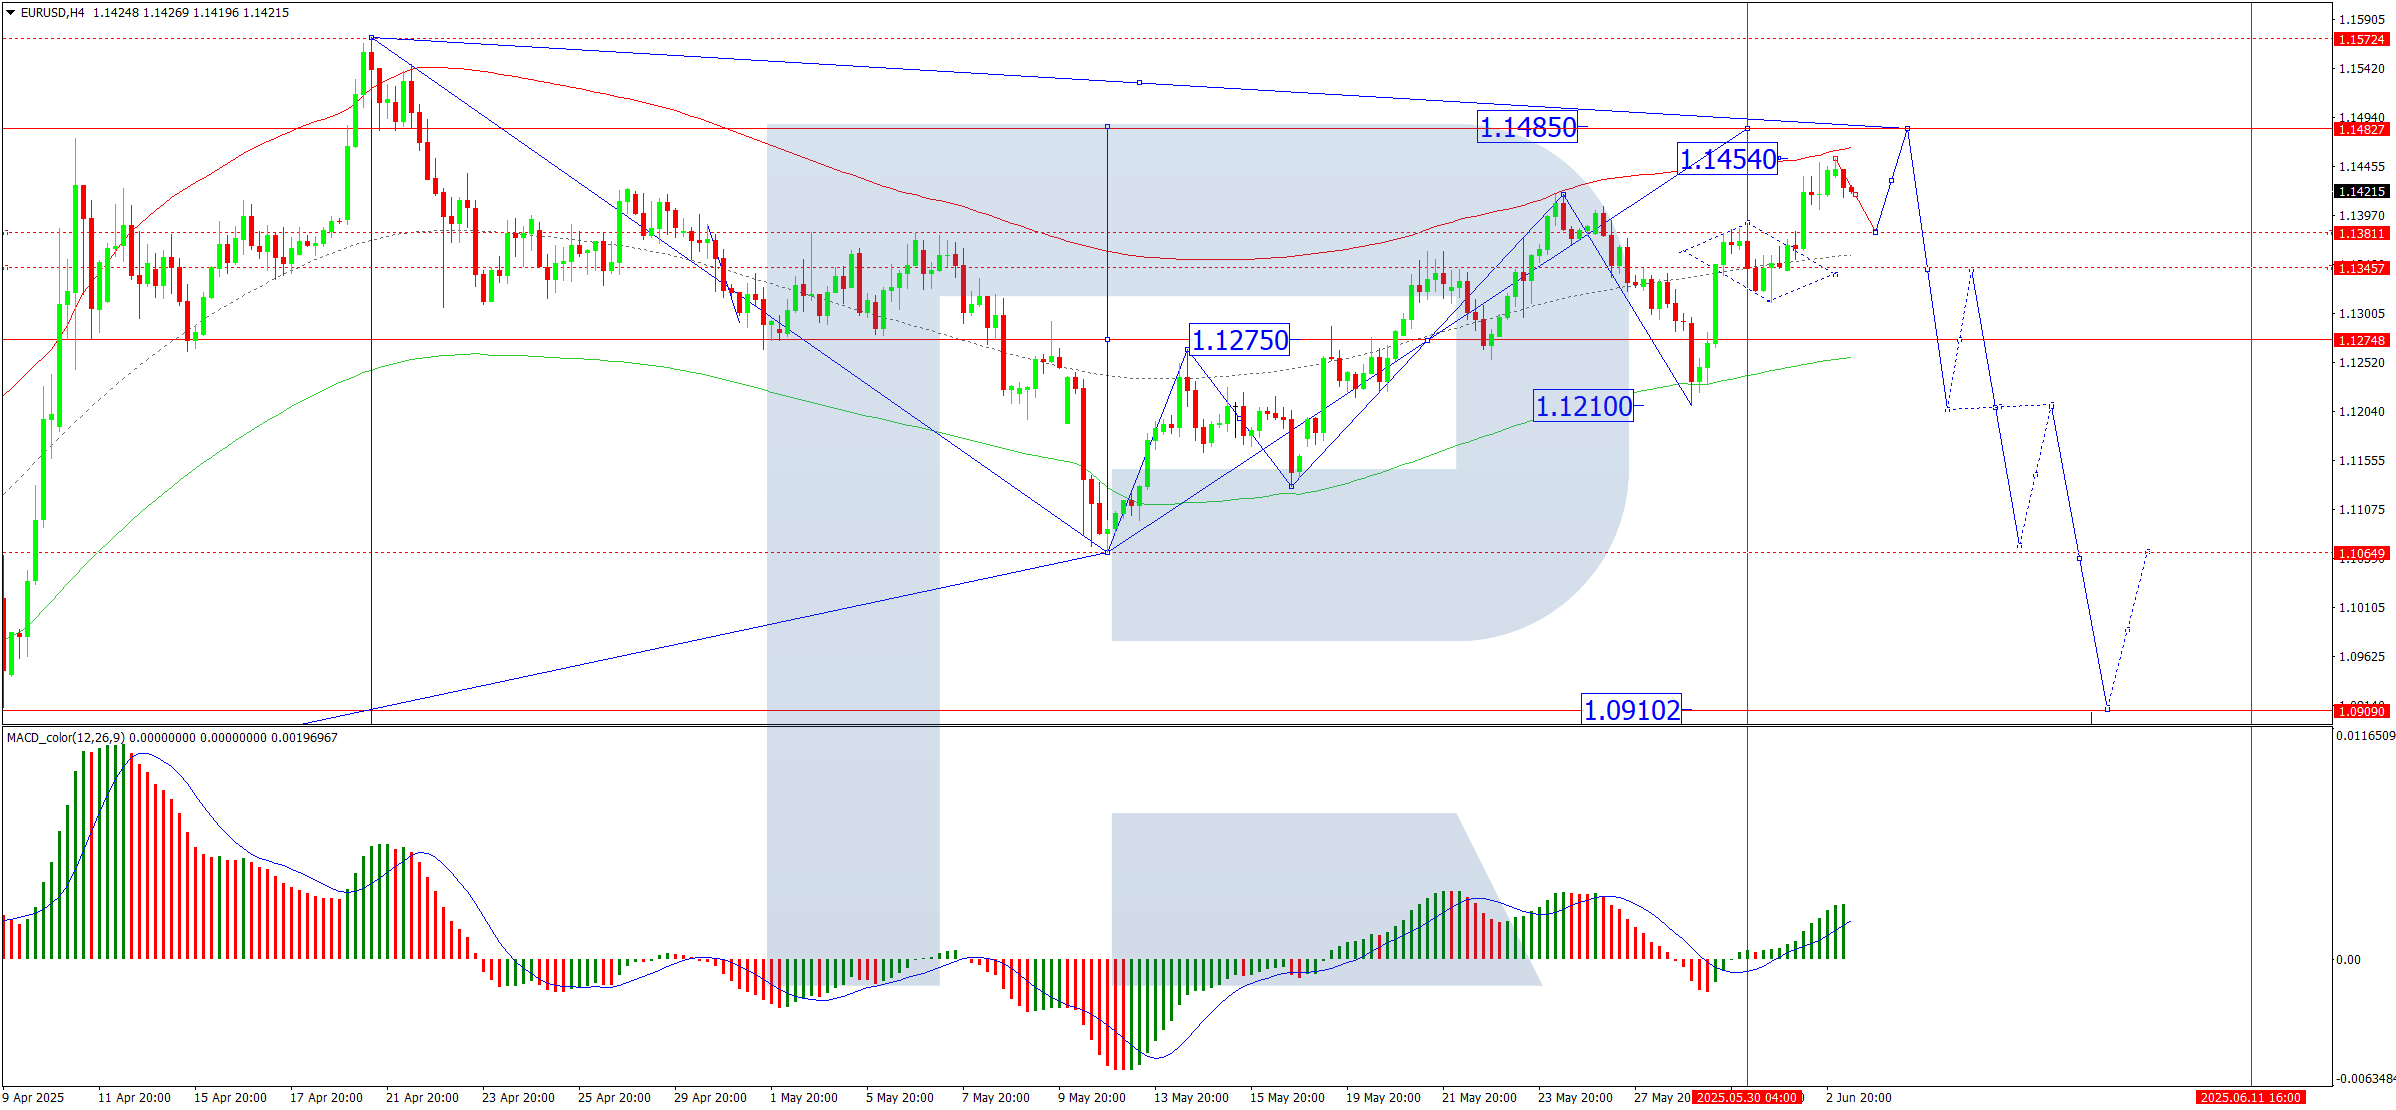
  • Euro: – The 2nd most bullish currency (after the yen) with a net position of over 80,000 contracts. The Euro has advanced by over 11% this year and the price trend has been mostly consolidating between the 1.12 – 1.15 area in recent weeks.
  • Mexican Peso: – The Peso continues to be in a bullish position, near +65,000 contracts after a gain of 3,000 contracts this week.
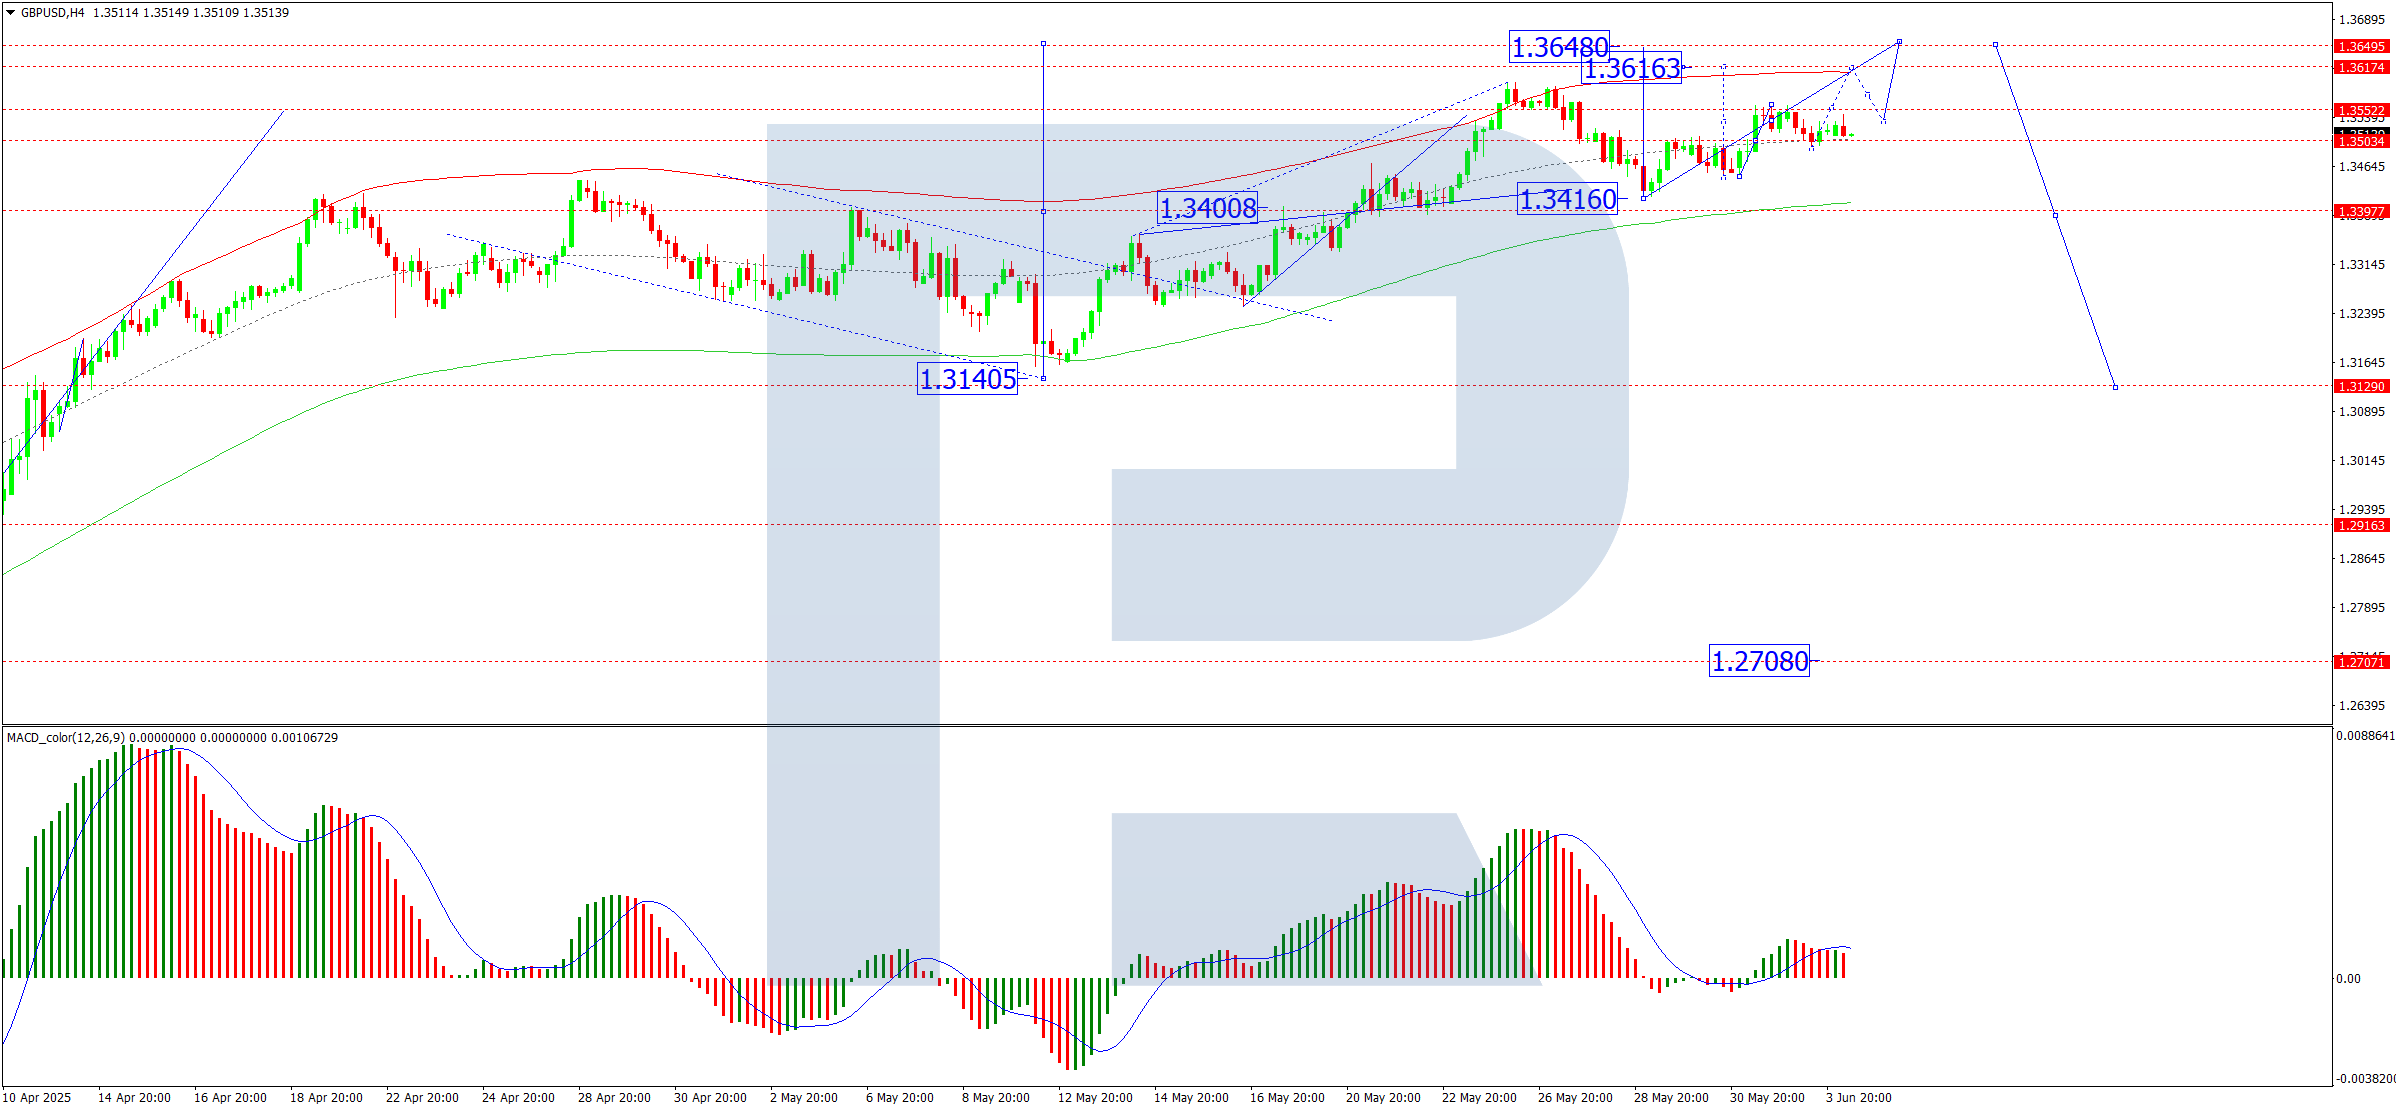
  • British Pound Sterling: Rounds out the bullish currencies with a +35,000 net speculator contract position. The GBP has gained by over 10% this year and is now trading at the highest level since 2022 above 1.3500.
  • Swiss Franc: The CHF remains in a bearish net position despite the strength of its currency which has risen over 10% this year. The CHF trades near the highest levels since 2015.
  • New Zealand and Australian Dollars: – These currencies continue to have negative net speculator positions, although both currencies have seen their prices on the uptrend since the beginning of the new year.

Currency Markets 5-Day Price Performance:

– The Brazilian Real rose by over 2.35% in the past 5 days.
– The Mexican Peso was up by 1.5%.
– The Swiss Franc, the Canadian Dollar, the Euro, the British Pound, the New Zealand Dollar and the Australian Dollar all were higher by less than 1%.
– The US Dollar Index was virtually unchanged with a small decline on the week.
– Bitcoin was also virtually unchanged, while the Japanese Yen fell by -0.5%.


Currencies Data:

Speculators FX Futures COT Data Table
Legend: Open Interest | Speculators Current Net Position | Weekly Specs Change | Specs Strength Score compared to last 3-Years (0-100 range)


Strength Scores led by Japanese Yen & Brazilian Real

Speculators Strength Scores FX Futures COT Chart
COT Strength Scores (a normalized measure of Speculator positions over a 3-Year range, from 0 to 100 where above 80 is Extreme-Bullish and below 20 is Extreme-Bearish) showed that the Japanese Yen (92 percent) and the Brazilian Real (70 percent) lead the currency markets this week. The Mexican Peso (62 percent) and the EuroFX (60 percent) come in as the next highest in the weekly strength scores.

On the downside, the Bitcoin (1 percent) and the US Dollar Index (8 percent) come in at the lowest strength levels currently and are in Extreme-Bearish territory (below 20 percent). The next lowest strength scores are the Australian Dollar (31 percent) and the New Zealand Dollar (37 percent).

3-Year Strength Statistics:
US Dollar Index (8.0 percent) vs US Dollar Index previous week (6.5 percent)
EuroFX (60.3 percent) vs EuroFX previous week (59.0 percent)
British Pound Sterling (49.1 percent) vs British Pound Sterling previous week (49.2 percent)
Japanese Yen (92.3 percent) vs Japanese Yen previous week (95.8 percent)
Swiss Franc (48.1 percent) vs Swiss Franc previous week (49.3 percent)
Canadian Dollar (39.4 percent) vs Canadian Dollar previous week (41.4 percent)
Australian Dollar (31.5 percent) vs Australian Dollar previous week (32.9 percent)
New Zealand Dollar (37.1 percent) vs New Zealand Dollar previous week (36.3 percent)
Mexican Peso (61.6 percent) vs Mexican Peso previous week (60.1 percent)
Brazilian Real (69.5 percent) vs Brazilian Real previous week (82.6 percent)
Bitcoin (0.9 percent) vs Bitcoin previous week (1.7 percent)


Mexican Peso, GBP & EuroFX top the 6-Week Strength Trends

Speculators Trends FX Futures COT Chart
COT Strength Score Trends (or move index, calculates the 6-week changes in strength scores) showed that the Mexican Peso (12 percent) and the EuroFX (7 percent) lead the past six weeks trends for the currencies. The British Pound (7 percent), the New Zealand Dollar (4 percent) and the US Dollar Index (3 percent) are the next highest positive movers in the 3-Year trends data.

Bitcoin (-33 percent) leads the downside trend scores currently with the Canadian Dollar (-18 percent), Brazilian Real (-15 percent) and the Japanese Yen (-7 percent) following next with lower trend scores.

3-Year Strength Trends:
US Dollar Index (3.3 percent) vs US Dollar Index previous week (-4.0 percent)
EuroFX (6.8 percent) vs EuroFX previous week (3.9 percent)
British Pound Sterling (7.0 percent) vs British Pound Sterling previous week (13.7 percent)
Japanese Yen (-7.3 percent) vs Japanese Yen previous week (-2.2 percent)
Swiss Franc (-1.2 percent) vs Swiss Franc previous week (6.3 percent)
Canadian Dollar (-18.5 percent) vs Canadian Dollar previous week (-9.0 percent)
Australian Dollar (-6.1 percent) vs Australian Dollar previous week (-1.7 percent)
New Zealand Dollar (3.7 percent) vs New Zealand Dollar previous week (10.0 percent)
Mexican Peso (11.9 percent) vs Mexican Peso previous week (14.3 percent)
Brazilian Real (-15.5 percent) vs Brazilian Real previous week (-1.8 percent)
Bitcoin (-32.9 percent) vs Bitcoin previous week (-62.4 percent)


Individual COT Forex Markets:

US Dollar Index Futures:

US Dollar Index Forex Futures COT ChartThe US Dollar Index large speculator standing this week equaled a net position of 617 contracts in the data reported through Tuesday. This was a weekly lift of 703 contracts from the previous week which had a total of -86 net contracts.

This week’s current strength score (the trader positioning range over the past three years, measured from 0 to 100) shows the speculators are currently Bearish-Extreme with a score of 8.0 percent. The commercials are Bullish-Extreme with a score of 96.0 percent and the small traders (not shown in chart) are Bearish-Extreme with a score of 8.8 percent.

Price Trend-Following Model: Downtrend

Our weekly trend-following model classifies the current market price position as: Downtrend.

US DOLLAR INDEX StatisticsSPECULATORSCOMMERCIALSSMALL TRADERS
– Percent of Open Interest Longs:56.228.67.6
– Percent of Open Interest Shorts:54.025.213.2
– Net Position:617968-1,585
– Gross Longs:15,7488,0212,123
– Gross Shorts:15,1317,0533,708
– Long to Short Ratio:1.0 to 11.1 to 10.6 to 1
NET POSITION TREND:
– Strength Index Score (3 Year Range Pct):8.096.08.8
– Strength Index Reading (3 Year Range):Bearish-ExtremeBullish-ExtremeBearish-Extreme
NET POSITION MOVEMENT INDEX:
– 6-Week Change in Strength Index:3.3-2.0-7.8


Euro Currency Futures:

Euro Currency Futures COT ChartThe Euro Currency large speculator standing this week equaled a net position of 82,764 contracts in the data reported through Tuesday. This was a weekly advance of 3,290 contracts from the previous week which had a total of 79,474 net contracts.

This week’s current strength score (the trader positioning range over the past three years, measured from 0 to 100) shows the speculators are currently Bullish with a score of 60.3 percent. The commercials are Bearish with a score of 34.1 percent and the small traders (not shown in chart) are Bullish-Extreme with a score of 96.6 percent.

Price Trend-Following Model: Uptrend

Our weekly trend-following model classifies the current market price position as: Uptrend.

EURO Currency StatisticsSPECULATORSCOMMERCIALSSMALL TRADERS
– Percent of Open Interest Longs:26.056.012.9
– Percent of Open Interest Shorts:15.473.75.8
– Net Position:82,764-138,28555,521
– Gross Longs:202,786437,677100,625
– Gross Shorts:120,022575,96245,104
– Long to Short Ratio:1.7 to 10.8 to 12.2 to 1
NET POSITION TREND:
– Strength Index Score (3 Year Range Pct):60.334.196.6
– Strength Index Reading (3 Year Range):BullishBearishBullish-Extreme
NET POSITION MOVEMENT INDEX:
– 6-Week Change in Strength Index:6.8-6.95.8


British Pound Sterling Futures:

British Pound Sterling Futures COT ChartThe British Pound Sterling large speculator standing this week equaled a net position of 35,215 contracts in the data reported through Tuesday. This was a weekly decrease of -164 contracts from the previous week which had a total of 35,379 net contracts.

This week’s current strength score (the trader positioning range over the past three years, measured from 0 to 100) shows the speculators are currently Bearish with a score of 49.1 percent. The commercials are Bearish with a score of 43.6 percent and the small traders (not shown in chart) are Bullish-Extreme with a score of 91.1 percent.

Price Trend-Following Model: Uptrend

Our weekly trend-following model classifies the current market price position as: Uptrend.

BRITISH POUND StatisticsSPECULATORSCOMMERCIALSSMALL TRADERS
– Percent of Open Interest Longs:44.431.915.8
– Percent of Open Interest Shorts:29.352.99.9
– Net Position:35,215-48,96513,750
– Gross Longs:103,67274,58836,963
– Gross Shorts:68,457123,55323,213
– Long to Short Ratio:1.5 to 10.6 to 11.6 to 1
NET POSITION TREND:
– Strength Index Score (3 Year Range Pct):49.143.691.1
– Strength Index Reading (3 Year Range):BearishBearishBullish-Extreme
NET POSITION MOVEMENT INDEX:
– 6-Week Change in Strength Index:7.0-9.718.5


Japanese Yen Futures:

Japanese Yen Forex Futures COT ChartThe Japanese Yen large speculator standing this week equaled a net position of 151,149 contracts in the data reported through Tuesday. This was a weekly decrease of -12,863 contracts from the previous week which had a total of 164,012 net contracts.

This week’s current strength score (the trader positioning range over the past three years, measured from 0 to 100) shows the speculators are currently Bullish-Extreme with a score of 92.3 percent. The commercials are Bearish-Extreme with a score of 6.7 percent and the small traders (not shown in chart) are Bullish-Extreme with a score of 100.0 percent.

Price Trend-Following Model: Uptrend

Our weekly trend-following model classifies the current market price position as: Uptrend.

JAPANESE YEN StatisticsSPECULATORSCOMMERCIALSSMALL TRADERS
– Percent of Open Interest Longs:51.827.412.2
– Percent of Open Interest Shorts:10.575.35.5
– Net Position:151,149-175,50824,359
– Gross Longs:189,514100,15144,497
– Gross Shorts:38,365275,65920,138
– Long to Short Ratio:4.9 to 10.4 to 12.2 to 1
NET POSITION TREND:
– Strength Index Score (3 Year Range Pct):92.36.7100.0
– Strength Index Reading (3 Year Range):Bullish-ExtremeBearish-ExtremeBullish-Extreme
NET POSITION MOVEMENT INDEX:
– 6-Week Change in Strength Index:-7.36.42.8


Swiss Franc Futures:

Swiss Franc Forex Futures COT ChartThe Swiss Franc large speculator standing this week equaled a net position of -26,066 contracts in the data reported through Tuesday. This was a weekly decline of -583 contracts from the previous week which had a total of -25,483 net contracts.

This week’s current strength score (the trader positioning range over the past three years, measured from 0 to 100) shows the speculators are currently Bearish with a score of 48.1 percent. The commercials are Bearish with a score of 41.7 percent and the small traders (not shown in chart) are Bullish with a score of 79.5 percent.

Price Trend-Following Model: Uptrend

Our weekly trend-following model classifies the current market price position as: Uptrend.

SWISS FRANC StatisticsSPECULATORSCOMMERCIALSSMALL TRADERS
– Percent of Open Interest Longs:8.863.818.9
– Percent of Open Interest Shorts:40.832.018.7
– Net Position:-26,06625,884182
– Gross Longs:7,14551,87915,409
– Gross Shorts:33,21125,99515,227
– Long to Short Ratio:0.2 to 12.0 to 11.0 to 1
NET POSITION TREND:
– Strength Index Score (3 Year Range Pct):48.141.779.5
– Strength Index Reading (3 Year Range):BearishBearishBullish
NET POSITION MOVEMENT INDEX:
– 6-Week Change in Strength Index:-1.2-1.46.1


Canadian Dollar Futures:

Canadian Dollar Forex Futures COT ChartThe Canadian Dollar large speculator standing this week equaled a net position of -108,446 contracts in the data reported through Tuesday. This was a weekly decrease of -4,548 contracts from the previous week which had a total of -103,898 net contracts.

This week’s current strength score (the trader positioning range over the past three years, measured from 0 to 100) shows the speculators are currently Bearish with a score of 39.4 percent. The commercials are Bullish with a score of 60.5 percent and the small traders (not shown in chart) are Bearish with a score of 37.7 percent.

Price Trend-Following Model: Strong Uptrend

Our weekly trend-following model classifies the current market price position as: Strong Uptrend.

CANADIAN DOLLAR StatisticsSPECULATORSCOMMERCIALSSMALL TRADERS
– Percent of Open Interest Longs:6.979.58.9
– Percent of Open Interest Shorts:47.138.59.7
– Net Position:-108,446110,625-2,179
– Gross Longs:18,667214,70423,967
– Gross Shorts:127,113104,07926,146
– Long to Short Ratio:0.1 to 12.1 to 10.9 to 1
NET POSITION TREND:
– Strength Index Score (3 Year Range Pct):39.460.537.7
– Strength Index Reading (3 Year Range):BearishBullishBearish
NET POSITION MOVEMENT INDEX:
– 6-Week Change in Strength Index:-18.515.910.9


Australian Dollar Futures:

Australian Dollar Forex Futures COT Chart
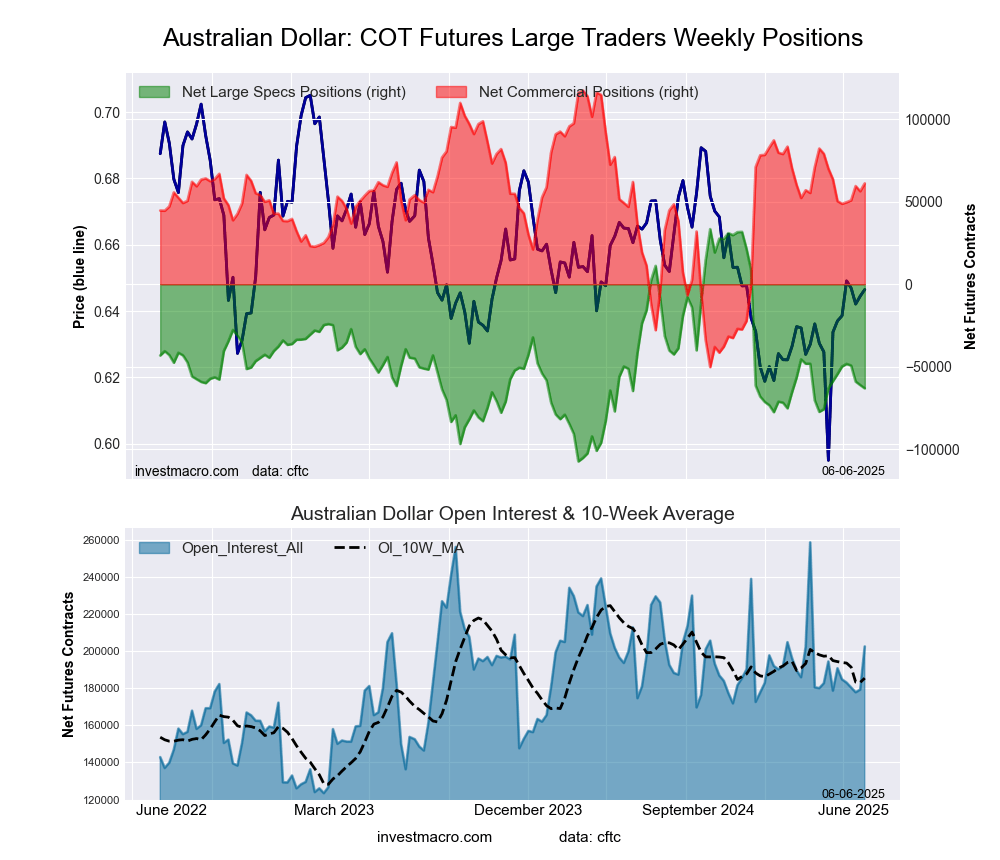
The Australian Dollar large speculator standing this week equaled a net position of -63,155 contracts in the data reported through Tuesday. This was a weekly decline of -1,975 contracts from the previous week which had a total of -61,180 net contracts.

This week’s current strength score (the trader positioning range over the past three years, measured from 0 to 100) shows the speculators are currently Bearish with a score of 31.5 percent. The commercials are Bullish with a score of 66.4 percent and the small traders (not shown in chart) are Bullish with a score of 54.3 percent.

Price Trend-Following Model: Strong Uptrend

Our weekly trend-following model classifies the current market price position as: Strong Uptrend.

AUSTRALIAN DOLLAR StatisticsSPECULATORSCOMMERCIALSSMALL TRADERS
– Percent of Open Interest Longs:11.864.511.5
– Percent of Open Interest Shorts:43.034.310.5
– Net Position:-63,15561,1951,960
– Gross Longs:23,969130,73523,307
– Gross Shorts:87,12469,54021,347
– Long to Short Ratio:0.3 to 11.9 to 11.1 to 1
NET POSITION TREND:
– Strength Index Score (3 Year Range Pct):31.566.454.3
– Strength Index Reading (3 Year Range):BearishBullishBullish
NET POSITION MOVEMENT INDEX:
– 6-Week Change in Strength Index:-6.16.4-5.8


New Zealand Dollar Futures:

New Zealand Dollar Forex Futures COT ChartThe New Zealand Dollar large speculator standing this week equaled a net position of -23,674 contracts in the data reported through Tuesday. This was a weekly gain of 712 contracts from the previous week which had a total of -24,386 net contracts.

This week’s current strength score (the trader positioning range over the past three years, measured from 0 to 100) shows the speculators are currently Bearish with a score of 37.1 percent. The commercials are Bullish with a score of 60.7 percent and the small traders (not shown in chart) are Bullish with a score of 54.4 percent.

Price Trend-Following Model: Strong Uptrend

Our weekly trend-following model classifies the current market price position as: Strong Uptrend.

NEW ZEALAND DOLLAR StatisticsSPECULATORSCOMMERCIALSSMALL TRADERS
– Percent of Open Interest Longs:14.075.86.5
– Percent of Open Interest Shorts:48.941.16.4
– Net Position:-23,67423,60173
– Gross Longs:9,53151,5144,419
– Gross Shorts:33,20527,9134,346
– Long to Short Ratio:0.3 to 11.8 to 11.0 to 1
NET POSITION TREND:
– Strength Index Score (3 Year Range Pct):37.160.754.4
– Strength Index Reading (3 Year Range):BearishBullishBullish
NET POSITION MOVEMENT INDEX:
– 6-Week Change in Strength Index:3.7-4.38.0


Mexican Peso Futures:

Mexican Peso Futures COT ChartThe Mexican Peso large speculator standing this week equaled a net position of 64,449 contracts in the data reported through Tuesday. This was a weekly advance of 3,047 contracts from the previous week which had a total of 61,402 net contracts.

This week’s current strength score (the trader positioning range over the past three years, measured from 0 to 100) shows the speculators are currently Bullish with a score of 61.6 percent. The commercials are Bearish with a score of 39.8 percent and the small traders (not shown in chart) are Bearish with a score of 36.6 percent.

Price Trend-Following Model: Strong Uptrend

Our weekly trend-following model classifies the current market price position as: Strong Uptrend.

MEXICAN PESO StatisticsSPECULATORSCOMMERCIALSSMALL TRADERS
– Percent of Open Interest Longs:55.432.73.6
– Percent of Open Interest Shorts:17.272.42.1
– Net Position:64,449-66,9462,497
– Gross Longs:93,40155,1986,108
– Gross Shorts:28,952122,1443,611
– Long to Short Ratio:3.2 to 10.5 to 11.7 to 1
NET POSITION TREND:
– Strength Index Score (3 Year Range Pct):61.639.836.6
– Strength Index Reading (3 Year Range):BullishBearishBearish
NET POSITION MOVEMENT INDEX:
– 6-Week Change in Strength Index:11.9-12.67.3


Brazilian Real Futures:

Brazil Real Futures COT ChartThe Brazilian Real large speculator standing this week equaled a net position of 30,793 contracts in the data reported through Tuesday. This was a weekly lowering of -16,046 contracts from the previous week which had a total of 46,839 net contracts.

This week’s current strength score (the trader positioning range over the past three years, measured from 0 to 100) shows the speculators are currently Bullish with a score of 69.5 percent. The commercials are Bearish with a score of 29.4 percent and the small traders (not shown in chart) are Bearish with a score of 38.5 percent.

Price Trend-Following Model: Strong Uptrend

Our weekly trend-following model classifies the current market price position as: Strong Uptrend.

BRAZIL REAL StatisticsSPECULATORSCOMMERCIALSSMALL TRADERS
– Percent of Open Interest Longs:64.330.94.7
– Percent of Open Interest Shorts:28.370.61.0
– Net Position:30,793-33,9193,126
– Gross Longs:54,95426,4034,014
– Gross Shorts:24,16160,322888
– Long to Short Ratio:2.3 to 10.4 to 14.5 to 1
NET POSITION TREND:
– Strength Index Score (3 Year Range Pct):69.529.438.5
– Strength Index Reading (3 Year Range):BullishBearishBearish
NET POSITION MOVEMENT INDEX:
– 6-Week Change in Strength Index:-15.514.27.5


Bitcoin Futures:

Bitcoin Crypto Futures COT ChartThe Bitcoin large speculator standing this week equaled a net position of -2,312 contracts in the data reported through Tuesday. This was a weekly decrease of -38 contracts from the previous week which had a total of -2,274 net contracts.

This week’s current strength score (the trader positioning range over the past three years, measured from 0 to 100) shows the speculators are currently Bearish-Extreme with a score of 0.9 percent. The commercials are Bullish-Extreme with a score of 100.0 percent and the small traders (not shown in chart) are Bullish with a score of 56.1 percent.

Price Trend-Following Model: Strong Uptrend

Our weekly trend-following model classifies the current market price position as: Strong Uptrend.

BITCOIN StatisticsSPECULATORSCOMMERCIALSSMALL TRADERS
– Percent of Open Interest Longs:80.98.14.5
– Percent of Open Interest Shorts:88.71.53.3
– Net Position:-2,3121,949363
– Gross Longs:24,0842,4071,341
– Gross Shorts:26,396458978
– Long to Short Ratio:0.9 to 15.3 to 11.4 to 1
NET POSITION TREND:
– Strength Index Score (3 Year Range Pct):0.9100.056.1
– Strength Index Reading (3 Year Range):Bearish-ExtremeBullish-ExtremeBullish
NET POSITION MOVEMENT INDEX:
– 6-Week Change in Strength Index:-32.929.88.8


Article By InvestMacroReceive our weekly COT Newsletter

*COT Report: The COT data, released weekly to the public each Friday, is updated through the most recent Tuesday (data is 3 days old) and shows a quick view of how large speculators or non-commercials (for-profit traders) were positioned in the futures markets.

The CFTC categorizes trader positions according to commercial hedgers (traders who use futures contracts for hedging as part of the business), non-commercials (large traders who speculate to realize trading profits) and nonreportable traders (usually small traders/speculators) as well as their open interest (contracts open in the market at time of reporting). See CFTC criteria here.

Week Ahead: USDJPY set for volatile price swings?

By ForexTime

  • Yen expected to be the most volatile in G10 space vs USD
  • Ongoing US-Japan talks, geopolitics & data could rock JPY
  • Over the past year US CPI triggered moves of ↑ 0.7% & ↓ 1.7%
  • Bloomberg FX model: USDJPY has 72% of trading within 141.26 – 146.52 over 1-week period
  • Technical level: 142.30 & 145.00

Even as we await the US jobs report later today (Friday, 6 June), investors are keenly aware of the string of key data points over the coming week.

The Japanese Yen is expected to be the most volatile G10 currency versus the USD over the next one-week.

Imagen
JPY vol

This could be based on ongoing US-Japan trade talks, geopolitical risk and high-impact economic data.

And these key data releases from major economies could present fresh trading opportunities in the week ahead:

Sunday, 7th June 

  • CNH: China forex reserves
  • EUR: ECB President Christine Lagarde speech
  • JPY: BOJ Deputy Governor Shinichi Uchida speech
  • Fed’s pre-decision communications blackout

Monday, 9th June 

  • CN50: China trade, CPI, PPI
  • JPY: Japan GDP (final), current account
  • TWN: Taiwan trade
  • RUS2000: US wholesale inventories

Tuesday, 10th June 

  • AUD: Australia Westpac consumer confidence, NAB business confidence
  • JPY: Japan money stock
  • ZAR: South Africa manufacturing
  • GBP: UK jobless claims, unemployment

Wednesday, 11th June

  • JPY: Japan PPI
  • USDInd: US May CPI, federal budget balance
  • GBP: UK government spending review 2025

Thursday, 12th June

  • UK100: Monthly GDP, UK industrial production, trade
  • US500: US PPI, jobless claims

Friday, 13th June

  • EU50: Eurozone industrial production
  • GER40: Germany CPI
  • JPY: Japan tertiary industry, industrial production (final)
  • NZD: New Zealand Business manufacturing PMI
  • USDInd: US University of Michigan consumer sentiment

At the time of writing, the Yen is the worst-performing G10 currency versus the USD month-to-date, barely moving against the greenback.

Indeed, prices have been trapped within a range on the daily timeframe with support at 142.30 and resistance at 145.00. 

Imagen
USDJPY 34

A breakout could be on the horizon, but this may require a fresh fundamental catalyst. 

Here is what you need to know:


1) Ongoing US-Japan trade talks

Japan and the United States have been engaged in trade talks since mid-April following Trump’s liberation day tariffs.

The country has been hit with a 25% tariff on autos and parts, a 10% universal tariff that will rise to 24% in early July, in addition to Trump’s 50% tariff on steel and aluminum. 

This week, Japan’s top trade negotiator met with US Commerce Secretary Howard Lutnick.

  • Any positive news or signs that a deal could be reached may boost sentiment toward the Japanese economy, supporting the Yen.
  • Should talks drag on with no sign of a deal being reached, this fuel concerns over Japan’s economic outlook – hitting the Yen as a result.


2) BoJ deputy governor speech + Japan economic data

Over the weekend, a speech by the BoJ deputy governor may provide some clues about future policy moves. 

To be clear, the incoming data from Japan will be the most finalized estimates, so this market reaction may be muted. However, any major upside or downside surprises could spark some action and influence BoJ rate expectations.

Traders are currently pricing in a 70% probability of a 25-basis point BoJ hike by the end of 2025.

3) US May CPI report

The May Consumer Price Index (CPI) that will be published on Wednesday, 11th June, could influence Fed cut bets.

Markets are forecasting: 

  • CPI year-on-year (May 2024 vs. May 2025) is expected to rise 2.5% from 2.3%.
  • Core CPI year-on-year to rise 2.9% from 2.8%.
  • CPI month-on-month (May 2025 vs April 2025) to remain unchanged at 0.2%
  • Core CPI month-on-month to rise 0.3% from 0.2% in the prior month

Over the past 12 months, the US CPI has triggered upside moves of as much as 0.7% or declines of 1.7% in a 6-hour window post-release.

  • A hotter-than-expected US CPI print could push the USDJPY higher as Fed cut bets cool.
  • Should the inflation report print below forecasts, this may drag the USDJPY lower.

Traders are currently pricing in 2 Fed rate cuts by the end of 2025, with the odds of a third one at 20%.

4) Technical forces

The USDJPY remains in a range on the daily charts with key support at 142.30 and resistance at 145.00. Prices are trading below the 200, 100 and 50-day SMA.

  • A breakout and daily close above the 50-day SMA at 144.60, may open a path toward 145.00 and 146.52– the upper limit of the Bloomberg FX model.
  • Sustained weakness below 143.00 could trigger a selloff back toward support at 142.30 and 141.26 – the lower limit of the Bloomberg FX model.
Imagen
USDJPY 6

Bloomberg’s FX model forecasts a 72% chance that USDJPY will trade within the 141.26 – 146.52 range, using current levels as a base, over the next one-week period.


Forex-Time-LogoArticle by ForexTime

ForexTime Ltd (FXTM) is an award winning international online forex broker regulated by CySEC 185/12 www.forextime.com

Japanese yen weakens as markets await US employment data

By RoboForex Analytical Department

The USD/JPY pair rose to 143.80 on  Friday, marking a second consecutive day of yen depreciation. The decline comes as traders adopt a wait-and-see stance ahead of a key report on US employment figures.

Market cautious ahead of NFP; political factors also in play

Investors are focused on the imminent US non-farm payrolls (NFP) report, which may influence expectations regarding the Federal Reserve’s next policy move. In the meantime, the market has turned cautious, favouring the US dollar.

Political developments have also contributed. US President Donald Trump and Chinese President Xi Jinping held a telephone conversation and agreed to continue trade negotiations. However, no concrete outcomes or details were disclosed, offering only limited clarity to the geopolitical picture.

Weak domestic data adds pressure on the yen

On the domestic front, Japan posted an unexpected decline in consumer spending for April. Household spending fell by 0.1% y/y, reversing the 1.4% growth in March and missing the 1.0% increase forecast. The drop highlights the impact of rising prices on domestic demand, adding to uncertainty over the pace of the Bank of Japan’s (BoJ) monetary tightening.

Nonetheless, BoJ Governor Kazuo Ueda reiterated that the central bank remains prepared to raise interest rates if the economic and inflation outlook warrants it. The BoJ continues to pursue a measured yet steady approach to policy normalisation.

Technical analysis of USD/JPY

On the H4 chart, USD/JPY continues to consolidate around 143.33. The current move is heading towards 144.23. A downward breakout from this range would pave the way for a decline to 142.20, with a possible extension to 140.50. Conversely, an upward breakout could trigger a bullish move towards 146.25. The MACD indicator supports this scenario, with its signal line below zero and pointing sharply upwards, indicating growing bullish potential.

On the H1 chart, the market is forming a broad consolidation range around 143.33. The structure features a completed growth wave to 143.96, followed by a correction (test from above) to 143.33. The next likely move is an upward push to 144.23, expected to occur today. This may then be followed by a decline to 142.20 and potentially further to 140.50. The Stochastic oscillator supports this setup, with its signal line above 50 and trending towards 80, indicating strong short-term buying pressure.

Conclusion

The yen remains under pressure amid cautious market positioning ahead of US labour data and lingering trade-related uncertainty. Meanwhile, weak Japanese spending data raises questions over the timing of the next BoJ rate hike. Technically, 144.23 is the next key resistance, while 142.20 and 140.50 serve as potential support levels in the event of a reversal. The market’s direction will likely hinge on the outcome of the US NFP report.


Disclaimer

Any forecasts contained herein are based on the author’s particular opinion. This analysis may not be treated as trading advice. RoboForex bears no responsibility for trading results based on trading recommendations and reviews contained herein.

GBP/USD holds near three-year high as pound shows resilience

By RoboForex Analytical Department 

The GBP/USD pair remains steady around 1.3515, maintaining its strength after reaching a three-year high on 26 May. The British pound has shown greater stability than other major currencies amid rising geopolitical and economic pressures.

Pound supported by global tensions and domestic optimism

Ongoing trade tensions between the US and China continue to weigh on market sentiment, indirectly supporting the pound. President Donald Trump’s decision to double tariffs on steel and aluminium triggered an intense backlash from China, which accused the US of breaching the recent trade deal and threatened to retaliate.

At the same time, optimism about the British economy is helping to sustain demand for the pound. The International Monetary Fund (IMF) upgraded the UK’s 2025 growth forecast to 1.2% from 1.1%. However, it also warned Chancellor Rachel Reeves of the need to exercise strict fiscal discipline ahead of her budget presentation on 11 June.

Inflation remains elevated, particularly in the food sector, where prices rose by 4.1% in May – the highest increase since February 2024. According to Kantar, this has prompted UK consumers to seek more discounts and shift towards cheaper brands.

Due to persistent inflation, the market is currently pricing in only a 40-basis-point rate cut from the Bank of England this year.

Technical analysis of GBP/USD

On the H4 chart, GBP/USD continues to develop the fifth wave of growth towards 1.3648. The market is consolidating near 1.3515 and is expected to break upwards towards 1.3616, with the wave potentially extending to 1.3648. If the market breaks downwards, a further correction to 1.3400 is possible before resuming growth. The MACD indicator confirms the bullish scenario, with its signal line above zero and pointing firmly upwards.

On the H1 chart, GBP/USD formed a consolidation range around 1.3515 and broke upwards, nearly hitting the local target of 1.3559. The market is now undergoing a correction, targeting 1.3489. Once this pullback is complete, the next growth wave may reach 1.3583. The Stochastic oscillator supports this view, with its signal line below 50 and heading sharply downwards towards 20, suggesting room for a short-term dip before renewed upward momentum.

Conclusion

GBP/USD remains firm near multi-year highs, supported by a mix of global trade tensions, domestic economic optimism, and elevated inflation. Technically, the outlook remains bullish, with key targets at 1.3583, 1.3616 and 1.3648. Support levels are at 1.3489 and 1.3400 in the event of a pullback. The pound’s relative stability continues to position it as one of the more resilient major currencies in the current environment.


Disclaimer

Any forecasts contained herein are based on the author’s particular opinion. This analysis may not be treated as trading advice. RoboForex bears no responsibility for trading results based on trading recommendations and reviews contained herein.

EUR/USD set to rise as sentiment turns against the US dollar

By RoboForex Analytical Department

The EUR/USD pair rose to 1.1418 before pausing, as bearish sentiment towards the US dollar intensified following the release of disappointing US macroeconomic data and escalating trade tensions.

The dollar is under pressure from weak data and trade uncertainty

The dollar came under renewed pressure after the release of weaker-than-expected US manufacturing activity data for May, which pointed to a deeper-than-anticipated slowdown. These figures indicate that economic risks remain elevated, particularly amid continued trade policy uncertainty under President Donald Trump.

Trump’s recent decision to raise steel import tariffs to 50% sparked fresh concerns and drew sharp criticism from major trading partners, further heightening investor unease.

Tensions with China have also escalated, with Beijing rejecting Trump’s accusations of violating the interim trade deal and vowing retaliatory measures to defend its interests.

Looking ahead, markets will closely monitor a series of US macroeconomic releases due on Tuesday, including job openings, durable goods orders, and factory orders – all of which will help assess the health of the US economy.

The eurozone is also set to publish preliminary inflation data for May, which may influence euro sentiment. However, for now, investors remain optimistic about EUR/USD. Barring any surprises, the pair appears well-supported.

Technical analysis of EUR/USD

On the H4 chart, EUR/USD is extending the fifth wave of growth towards 1.1485. The market has already met the local target at 1.1450, and a short-term correction to 1.1380 is expected next. Once this pullback concludes, a final push towards 1.1485 is likely, marking the end of the current growth wave. From there, a new downward phase may begin, with a target at 1.1210. The MACD indicator supports this scenario, with its signal line above zero and pointing sharply upwards, indicating continued bullish momentum.

On the H1 chart, EUR/USD formed a consolidation range around 1.1350, broke to the upside, and completed the growth structure, reaching a local target of 1.1450 within the fifth wave. A correction to 1.1380 is anticipated, followed by another growth wave towards 1.1485. The Stochastic oscillator confirms this outlook, with its signal line below 20 and preparing to rise towards 80, signalling a potential bullish continuation after the correction.

Conclusion

EUR/USD remains well-positioned for further gains amid mounting US economic concerns and renewed trade tensions. The pair has short-term support at 1.1380 and faces resistance at 1.1485. A reversal could occur once the current growth wave is exhausted, with 1.1210 as a longer-term downside target. For now, technical indicators and market sentiment continue to point to further upside, particularly if upcoming US data confirms a weakening economic outlook.


Disclaimer

Any forecasts contained herein are based on the author’s particular opinion. This analysis may not be treated as trading advice. RoboForex bears no responsibility for trading results based on trading recommendations and reviews contained herein.

USD/JPY declines for the third consecutive day as safe-haven demand rises

By RoboForex Analytical Department 

The USD/JPY pair fell to 143.58, marking its third consecutive day of losses. The Japanese yen continues to gain ground as demand for safe-haven assets rises amid escalating global trade tensions.

Trade risks boost yen demand

Demand for safe-haven currencies surged after US President Donald Trump threatened to double tariffs on steel and aluminium imports to 50% from 4 June. This announcement weighed on Japanese steelmakers, with JFE Holdings and Kobe Steel potentially facing headwinds. Nippon Steel may fare better, thanks to Trump’s favourable comments regarding its planned merger with US Steel.

Meanwhile, tensions between the US and China escalated further as Beijing rejected Trump’s accusations of breaching the recently negotiated trade agreement in Geneva.

Domestic data supports the yen

Japan’s latest data revealed stronger-than-expected capital expenditure growth in Q1. Investment activity increased across both the manufacturing and non-manufacturing sectors, reinforcing domestic fundamentals amid global headwinds.

With uncertainty lingering and market preference shifting towards defensive assets, the yen continues to show resilience and may remain firm if current conditions persist.

Technical analysis of USD/JPY

On the H4 chart, USD/JPY formed a narrow consolidation range around 144.22, which the market broke below earlier today. This breakout opens the way for a continued move down towards 142.20. After reaching this level, a corrective rebound to 144.22 is possible. The MACD indicator confirms this scenario, with its signal line below zero and pointing steeply downwards, indicating strong bearish momentum.

On the H1 chart, the pair is forming the fifth wave of the current downtrend, targeting 142.20. A temporary rebound to 143.88 is expected today, followed by a continuation of the decline to 142.70, with the potential for further movement down to 142.20. The Stochastic oscillator supports this outlook, with its signal line rising above 20 towards 50, suggesting a brief corrective move before further downside.

Conclusion

The USD/JPY pair remains under pressure due to heightened trade-related risk and growing demand for safe-haven assets such as the Japanese yen. Technically, the pair is poised for further decline, with 142.20 as the next key target. While a short-lived rebound may occur, broader sentiment continues to favour yen strength as long as global trade concerns persist.


Disclaimer

Any forecasts contained herein are based on the author’s particular opinion. This analysis may not be treated as trading advice. RoboForex bears no responsibility for trading results based on trading recommendations and reviews contained herein.

Week Ahead: 3 events that could move EURUSD over 100 pips

By ForexTime 

  • EURUSD set to end May unchanged; mostly kept to 1.11 – 1.14 range this month
  • June 3: Eurozone inflation (CPI) expected to slow in May
  • June 5: European Central Bank set to cut rates again, signal future cuts
  • June 6: US jobs report may add to US risks – fiscal deficit, tariff rollout, etc.
  • Bloomberg model: 74% chance EURUSD trades between 1.118 – 1.149 next week


The euro is flat against the US dollar this month.

At the time of writing, EURUSD is right back where it began May 2025, with just hours remaining in the last trading day of the month (though the US PCE data is still due prior to the weekend).

The euro has clearly lagged behind its G10 peers’ performance against the USD:

(IMPORTANT: The data below was generated before the US PCE data is released)

Imagen
euro flat against USD in May 2025


FX markets still gripped by Trump policies

As we enter the first week of June, of course markets remain watchful over:

  • US fiscal deficit

The Senate is set to have their take on the tax and spending legislation, which had already been passed by the House, and stoked fears of a widening fiscal deficit (US government spending more than it earns from taxes)


  • US tariff policies
    President Trump’s on-then-off tariff rollout, along with the shifting percentage numbers, have rocked markets. 

    Although the shock-and-awe from these tariff-related developments have waned of late, they still warrant constant vigilance.


The above-listed factors will be a common theme during a week that features all these economic events:

Monday, June 2

  • SGD: Singapore May PMI
  • US30 index: US May ISM manufacturing
  • USDInd: Speeches by Fed Chair Jerome Powell, Fed Governor Christopher Waller, Dallas Fed President Lorie Logan, Chicago Fed President Austan Goolsbee
  • NAS100 index: US Senate to hash out Trump’s tax and spending bill this week?

Tuesday, June 3

  • AUD: RBA meeting minutes; Australia 1Q current account balance
  • CN50 index: China May manufacturing PMI
  • EU50 index: Eurozone May CPI; April unemployment rate
  • US400 index: US April JOLTS job openings, factory orders
  • USDInd: Chicago Fed President Austan Goolsbee, Dallas Fed President Lorie Logan speech

Wednesday, June 4

  • AU200 index: Australia 1Q GDP
  • SG20 index: Singapore May PMI
  • CAD: Bank of Canada rate decision
  • USDInd: Speeches by Atlanta Fed President Raphael Bostic and Fed Governor Lisa Cook

Thursday, June 5

  • AUD: Australia April trade balance
  • CHINAH index: China May services, composite PMI
  • TWN index: Taiwan May CPI, PPI
  • EU50 index: Eurozone April PPI; Germany April factory orders
  • EUR: ECB rate decision
  • US30 index: US weekly initial jobless claims
  • USDInd: Fed Governor Adriana Kugler, Philadelphia Fed President Patrick Harker speech

Friday, June 6

  • EU50 index: Eurozone April retail sales; 1Q GDP and employment (final)
  • EUR: Germany April industrial production, trade balance
  • CAD: Canada May unemployment
  • US500 index: US May nonfarm payrolls


3 scheduled events that could rock EURUSD

For EURUSD in particular, these scheduled events could have a major say on whether the world’s most-traded FX pair could get a catch-up boost:

1) Tuesday, June 3: Eurozone May consumer price index (CPI)

Economists predict that Eurozone inflation eased lower in May:

  • CPI year-on-year (May 2025 vs. May 2024): 2%
    If so, that would lower than April’s 2.2% y/y print
  • CPI month-on-month (May 2025 vs. April 2025): 0%
    Unchanged from April
  • Core CPI year-on-year (excluding energy, food, alcohol, tobacco prices): 2.4%
    If so, that would lower than April’s core 2.7% y/y print

Slower-than-expected inflation, closer to the ECB’s 2% target, should pave the way for more rate cuts. Such prospects could keep the euro on the backfoot.

However, a surprise uptick in the CPI figures may boost EURUSD.

EURUSD is expected to react with a 0.44% climb or a 0.25% drop in the 6 hours after this CPI release.


2) Thursday, June 5th: European Central Bank (ECB) rate decision

The ECB is widely expected to again lower its rates by a further 25-basis points – anything else would be a shocker.

More importantly, forward-looking traders and investors are eager to get more clues about the timing of the next ECB rate cut.

Markets currently predict that, after the June policy meeting, there’s a 78% chance that the ECB will cut rates again in September – the final cut for 2025.

EURUSD could get a lift if the ECB pushes back against such forecasts, setting the bar higher for future rate cuts.

However, if the ECB next week opens the door wide open and hints at more-than-one cut (after next week) by end-2025, that could soften the euro.

EURUSD could move 0.36% up or 0.23% down in the 6 hours after ECB’s rate decision.


3) Friday, June 6th: US May nonfarm payrolls (NFP)

Here are what economists predict for this always-pivotal monthly jobs report out of the world’s largest economy:

  • May headline NFP number: 130,000
    If so, that would be lower than the 177k new jobs added in April
  • May unemployment rate: 4.2%
    Unchanged from April

The US dollar could weaken/EURUSD could rise on a weaker-than-expected US jobs report (fewer-jobs added/higher unemployment) that makes for a more challenging economic outlook.

However, a still-robust US labour market could strengthen the buck and drag EURUSD lower.

EURUSD could move 0.27% up or 0.8% down in the 6 hours after this US NFP release.


Imagen
Week Ahead: 3 events that could rock EURUSD

Potential Scenarios

According to the Bloomberg FX forecast model …

EURUSD is likely (74% chance) to trade between 1.118 – 1.149 next week.

  • BULLISH: If EURUSD can break above the stubborn resistance around 1.1420, then bulls can set their sights on the 1.1490 region – the upper bound of Bloomberg’s FX forecasted range.

A major bout of US dollar weakness may encourage EURUSD bulls (those hoping prices will go higher) to revisit the 1.157 peak in April – also the highest levels since November 2021.


  • BEARISH: A daily close below its 21-day simple moving average (SMA) – a critical support in recent days – may see EURUSD re-testing support around the 1.1200/50-day SMA.


Forex-Time-LogoArticle by ForexTime

ForexTime Ltd (FXTM) is an award winning international online forex broker regulated by CySEC 185/12 www.forextime.com

EUR/USD Extends Losses for Third Consecutive Day

By RoboForex Analytical Department 

The euro/dollar pair continues to decline on Thursday, edging closer to 1.1256 as the US dollar strengthens for a third straight session. This development follows a US federal court ruling that former President Donald Trump overstepped his authority by imposing retaliatory tariffs.

Key factors driving EUR/USD movement

The US Court of International Trade ruled that the tariffs were unlawful not only for the five companies that brought the lawsuit but also for all parties. The court ordered the immediate and permanent revocation of these tariffs, although the Trump administration is expected to appeal the decision.

Meanwhile, investors are closely monitoring debates in the US Senate over Trump’s expansive tax and budget bill, which is likely to face substantial amendments in the upper chamber.

Yesterday’s release of the Federal Reserve meeting minutes revealed a cautious, wait-and-see stance among officials. Policymakers are evaluating the economic repercussions of recent government measures and the ongoing tariff dispute, with noted concerns over rising inflation and unemployment risks.

Thursday’s market focus will shift to key economic data, including the second estimate of US Q1 GDP and the weekly US jobless claims report.

Technical analysis: EUR/USD

H4 Chart:

  • The pair formed a consolidation range around 1.1313 before breaking downward to 1.1210
  • A technical retracement to 1.1313 (testing from below) is anticipated today
  • If the price breaks downward from this range, the downtrend could extend towards 1.1080
  • Conversely, an upward breakout may signal a corrective move towards 1.1485
  • The MACD indicator supports this outlook, with its signal line below zero and pointing sharply downward.

H1 Chart:

  • The market completed a downward wave to 1.1313, followed by consolidation and a further drop to 1.1210 in a double-wave extension structure
  • Today, a potential upside wave to 1.1260 is in play, with a possible continuation towards 1.1313
  • The Stochastic oscillator aligns with this scenario, with its signal line above 50 and rising towards 80


Conclusion

The EUR/USD remains under pressure amid dollar strength and political uncertainty, with technical indicators suggesting further downside potential unless a corrective rebound materialises.


Disclaimer

Any forecasts contained herein are based on the author’s particular opinion. This analysis may not be treated as trading advice. RoboForex bears no responsibility for trading results based on trading recommendations and reviews contained herein.

USD/JPY Rises Steadily as Yen Weakens Amid Bond Market Pressures

By RoboForex Analytical Department 

The USD/JPY pair extended its gains on Wednesday, climbing to 144.46 as the Japanese yen depreciated for the third consecutive session.

Key factors driving USD/JPY movement

Markets are closely scrutinising remarks from major central bankers and developments in the bond sector.

Bank of Japan (BoJ) Governor Kazuo Ueda noted that ongoing trade discussions with the US are contributing to heightened uncertainty in Japan’s economic outlook. He reiterated the central bank’s readiness to adjust monetary policy if necessary to achieve its inflation targets.

Meanwhile, Finance Minister Katsunobu Kato stated that authorities are closely monitoring the bond market. This comes after both the yen and Japanese government bond (JGB) yields fell sharply following reports that the Ministry of Finance might reduce the issuance of ultra-long-dated bonds.

The potential reduction in bond supply appears to be an effort to curb rising yields, particularly after last week’s disappointing 20-year bond auction, which saw the weakest demand in a decade. Investors are now turning their attention to an upcoming 40-year bond sale.

Additionally, subdued market volatility and a stable external backdrop have diminished demand for the yen as a safe-haven asset, further contributing to its decline.

Technical analysis: USD/JPY

H4 Chart:

On the H4 chart, USD/JPY completed a downward wave to 142.15 before initiating an upward move towards 145.50, which remains the primary target. Today, we anticipate the completion of this upward wave, followed by a potential pullback to 143.81. A broader consolidation phase around this level is also plausible. This scenario is supported by the MACD indicator, whose signal line remains above zero and continues to trend upwards.

H1 Chart:

On the H1 chart, the pair formed a consolidation range around 143.85 after an initial upward wave. A breakout above this range could see a push towards 145.50, with a possible retracement to 143.85 before resuming the uptrend. A sustained break above 145.50 may extend gains towards 147.20. The Stochastic oscillator aligns with this outlook, with its signal line above 50 and rising towards 80, indicating bullish momentum.


Conclusion

The USD/JPY uptrend remains intact, supported by both fundamental and technical factors. Traders will be watching bond market developments and central bank signals for further directional cues.


Disclaimer

Any forecasts contained herein are based on the author’s particular opinion. This analysis may not be treated as trading advice. RoboForex bears no responsibility for trading results based on trading recommendations and reviews contained herein.