By RoboForex Analytical Department
The GBP/USD pair snapped a four-day winning streak, declining for a second day to trade around 1.3135. The sell-off was triggered by UK labour market data revealing a rise in unemployment and a deceleration in annual wage growth. These figures have bolstered market expectations that the Bank of England (BoE) could initiate interest rate cuts as early as December.
The shifting sentiment was reflected in government bonds, with the two-year gilt yield falling 6 basis points to 3.74%, its lowest level since August 2024.
Appetite for risk was mixed across asset classes. European stock indices managed gains, while S&P 500 futures edged down approximately 0.2%.
In currency markets, traders are increasingly pricing in a more dovish path for BoE policy. Current pricing implies roughly 21 basis points of cuts by December, with a total of up to 65 basis points of easing projected by the end of 2026. Economists suggest that, given the softening labour market and anticipated fiscal tightening, the BoE’s base rate could fall to 3.00% from the current 4.00%.
Technical Analysis: GBP/USD
H4 Chart:
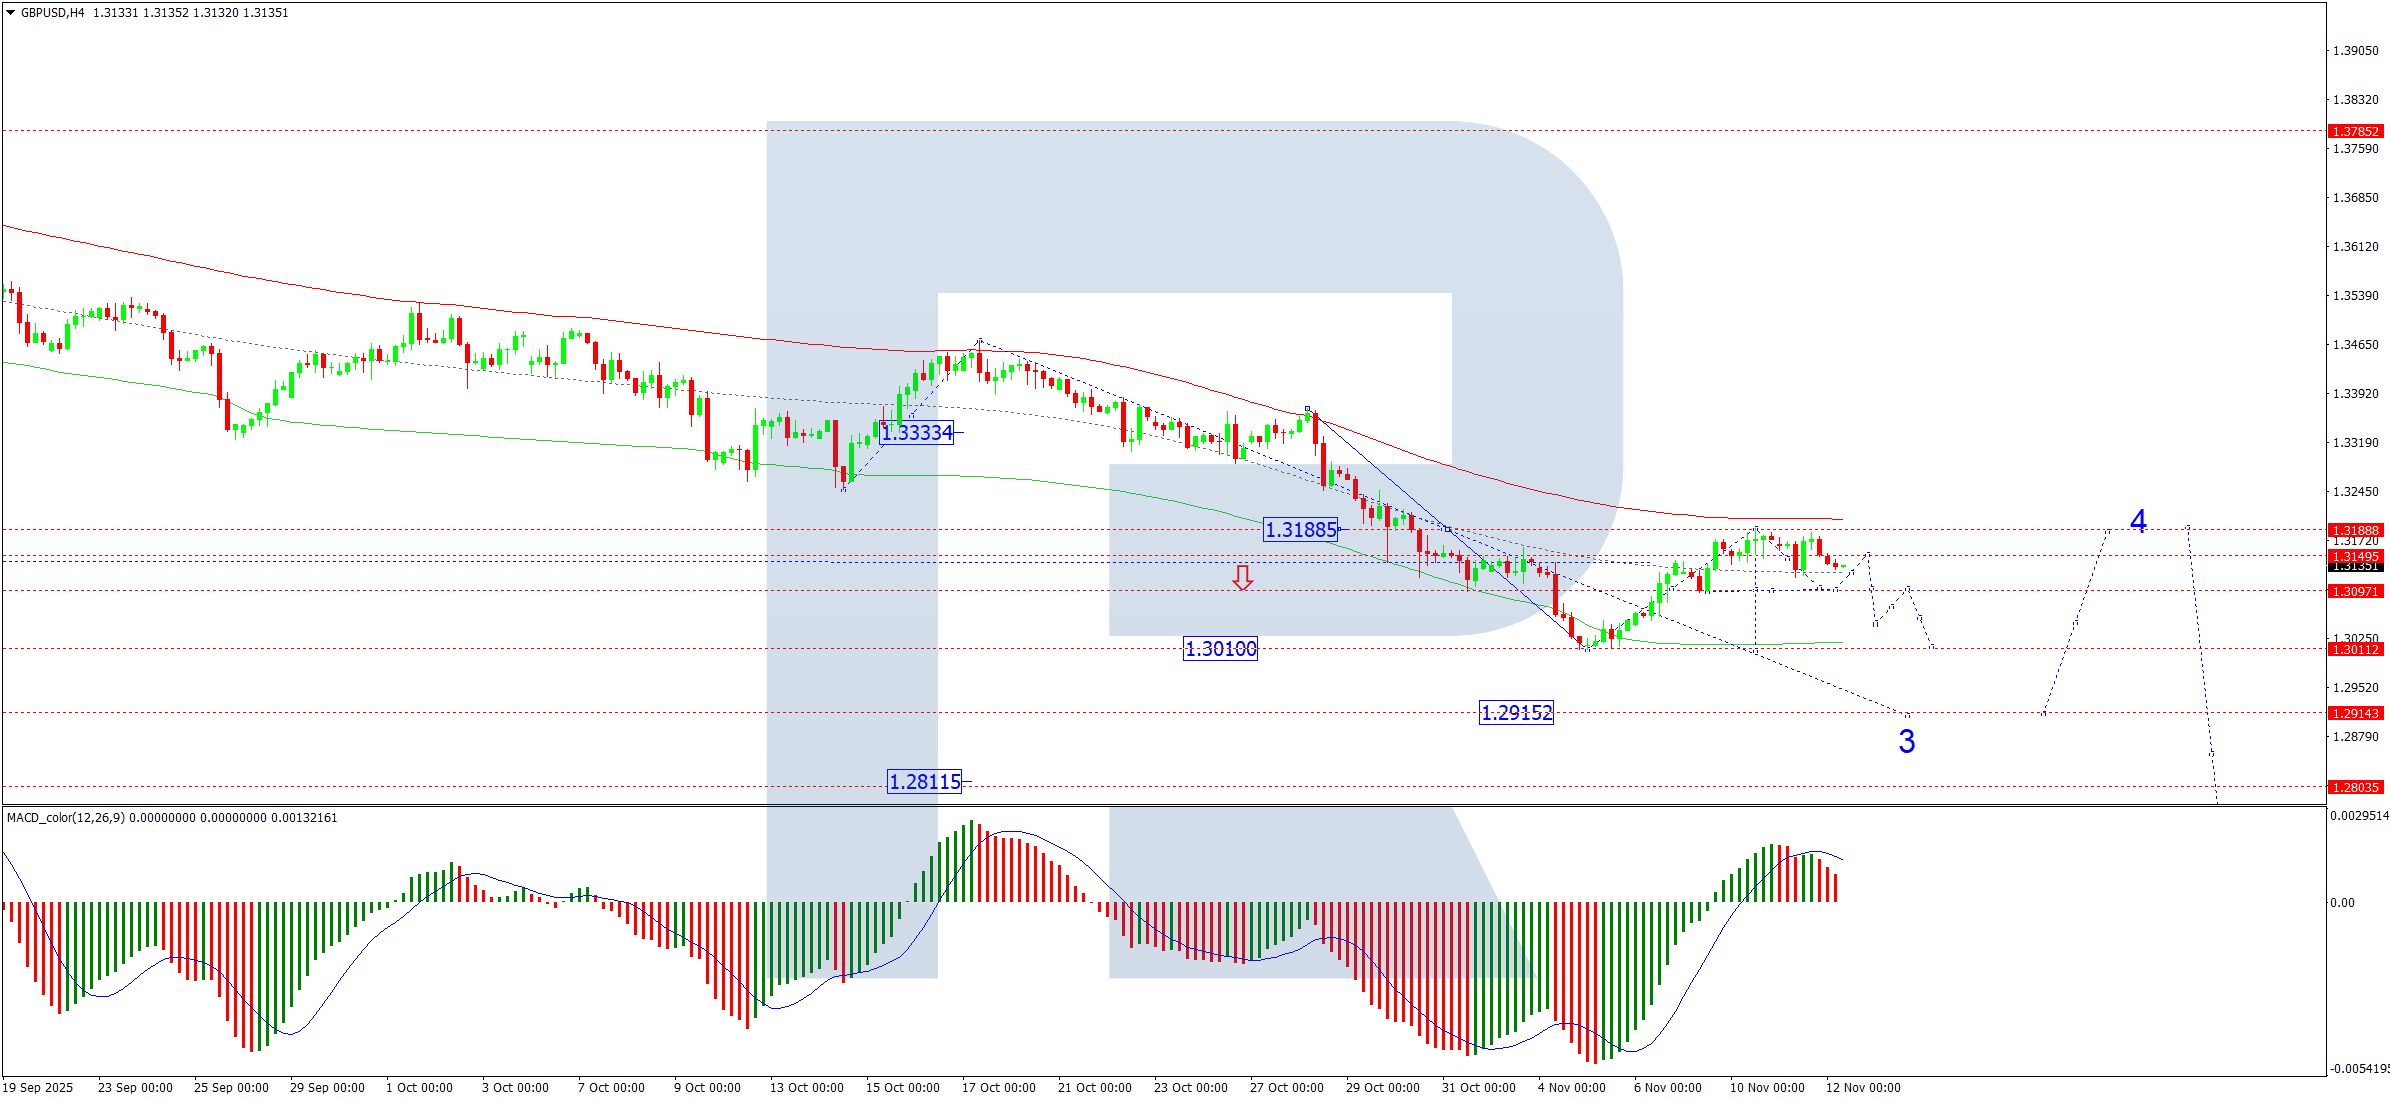
On the H4 chart, GBP/USD broke upwards from a consolidation range around 1.3100, completing a corrective wave to 1.3185. We now anticipate a decline back towards the 1.3100 support level. A brief rebound to 1.3150 may follow, establishing a new consolidation range. A subsequent downward breakout from this range would signal a resumption of the broader downtrend, opening the path towards 1.3000, with a further potential decline to at least 1.2915. This bearish scenario is supported by the MACD indicator. Its signal line is above zero but has diverged from its histogram, suggesting the initial upward correction is exhausted and a new decline is beginning.
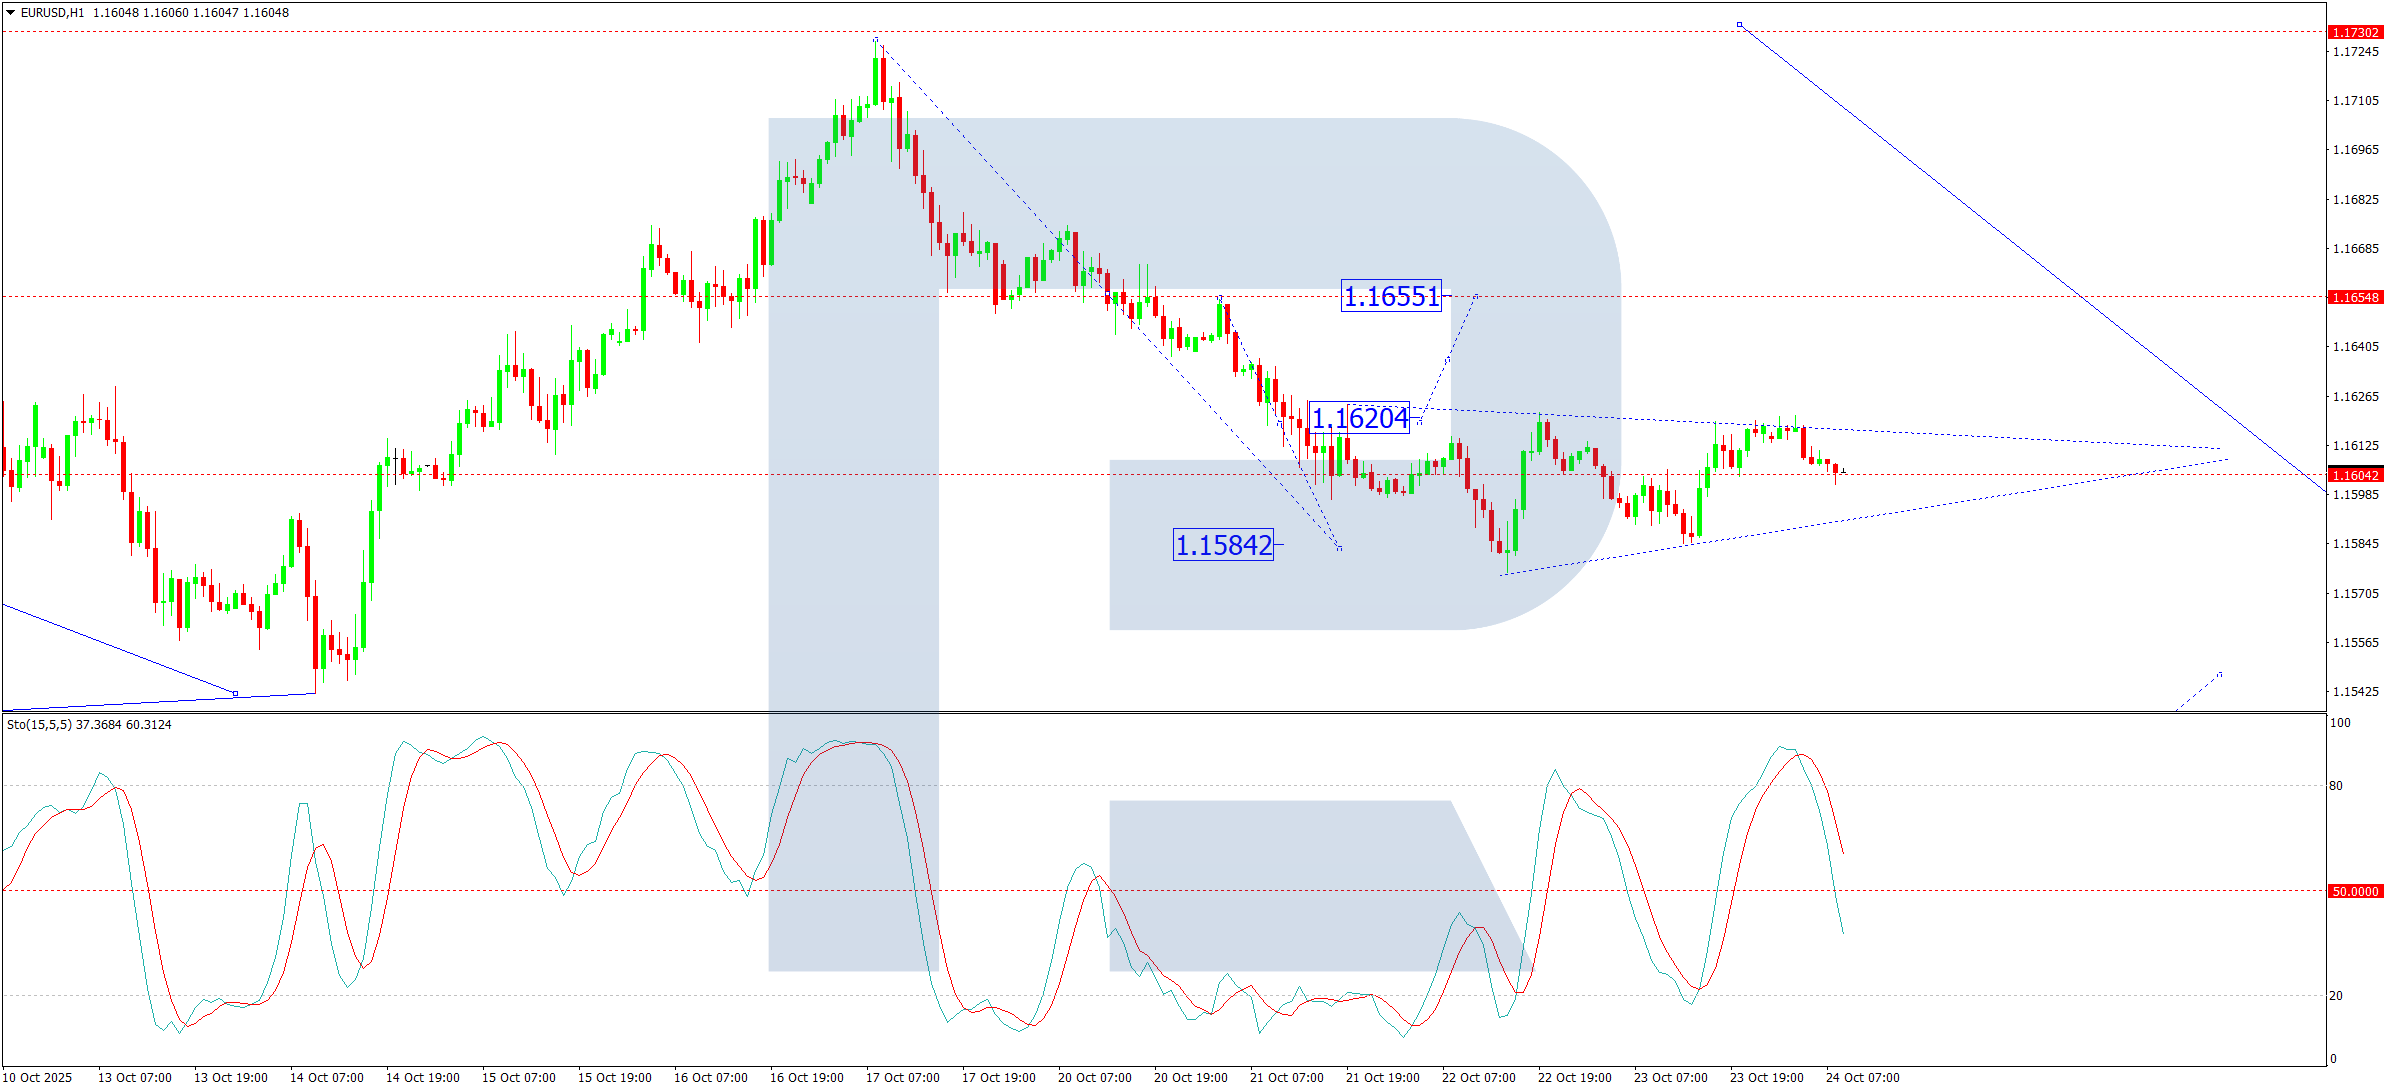
H1 Chart:

On the H1 chart, the pair completed an upward correction to 1.3188 after breaking from a range at 1.3100. A new downward wave is now developing, initially targeting 1.3108. Following this, a technical retracement to test 1.3150 from below is expected. Once this correction is complete, the downtrend is projected to extend towards 1.3050. The Stochastic oscillator confirms this outlook. Its signal line is at the 20 level, indicating oversold conditions but also supporting the view that downward momentum is currently dominant.
Conclusion
The pound is weakening as soft labour market data fuels expectations of imminent BoE monetary easing. Technically, the pair appears to have completed a corrective bounce and is now poised to resume its primary downtrend. The immediate focus is on the 1.3100 support; a sustained break below this level would confirm a move towards 1.3000 and potentially lower.
Disclaimer:
Any forecasts contained herein are based on the author’s particular opinion. This analysis may not be treated as trading advice. RoboForex bears no responsibility for trading results based on trading recommendations and reviews contained herein.