By RoboForex Analytical Department
The USD/JPY pair fell to 155.67 on Wednesday, recovering part of the previous session’s sharp losses. The decline was driven by renewed pressure on the US dollar, as market expectations for a deeper Federal Reserve easing cycle gained traction.
Domestically, investor attention remains firmly fixed on the likelihood of a Bank of Japan (BoJ) interest rate hike at its December meeting. This possibility has been underscored by recent hawkish signals from certain BoJ officials, creating a contrast with market perceptions that Prime Minister Sanae Takaichi’s government favours more accommodative monetary conditions.
This week, Finance Minister Satsuki Katayama sought to downplay any perceived policy rift, stating there is no discrepancy between the government’s and the central bank’s economic assessments. This remark underscores the continued official emphasis on coordination between fiscal and monetary policy.
Her comments followed a speech by BoJ Governor Kazuo Ueda, who expressed confidence in Japan’s economic outlook and confirmed the central bank will carefully weigh the advantages and disadvantages of a rate increase at its December policy review.
Technical Analysis: USD/JPY
H4 Chart:
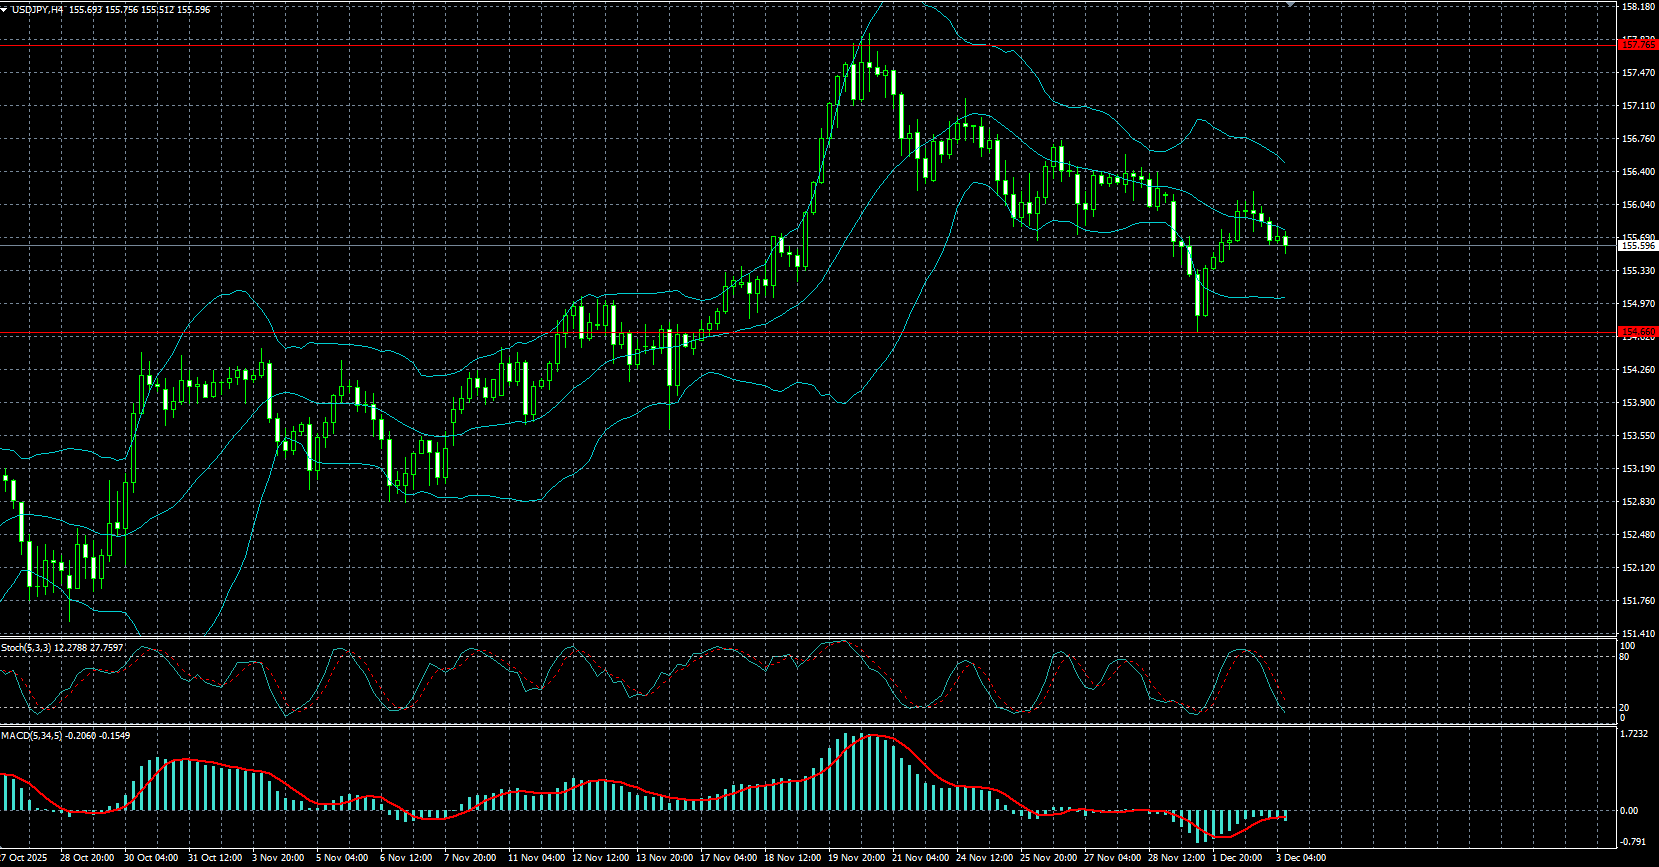
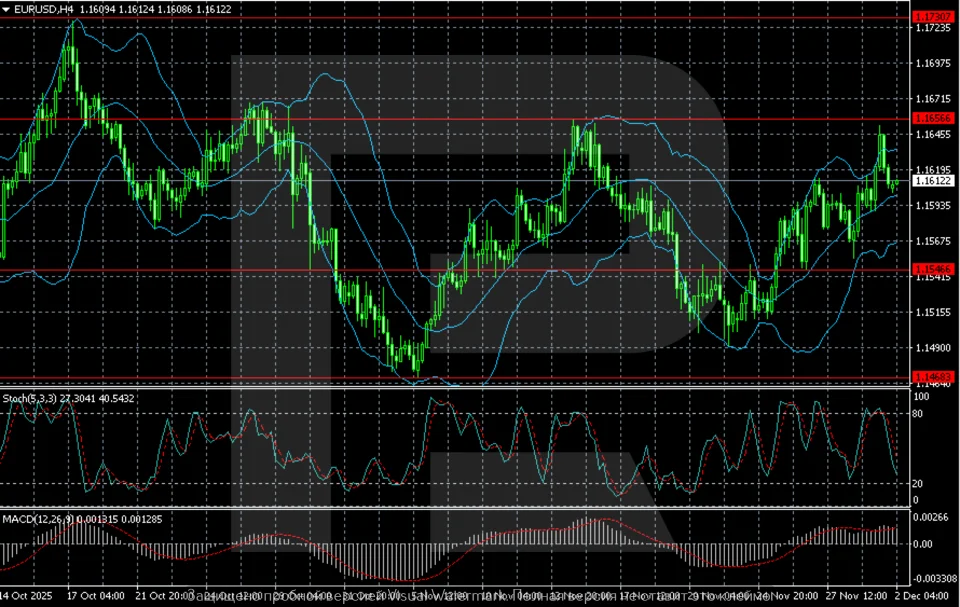
On the H4 chart, USD/JPY remains in a downward correction phase following its accelerated rally in mid-November. The pair is trading below the key resistance level of 156.76, forming a potential reversal structure near the lower Bollinger Band. Selling pressure persists, as evidenced by the market’s failure to sustain a move above the indicator’s middle band.
A decisive break below the 154.66 support level would signal a deeper correction, targeting the area of previous local lows. Conversely, a sustained recovery and close above 156.76 would provide the first technical signal of a potential recovery, opening a path for the pair to retest the 157.90–158.00 resistance zone.
H1 Chart:
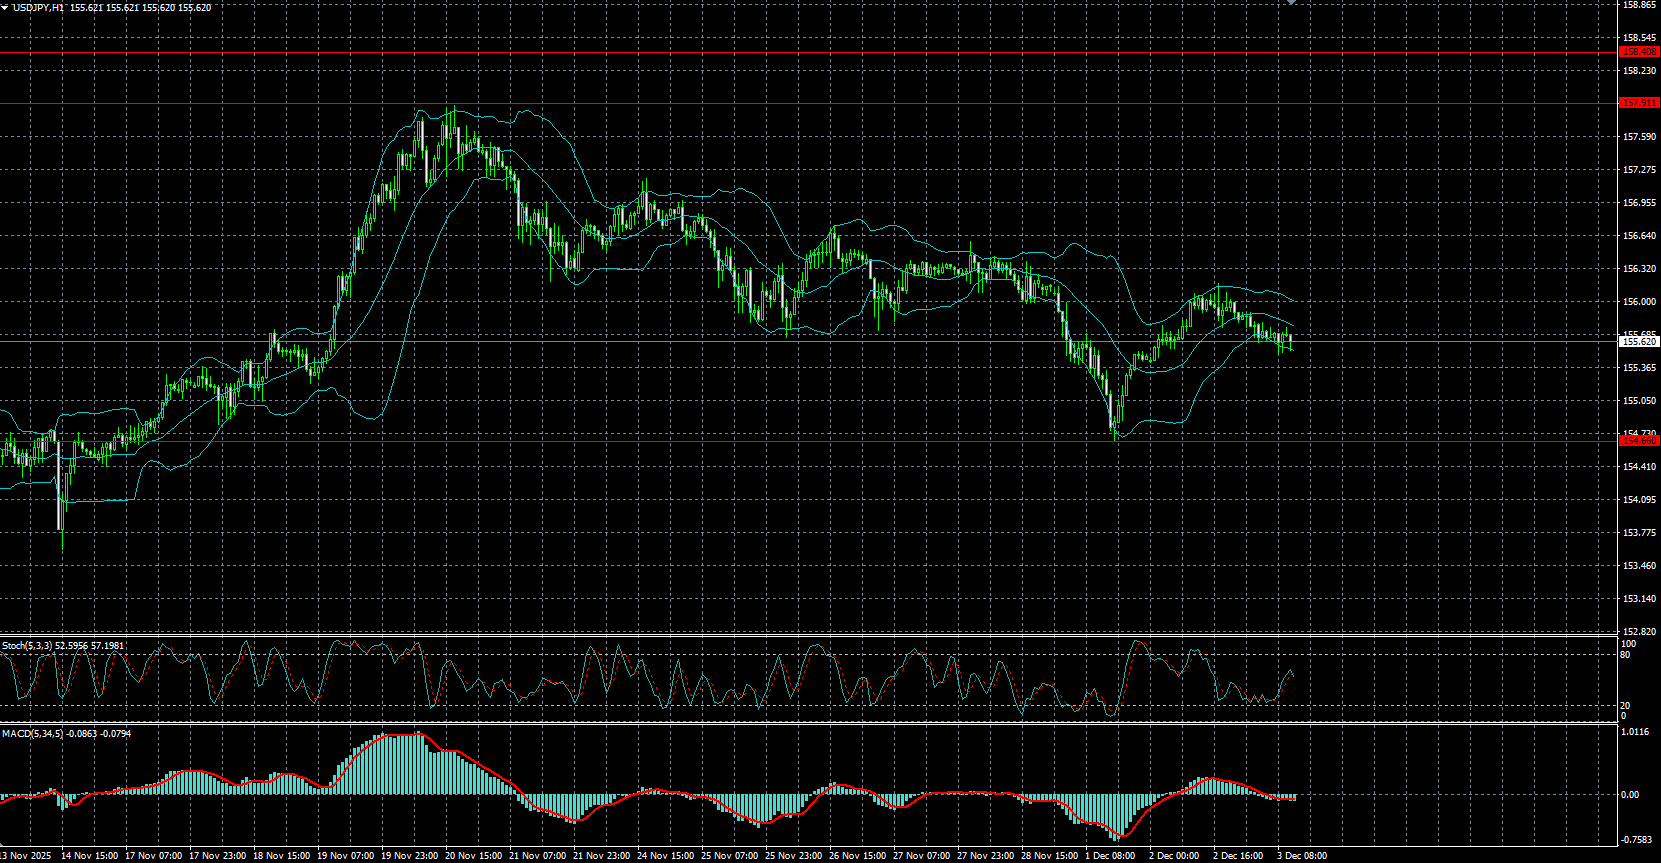
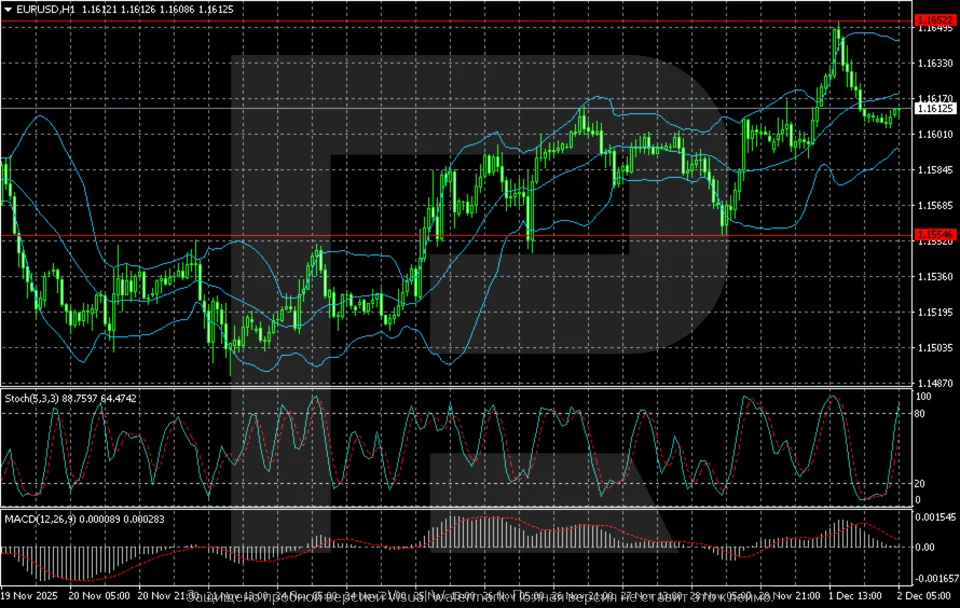
On the H1 chart, USD/JPY is undergoing an upward correction after rebounding from support at 157.91. However, the upside appears constrained by the upper Bollinger Band. While buyers are attempting to push above the intermediate resistance at 158.40, price action remains choppy and lacks clear directional conviction.
The technical picture suggests a phase of sideways consolidation with a downside bias. Maintaining the price below 158.45 increases the likelihood of a retest of 157.91. A break below this level would strengthen the bearish scenario, targeting the lower boundary of the current range. For a confirmed bullish shift, a sustained move above 158.45, followed by a breakout towards 158.80–159.00, would be required.
Conclusion
USD/JPY is consolidating its recent decline amid a tug-of-war between a softer US dollar and evolving expectations for BoJ policy. The technical structure across both timeframes suggests a cautious, range-bound environment with a current tilt towards the downside. The immediate directional catalyst will likely be the BoJ’s December meeting, but in the near term, traders should watch for a break outside the 156.76–154.66 range on the H4 chart for a clearer signal on the pair’s next significant move.
Disclaimer:
Any forecasts contained herein are based on the author’s particular opinion. This analysis may not be treated as trading advice. RoboForex bears no responsibility for trading results based on trading recommendations and reviews contained herein.