By RoboForex Analytical Department
The pound remains on the back foot against the US dollar, pressured by growing market conviction that the Bank of England (BoE) will sustain its accommodative monetary policy stance for longer than the US Federal Reserve. The latest UK inflation figures showed a noticeable cooling in price pressures, effectively extinguishing expectations of further interest rate hikes from the British central bank.
Conversely, Federal Reserve officials continue to strike a hawkish tone in their public remarks, signalling that US interest rates are likely to remain at elevated levels for an extended period. This policy divergence is bolstering the US dollar’s appeal, strengthening its position as a high-yielding, safe-haven asset.
Domestic headwinds are also weighing heavily on sterling. A recent contraction in business activity across both the services and manufacturing sectors (with PMI readings falling below the 50.0 threshold) points to a potential recession in the fourth quarter. Faced with a slowing economy, weakening domestic demand, and persistent cost pressures, the BoE is expected to pause its tightening cycle, leaving the currency vulnerable to further selling.
Compounding these factors, a strong intermarket backdrop for the dollar – characterised by rising US Treasury yields and a strengthening DXY index – is providing both technical and fundamental support for the GBP/USD downtrend.
Technical Analysis: GBP/USD
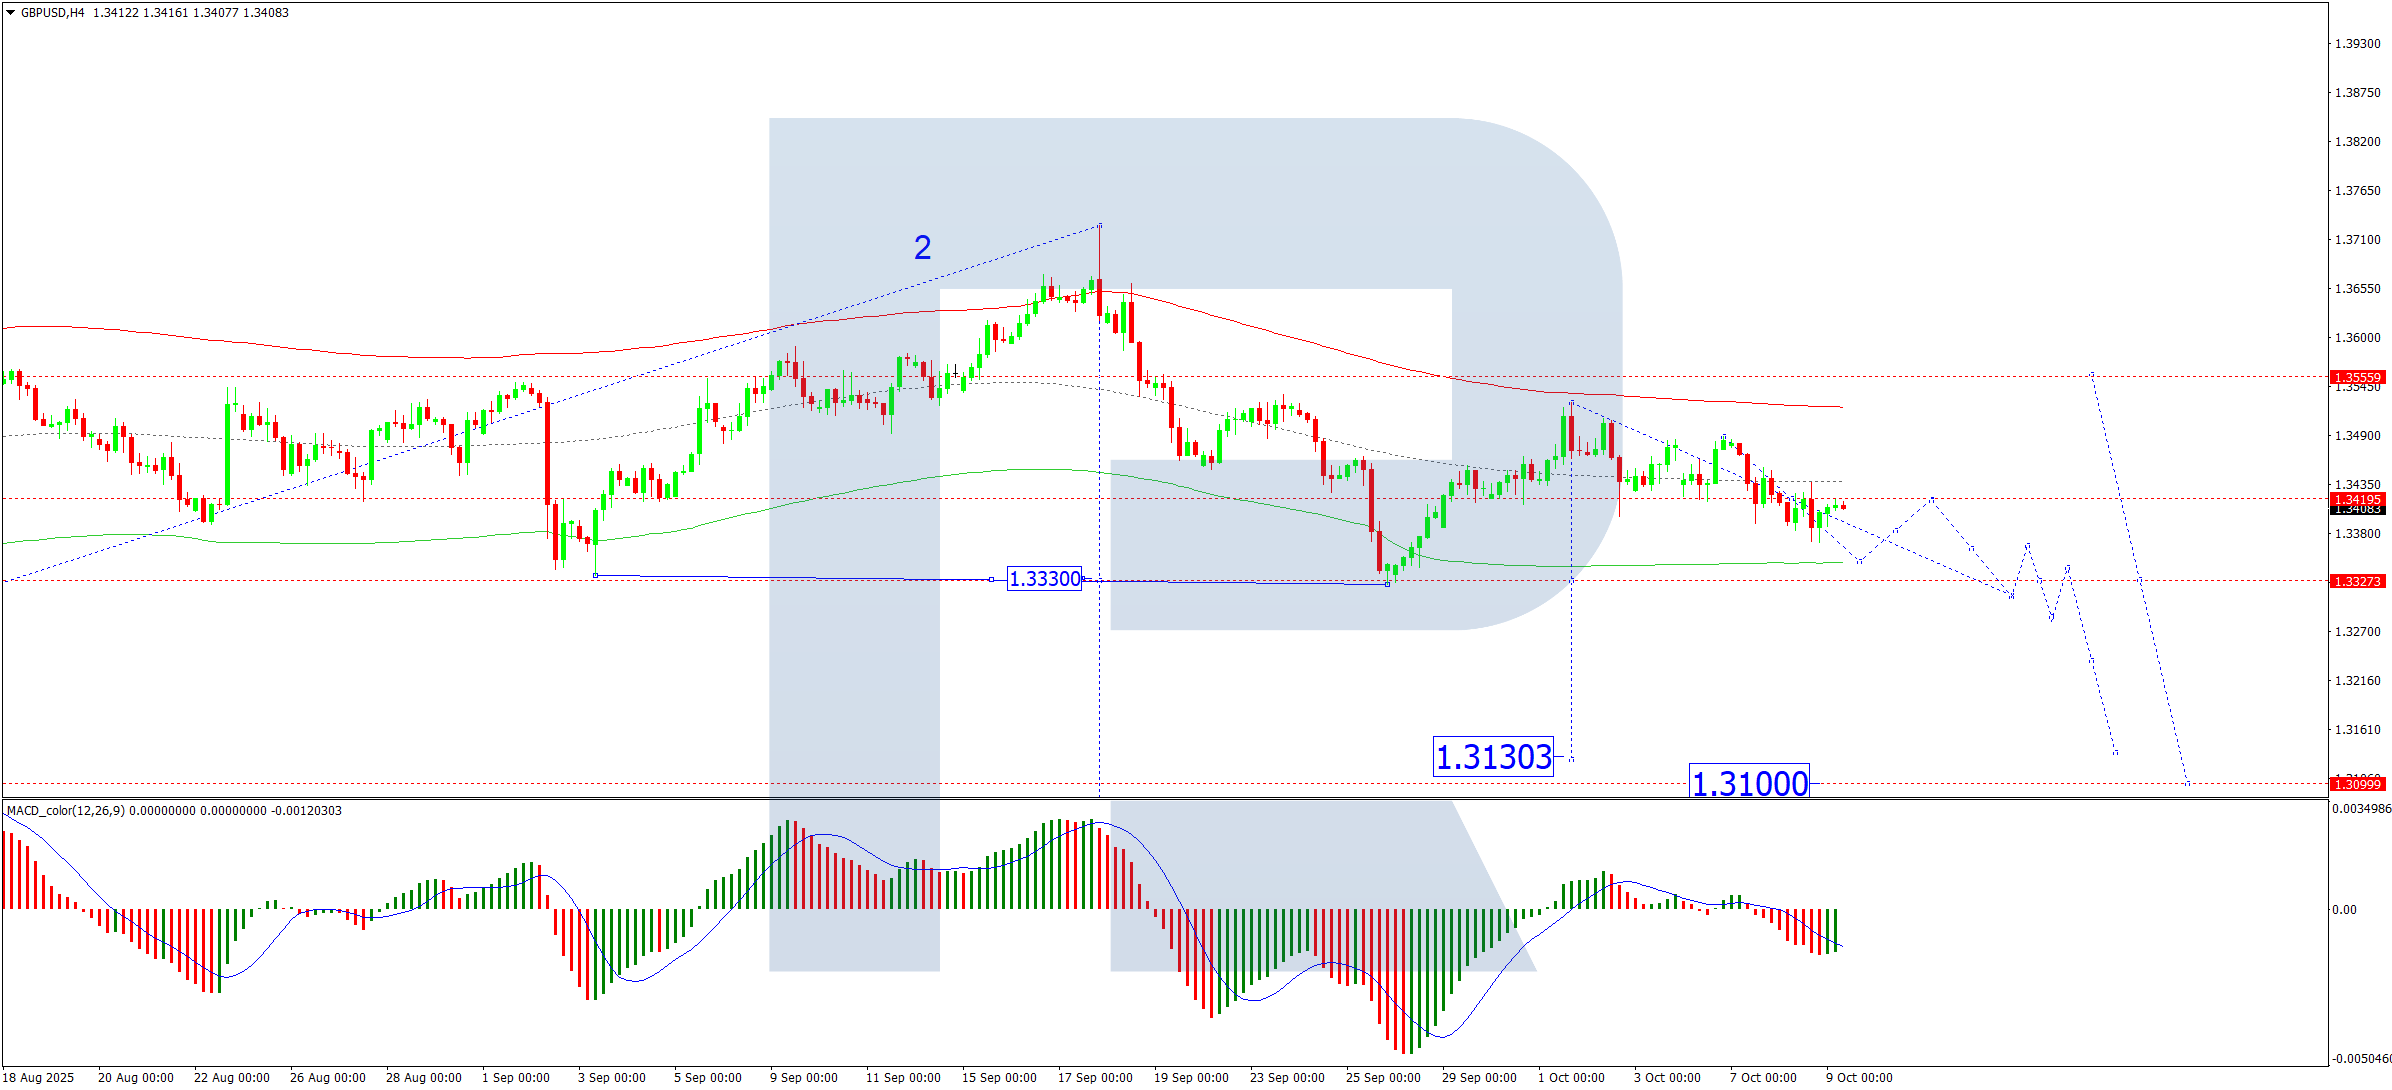
H4 Chart:

On the H4 chart, GBP/USD has been consolidating around 1.3340. The primary scenario suggests a downward breakout from this range, initiating a third wave of decline towards 1.3213. It is important to note that this is only an intermediate target; the broader bearish wave structure carries a primary objective near the 1.2963 area. This outlook is technically confirmed by the MACD indicator, whose signal line remains below zero and is pointing firmly downward, indicating sustained bearish momentum.
H1 Chart:
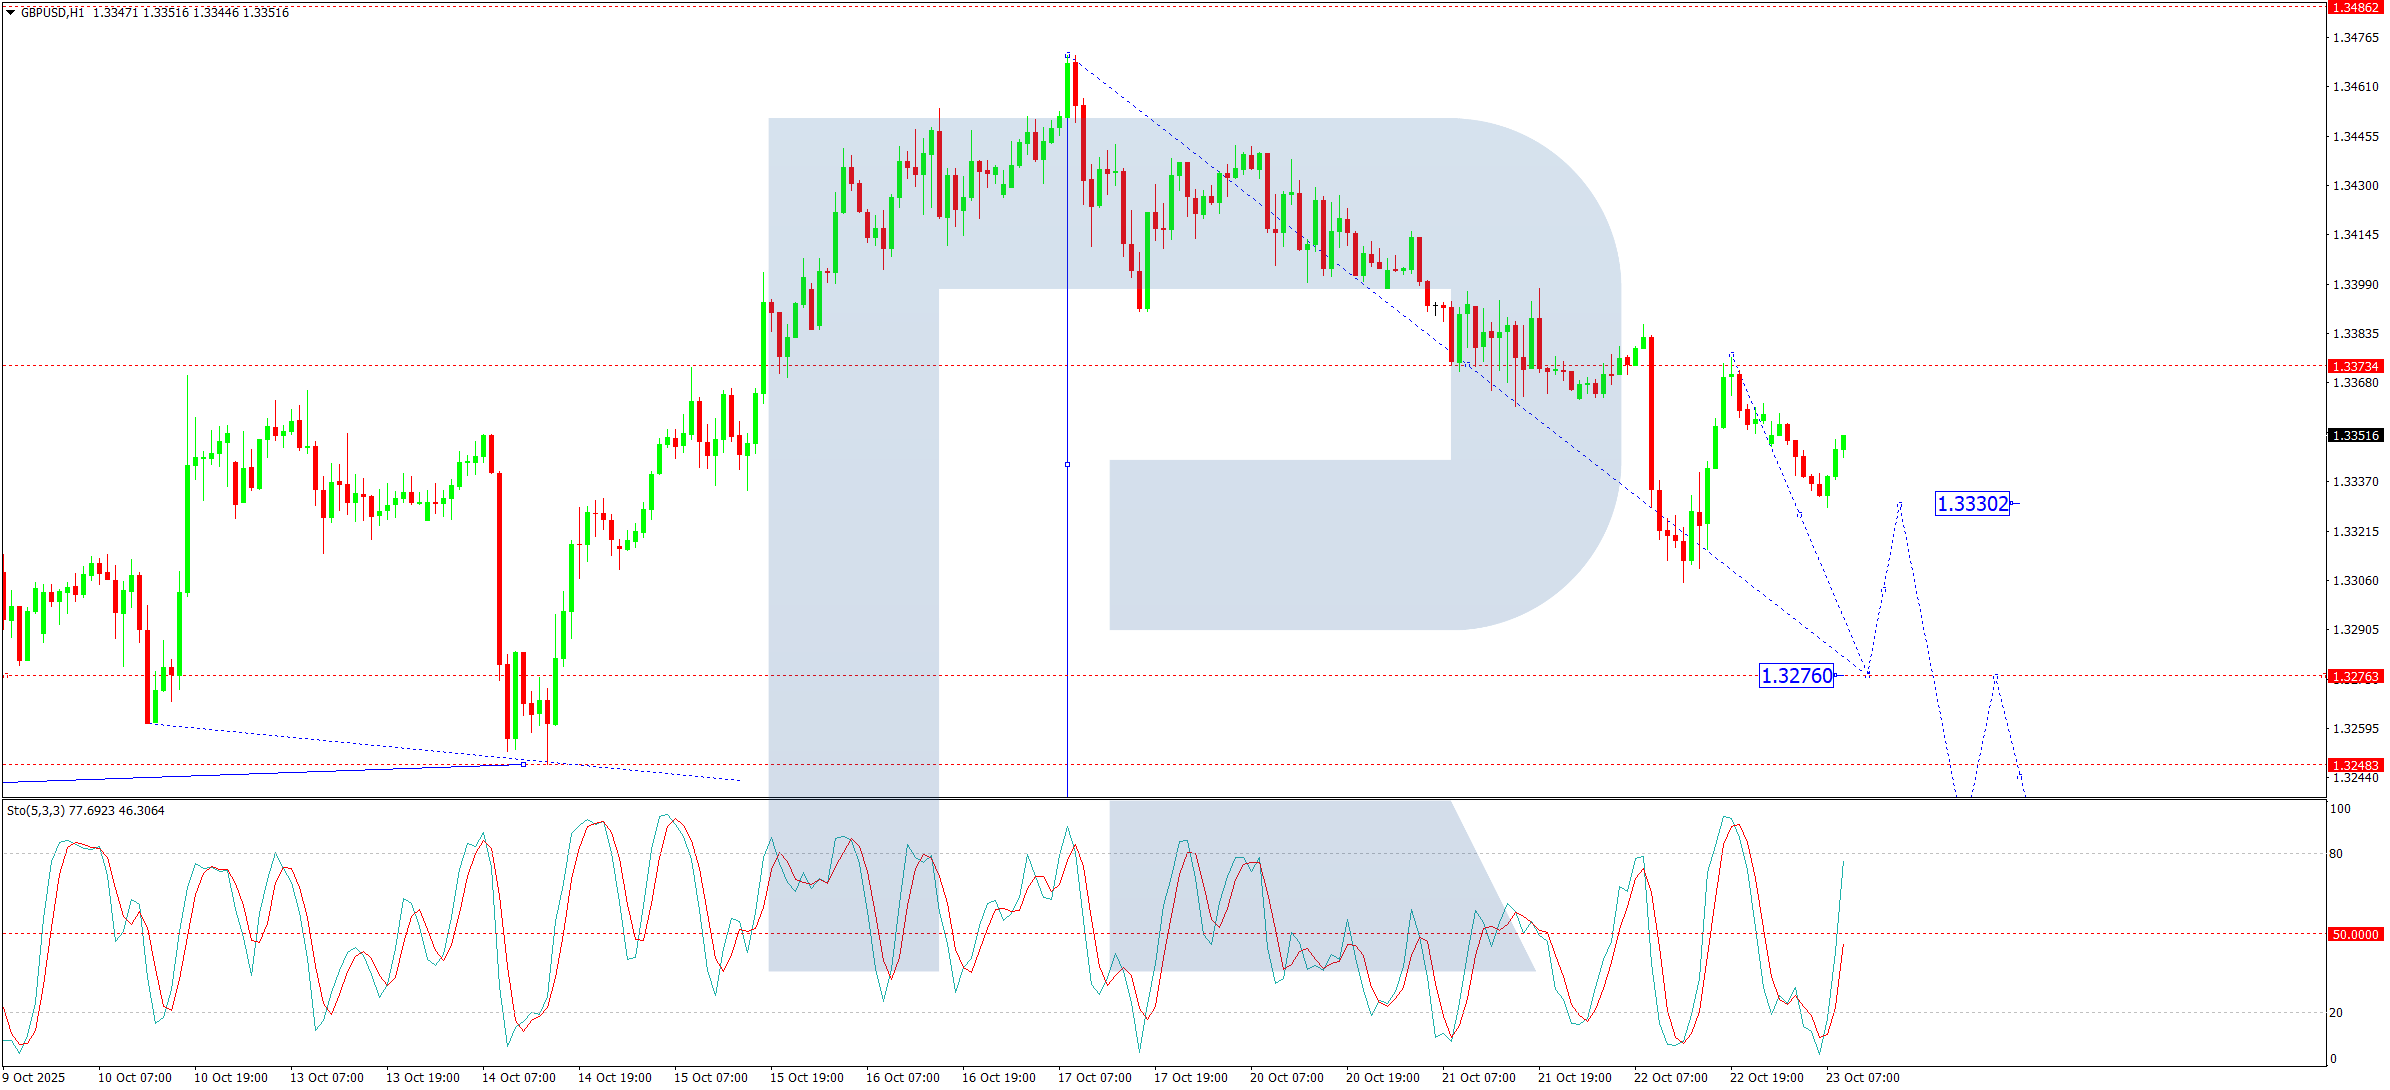
The H1 chart shows the market forming the first leg of a broader third wave downward. The immediate downside target is 1.3276. Upon reaching this level, a short-term corrective rebound to at least 1.3330 is possible. Following such a correction, a resumption of the decline towards 1.3240 and 1.3213 is expected, which would likely complete the current wave structure. The Stochastic oscillator corroborates this view; its signal line is below 50 and is trending towards the oversold territory (20), reinforcing the probability of continued downward movement.
Conclusion
The confluence of a dovish BoE policy shift, resilient US hawkishness, and deteriorating UK economic data creates a powerfully bearish environment for Sterling. Technically, the path of least resistance is firmly to the downside, with key targets established at 1.3213 and ultimately 1.2963.
Disclaimer:
Any forecasts contained herein are based on the author’s particular opinion. This analysis may not be treated as trading advice. RoboForex bears no responsibility for trading results based on trading recommendations and reviews contained herein.