Sterling hijacked our attention last Friday after collapsing like a house of cards!
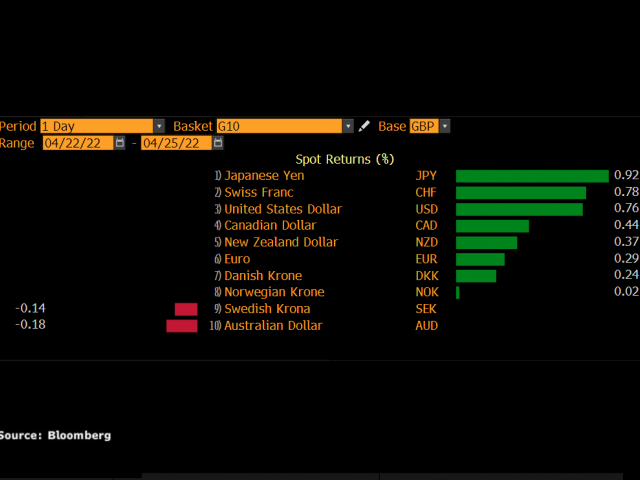
It has stumbled into the new week under renewed pressure, struggling to nurse deep wounds inflicted by the dismal retail sales and consumer confidence data. Mounting concerns over the cost-of-living crisis dragging the UK economy into a recession continue to hammer the pound, which is currently trading at levels not seen since September 2020. Disappointing economic data may fuel speculation over the BoE slowing interest rate rises while political noise from Westminster regarding the post-Brexit trade deal is likely to compound the currency’s woes. Since the start of April, sterling has weakened against most G10 currencies, shedding over 3% versus the dollar of writing.
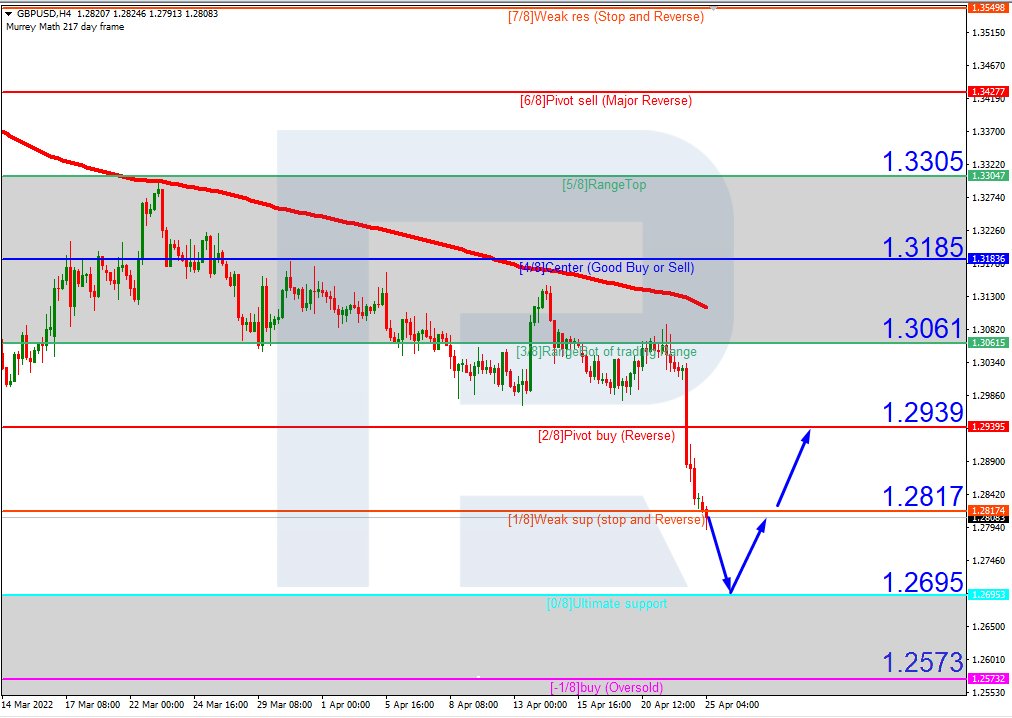
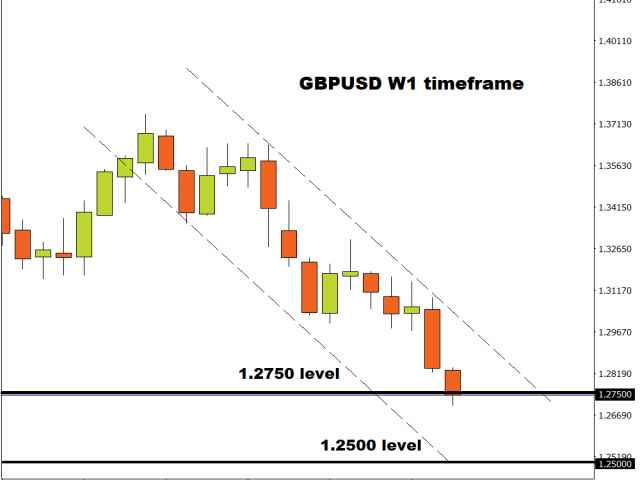
Taking a quick peek at the technicals, prices look heavily bearish on the weekly timeframe with support at 1.2750. A solid breakdown below this point could drag the GBPUSD to levels not seen since mid-2020 around 1.2500.
More pain on the horizon for sterling?
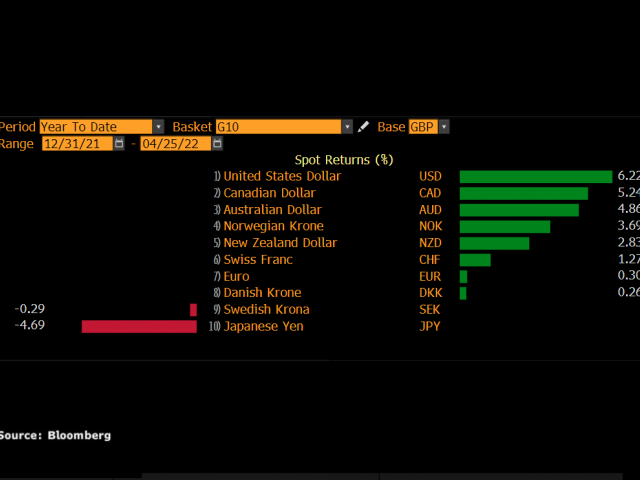
Since the start of 2022, the pound has weakened against almost every single G10 currency. It’s is down over 6% versus the dollar and more than 5% against the Canadian dollar.
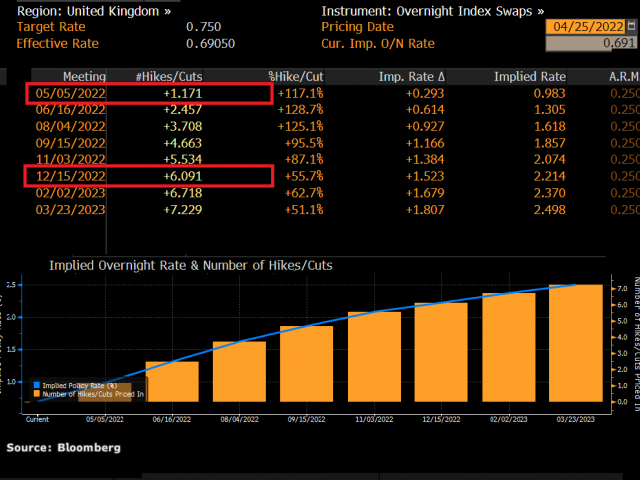
The pound has the potential to weaken further if disappointing economic data forces the Bank of England to adopt a cautious approach towards rate hikes. In fact, Andrew Bailey, BoE governor recently hinted that the UK interest rates may be increased less aggressively amid recession fears.
Indeed, retail sales fell by an unexpected 1.4% in March as the rising cost of living hit consumer spending. Consumer confidence plunged to its lowest level since the 2008 recession while PMIs decline in April, signalling that the economy is slowing considerably. But with inflation hitting a 30 year high of 7% which is more than triple the target of 2%, the BoE is certainly in a tricky position.
The central bank is widely expected to raise interest rates by 0.25bp in May, with a total of 6 hikes expected by the end of 2022.
However, repeatedly weak economic data and post-Brexit related uncertainty could throw a spanner in the works for BoE hawks – resulting in a weaker pound. This weakness is likely to be intensified by an increasingly aggressive and hawkish U.S Federal Reserve.
The week ahead…
It’s a relatively quiet week on the UK economic calendar. However, this does not mean it will be a quiet week for the British pound.
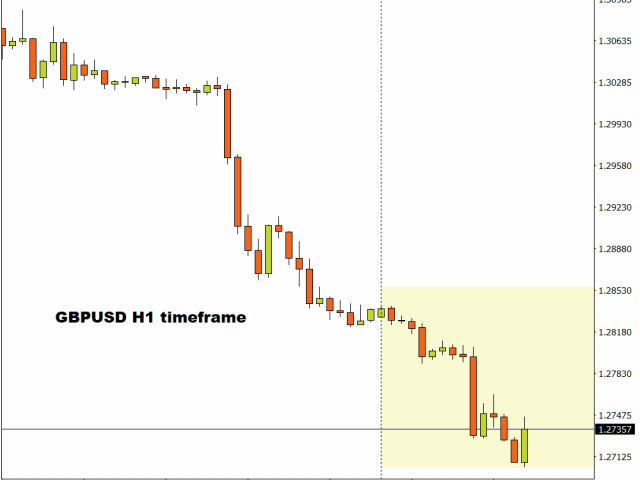
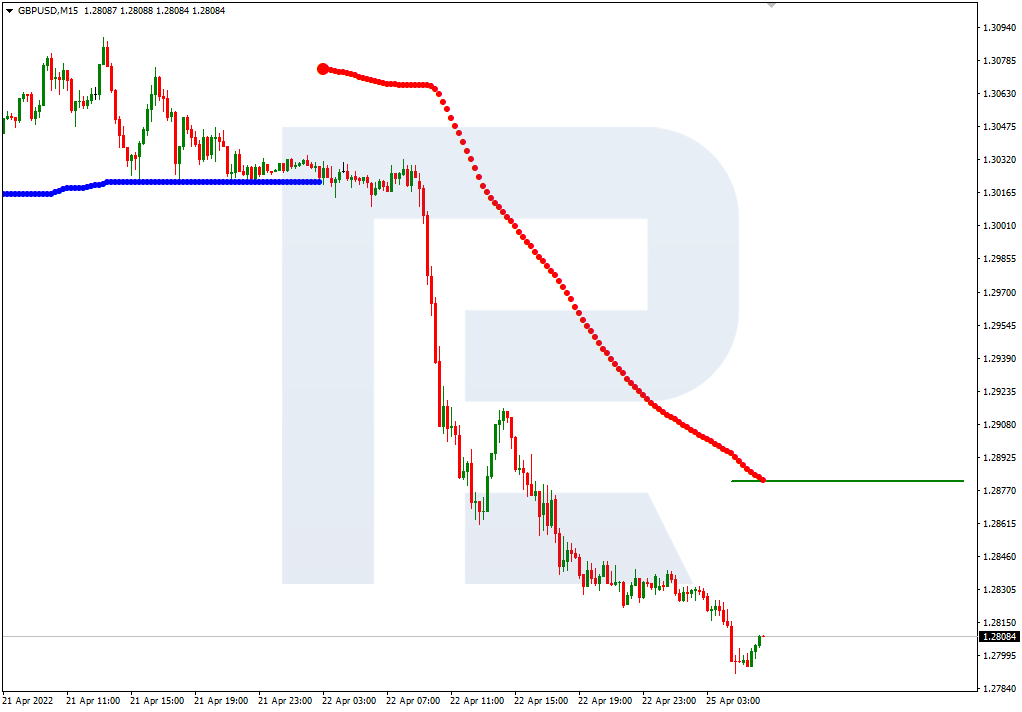
The GBPUSD has already dropped over 100 pips this morning, with weakness being seeing across the board.
There is a lot going on with the dollar with key economic data likely to inject the currency with renewed vigour. Over the next few days, US consumer confidence data, Q1 GDP, consumer sentiment and the PCE deflator among other key reports will be published. Should they reinforce market expectations over the Federal Reserve aggressively raising interest rates, the dollar is set to appreciate further – dragging the GBPUSD lower.
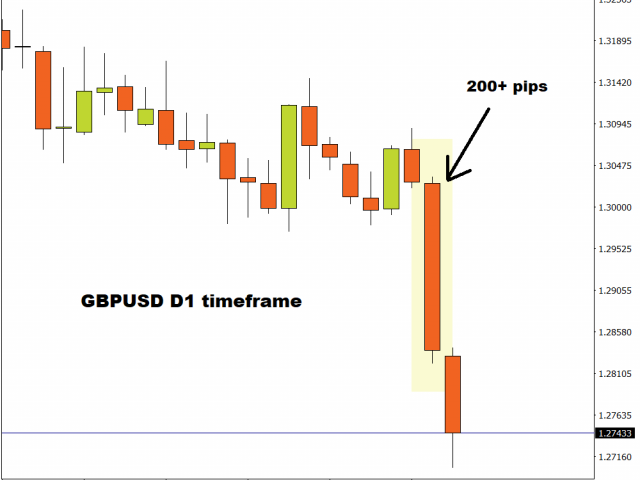
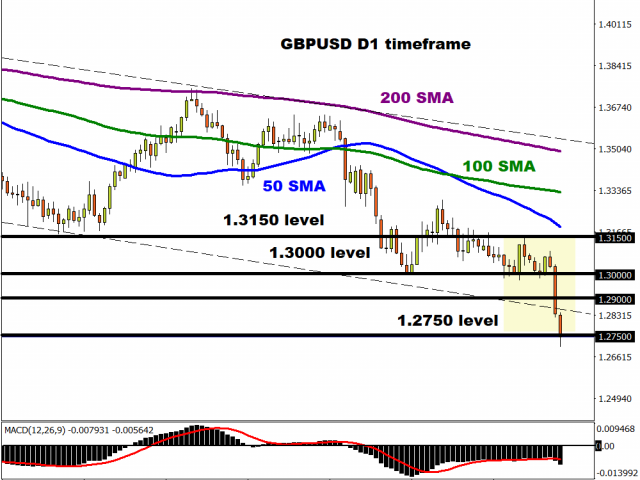
GBPUSD bears step into higher gear
The GBPUSD is heavily bearish on the daily timeframe as there have been consistently lower lows and lower highs. Prices are trading well below the 50, 100 and 200-day Simple Moving Average while the MACD trades below zero. Interestingly, the RSI has fallen below 30 which suggests that the GBPUSD could be oversold.
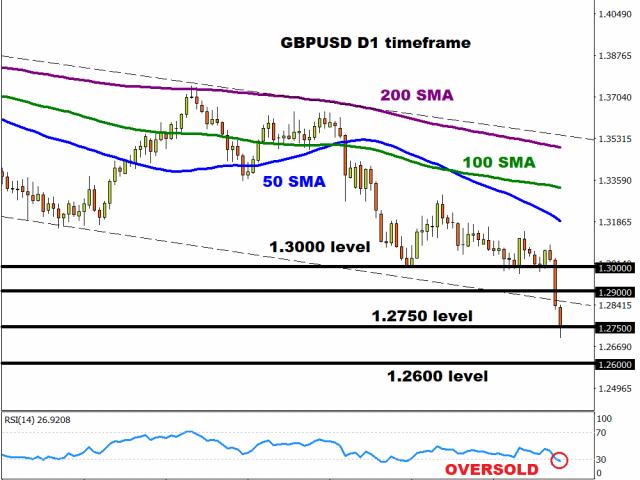
A solid daily close below the 1.2750 support level could see the currency pair sink towards 1.2600 before experiencing a technical bounce. Alternatively, should 1.2750 prove to be reliable support, the GBPUSD could rebound back towards 1.2900 before resuming the downtrend.
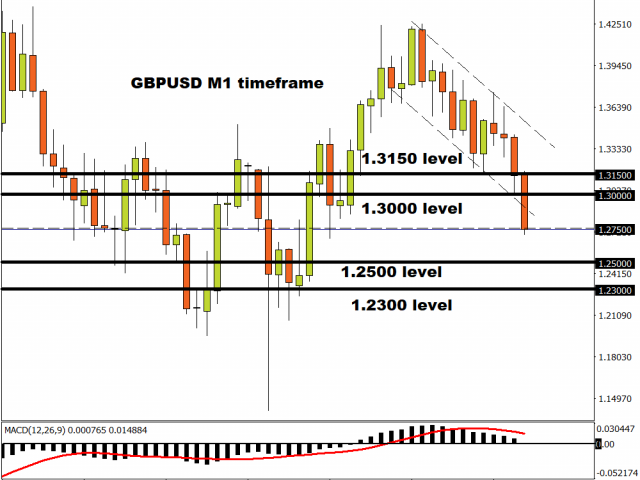
On the monthly timeframe, the GBPUSD is respecting a monthly bearish trend. A solid monthly close below 1.2750 could open the doors towards 1.2500 and 1.2300. If bears run out of steam, a move towards 1.3000 and 1.3150, respectively.
Disclaimer: The content in this article comprises personal opinions and should not be construed as containing personal and/or other investment advice and/or an offer of and/or solicitation for any transactions in financial instruments and/or a guarantee and/or prediction of future performance. ForexTime (FXTM), its affiliates, agents, directors, officers or employees do not guarantee the accuracy, validity, timeliness or completeness, of any information or data made available and assume no liability as to any loss arising from any investment based on the same.