
Article By RoboForex.com
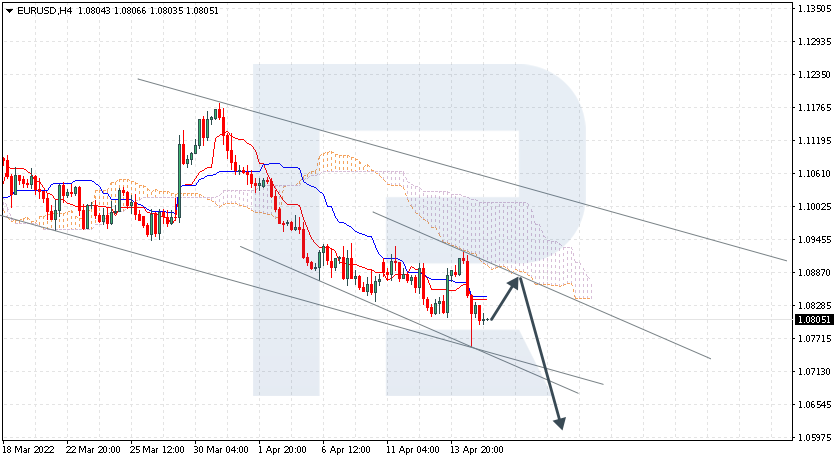
EURUSD, “Euro vs US Dollar”
EURUSD is rebounding from the support area at 1.0805; it managed to test the March low but not break it. The instrument is currently moving below Ichimoku Cloud, thus indicating a descending tendency. The markets could indicate that the price may test the cloud’s downside border at 1.0845 and then resume moving downwards to reach 1.0595. Another signal in favour of a further downtrend will be a rebound from the descending channel’s upside border. However, the bearish scenario may no longer be valid if the price breaks the cloud’s upside border and fixes above 1.0965. In this case, the pair may continue growing towards 1.1055.

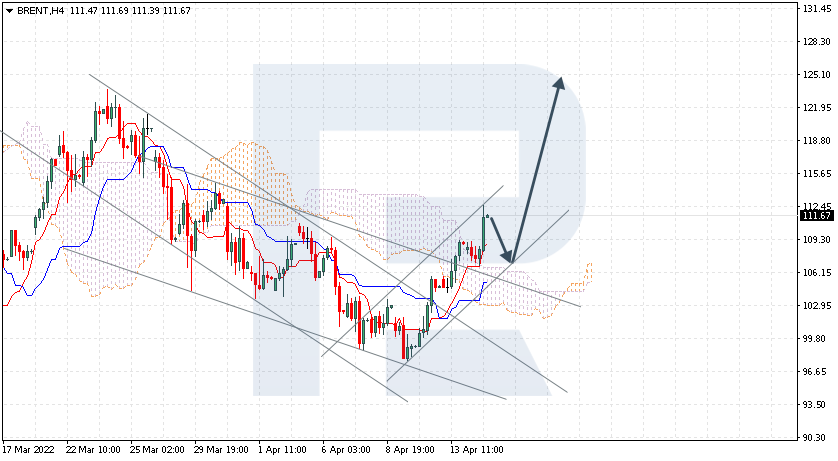
BRENT
Brent is still growing within the bullish impulse at 111.67. There were two rebounds from 98.00, that’s why the daily chart has the potential for the formation of a Double Bottom reversal pattern. To complete the pattern, bulls have to fix above 125.00 – after that, they may continue pushing the price up to 150.00. The instrument is currently moving above Ichimoku Cloud, thus indicating an ascending tendency. The markets could indicate that the price may test the cloud’s upside border at 107.55 and then resume moving upwards to reach 125.00. Another signal in favour of a further uptrend will be a rebound from the rising channel’s downside border. However, the bullish scenario may no longer be valid if the price breaks the cloud’s downside border and fixes below 100.00. In this case, the pair may continue falling towards 90.00.
Free Reports:
 Download Our Metatrader 4 Indicators – Put Our Free MetaTrader 4 Custom Indicators on your charts when you join our Weekly Newsletter
 Get our Weekly Commitment of Traders Reports - See where the biggest traders (Hedge Funds and Commercial Hedgers) are positioned in the futures markets on a weekly basis.
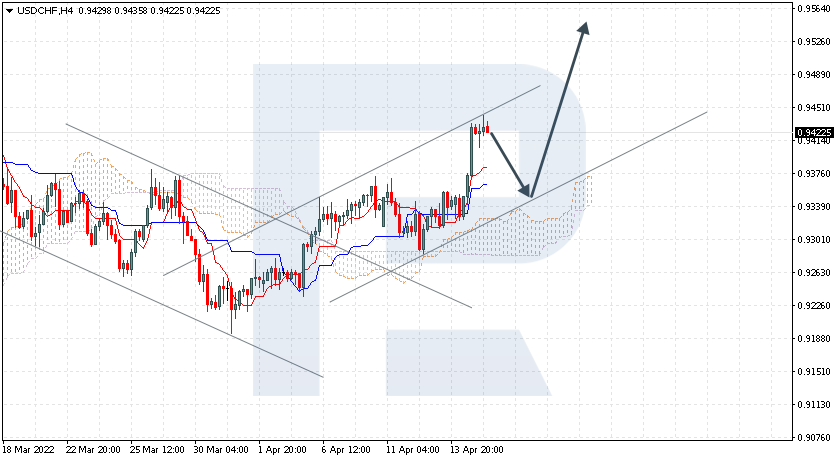
USDCHF, “US Dollar vs Swiss Franc”
USDCHF is growing steadily at 0.9422; it has rebounded from the cloud’s upside border. This quick movement completed an Upside-Down Head & Shoulders reversal pattern with the pattern materialisation target at 0.9570. however, as a rule, after breaking the “neckline”, the price usually gets back to test the broken line and resumes trading upwards only afterwards. The instrument is currently moving above Ichimoku Cloud, thus indicating an ascending tendency. The markets could indicate that the price may test Tenkan-Sen and Kijun-Sen at 0.9355 and then resume moving upwards to reach 0.9525. Another signal in favour of a further uptrend will be a rebound from the rising channel’s downside border. However, the bullish scenario may no longer be valid if the price breaks the cloud’s downside border and fixes below 0.9260. In this case, the pair may continue falling towards 0.9170.
Article By RoboForex.com
Attention!
Forecasts presented in this section only reflect the author’s private opinion and should not be considered as guidance for trading. RoboForex LP bears no responsibility for trading results based on trading recommendations described in these analytical reviews.

- COT Metals Charts: Weekly Speculator Bets led by Copper & Steel Jul 18, 2026
- COT Bonds Charts: Weekly Speculator Bets led by 2-Year, SOFR 3M & 5-Year Bonds Jul 18, 2026
- COT Energy Charts: Weekly Speculator Bets led by Brent Oil & Heating Oil Jul 18, 2026
- COT Soft Commodities Charts: Weekly Speculator Bets led by Wheat, Corn & Soybean Meal Jul 18, 2026
- The Bank of Canada kept its interest rate unchanged. Platinum prices reached a three‑week high Jul 16, 2026
- Stock indices rose after the release of US inflation data. China’s GDP slowed sharply Jul 15, 2026
- GBP/USD Awaits Political News: What Will Happen Next Jul 15, 2026
- USD/JPY Holds at Highs: Pressure Lingers on Yen Jul 14, 2026
- Oil prices jumped 4% amid a new wave of escalation between the US and Iran Jul 13, 2026
- EUR/USD: US Inflation Will Determine Everything Jul 13, 2026