
by JustForex
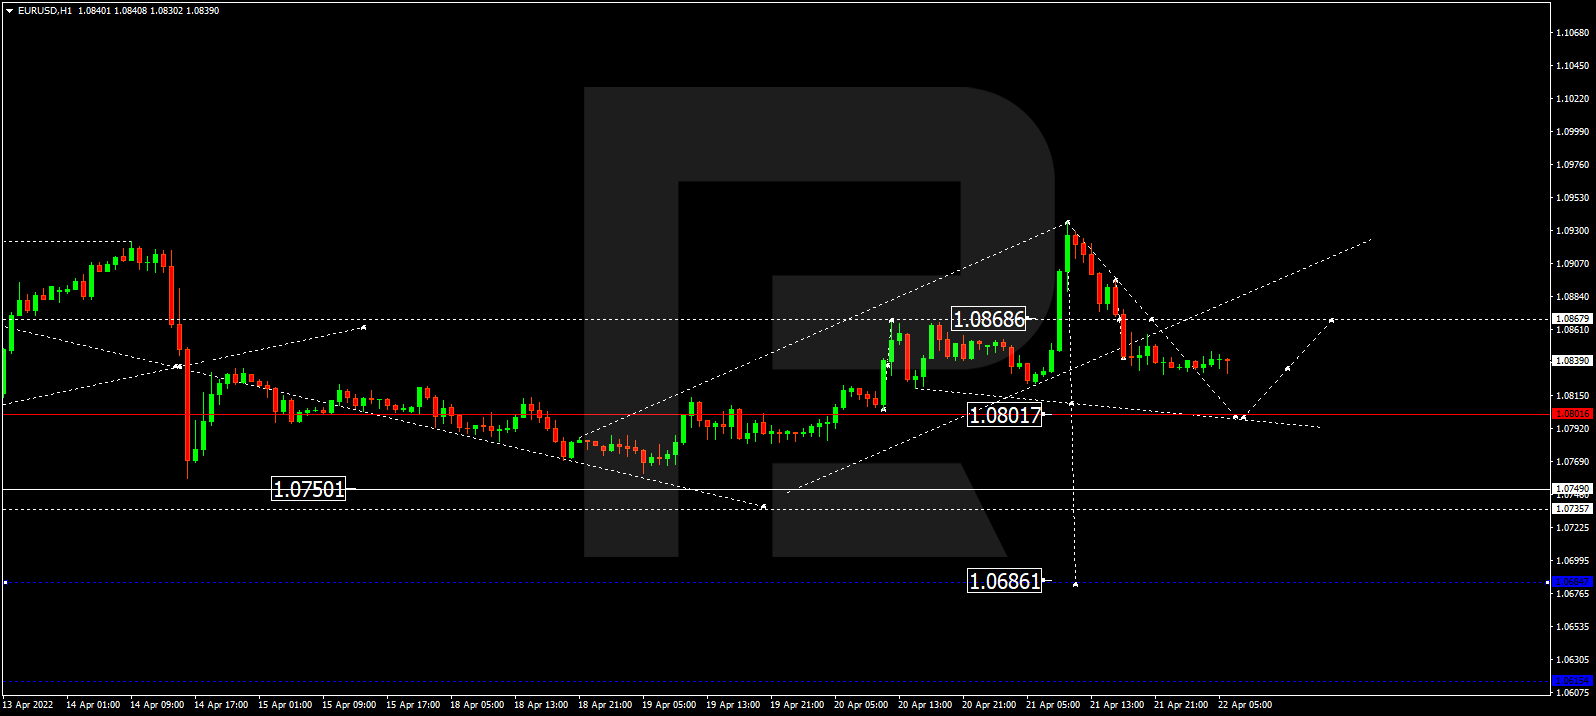
The EUR/USD currency pair
- Prev Open: 1.0834
- Prev Close: 1.0796
- % chg. over the last day: -0.35%
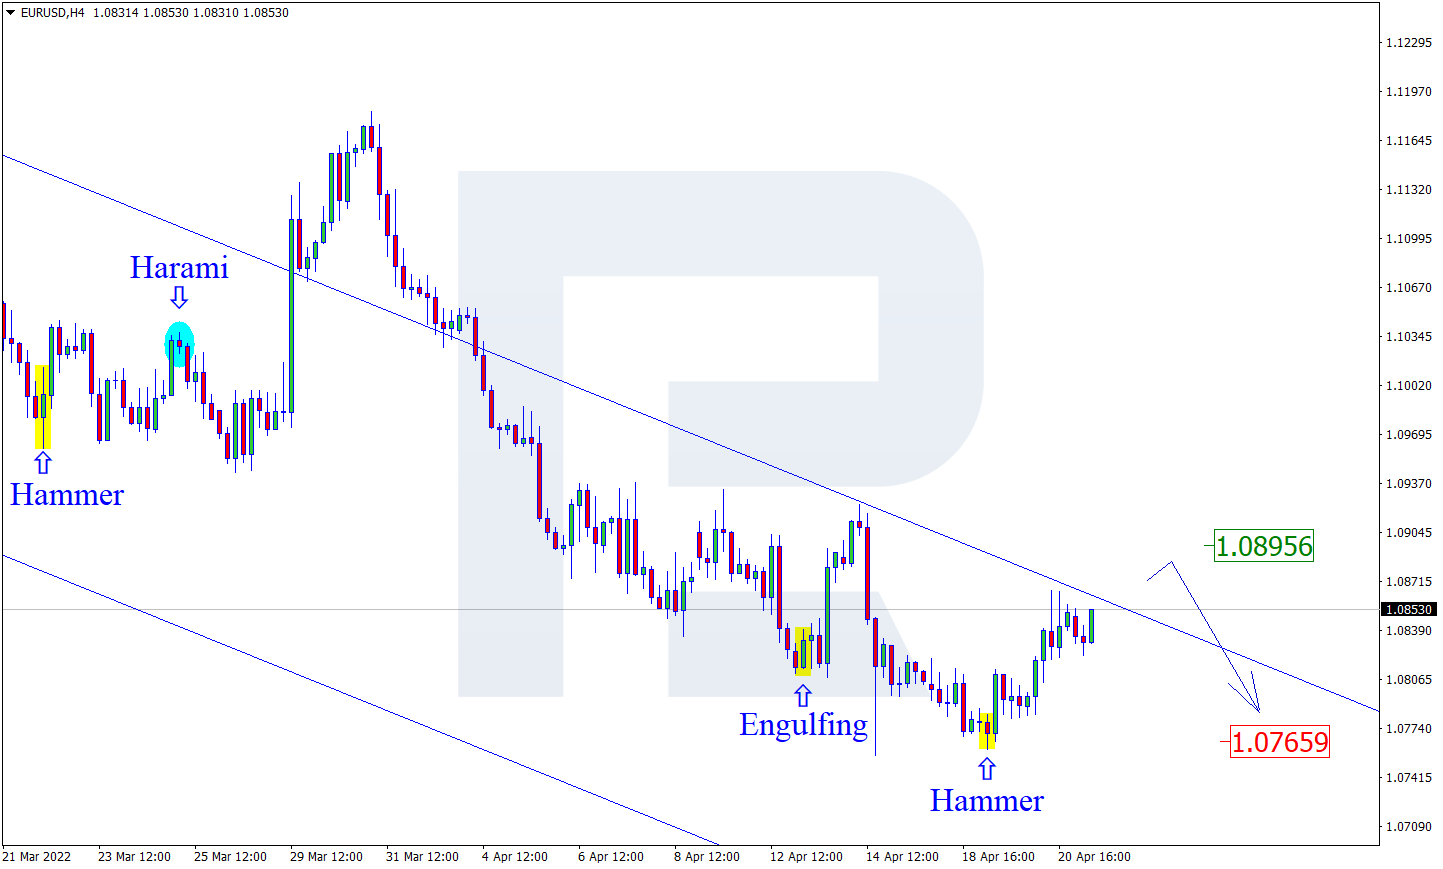
US manufacturing growth accelerated in March as robust demand and improved forecast countered negative cost pressures. Economic growth in the Eurozone accelerated in April as a rebound in the services sector helped offset stagnant manufacturing output. Business expectations in Europe for next year increased from a 17-month low. However, confidence remains low as fears of the war in Ukraine, rising prices, and the lingering effects of the pandemic are not optimistic.
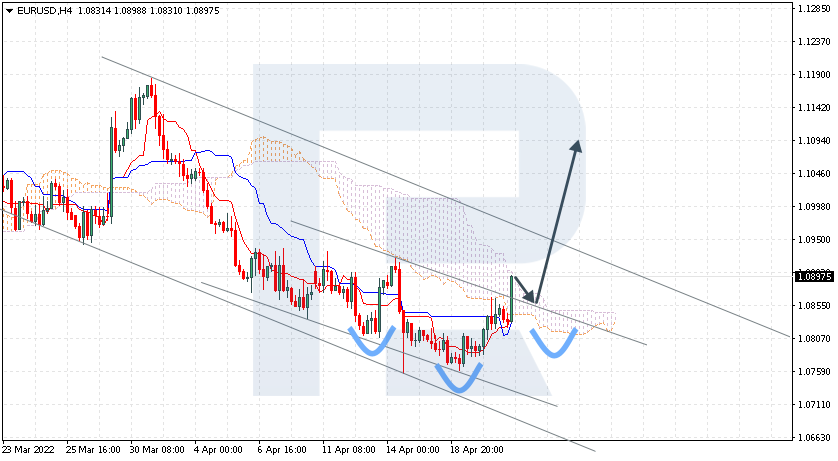
- Support levels: 1.0727
- Resistance levels: 1.0770, 1.0870, 1.0908, 1.0958, 1.1027, 1.1196, 1.1291
From the technical point of view, the trend on the EUR/USD currency pair on the hourly time frame is bearish. Growth in the dollar index led to the fall of the European currency. The MACD indicator has become negative, and the selling pressure has increased. Under such market conditions, it is possible to look for buy trades on intraday timeframes from the support level of 1.0727, but only with short targets and confirmation. Sell trades should be considered from the resistance level of 1.0870 or 1.0908, but only after the additional confirmation.
Alternative scenario: if the price breaks out through the 1.0958 resistance level and fixes above, the uptrend will likely resume.

- – Eurozone Germany Ifo Business Climate (m/m) at 11:00 (GMT+2).
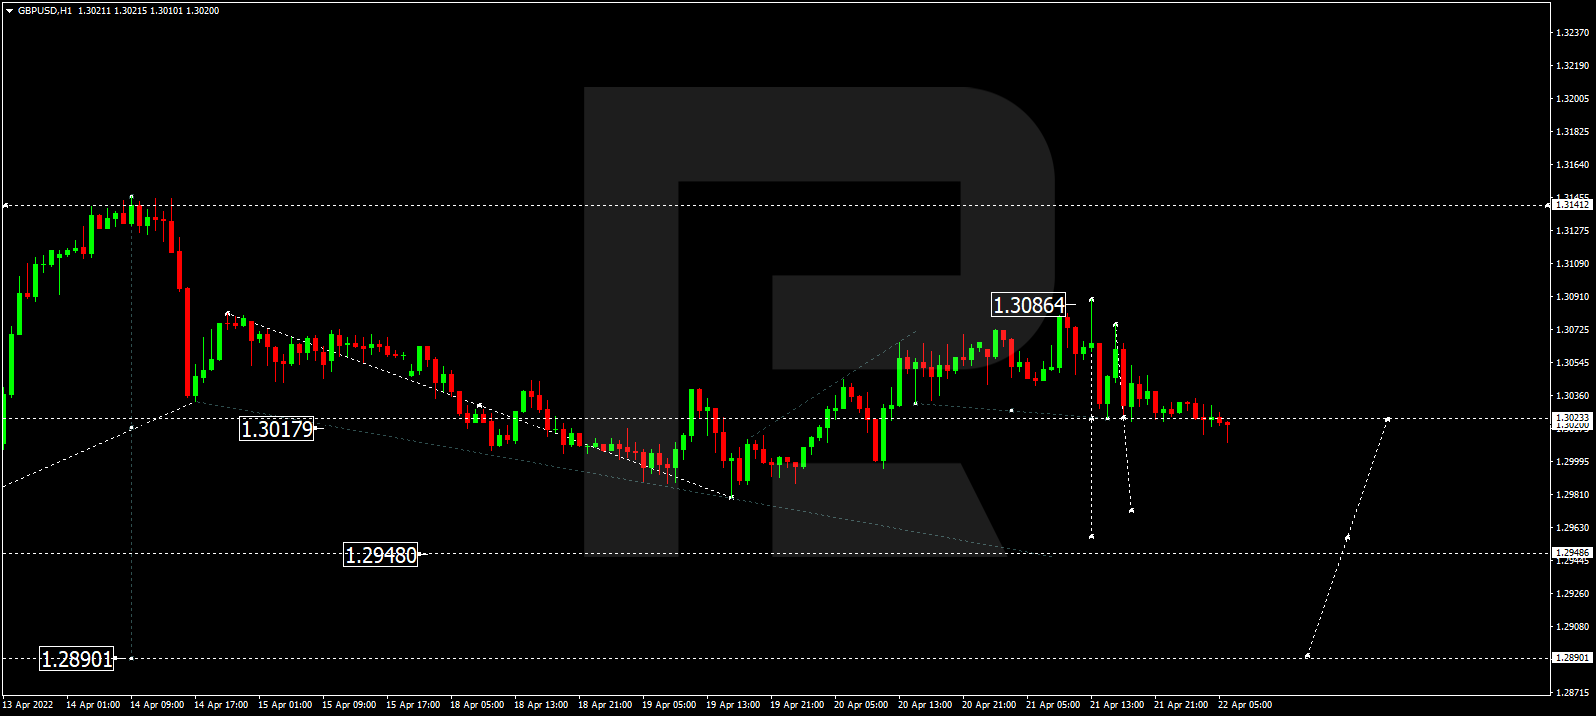
The GBP/USD currency pair
- Prev Open: 1.3028
- Prev Close: 1.2832
- % chg. over the last day: -1.52%
UK PMI data showed steady growth in March as further recovery from COVID-19 restraint helped offset the downside. Yet the war in Ukraine has led to unprecedented price increases and reduced business confidence to a year-and-a-half low. The largest increase in selling prices of goods and services in the survey’s history took place in March, and consumer price inflation will continue to rise in the coming months. Analysts predict an undesirable pattern of “stagflation” for the UK economy.
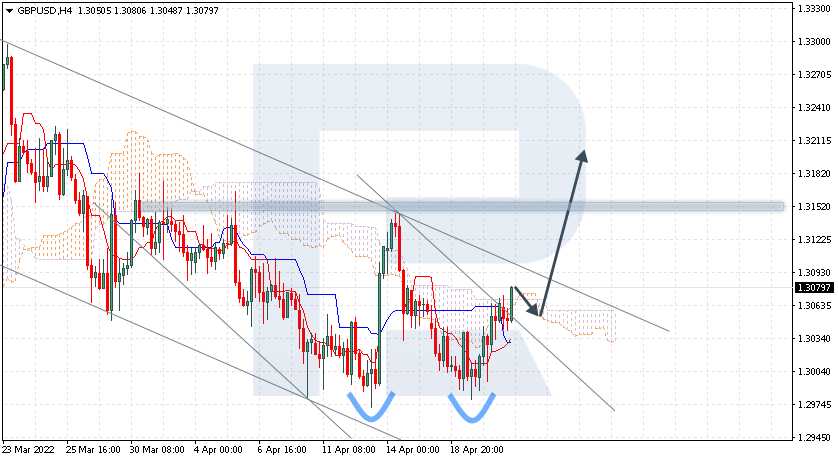
- Support levels: 1.2719
- Resistance levels: 1.2801, 1.2862, 1.2919, 1.2981, 1.3010, 1.3083, 1.3115
On the hourly time frame, the GBP/USD currency pair trend is still bearish. The price fell sharply on Friday amid a likely “stagflationary” scenario for the UK. The MACD indicator has become negative, with no signs of a reversal. Under such market conditions, sell trades should be looked for from the resistance level of 1.2918, but with confirmation. For buy deals, traders may consider the level of 1.2719, but only after the appearance of a bullish initiative and with short targets.
Alternative scenario: if the price breaks down through the 1.3083 resistance level and fixes above, the mid-term uptrend will likely be resumed.

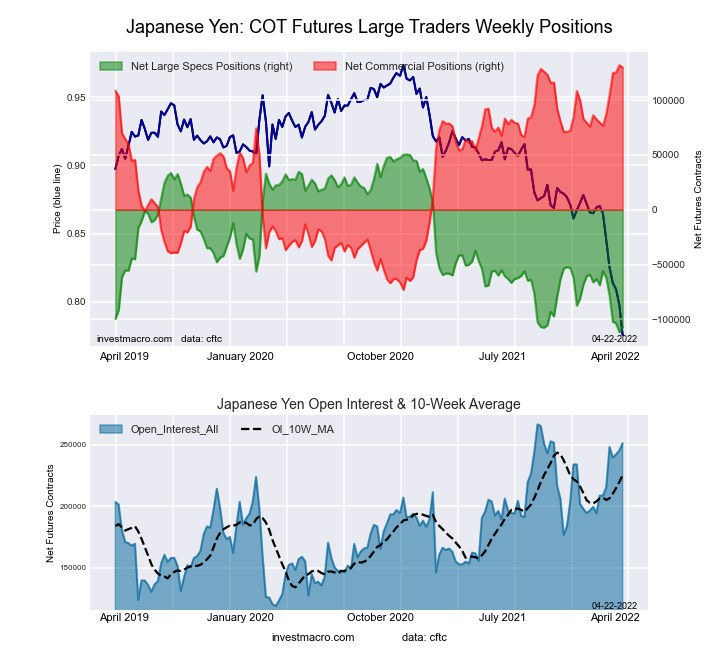
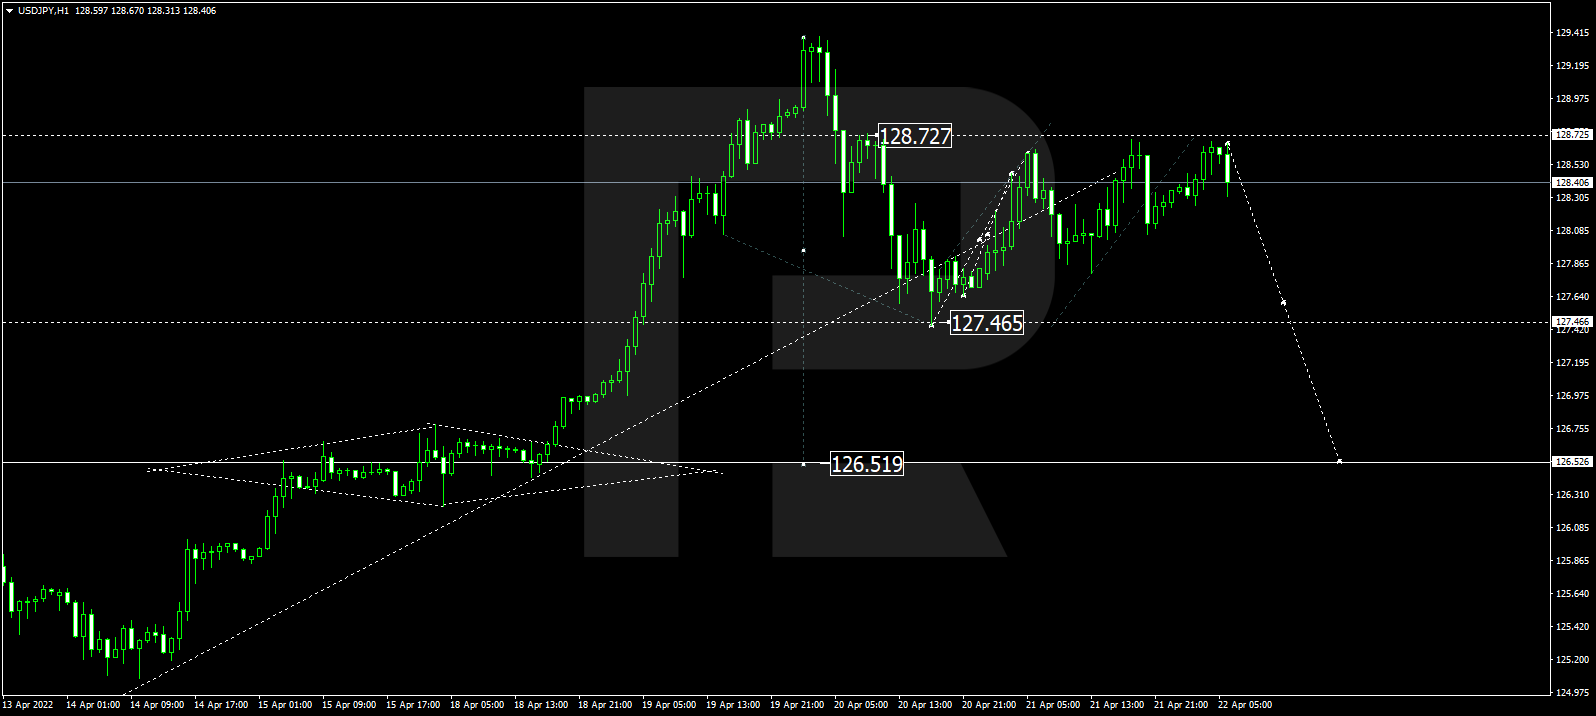
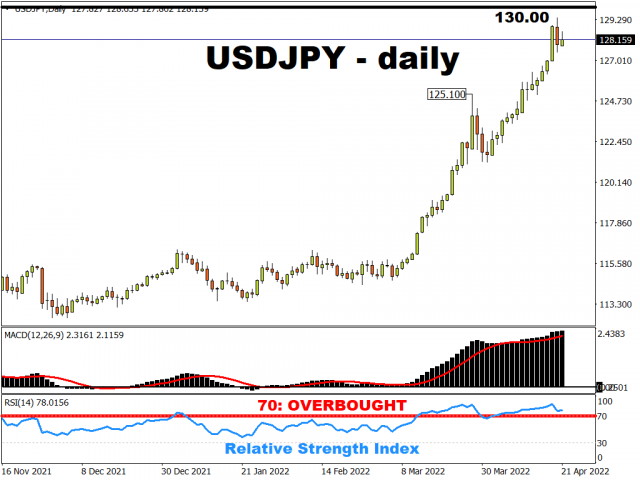
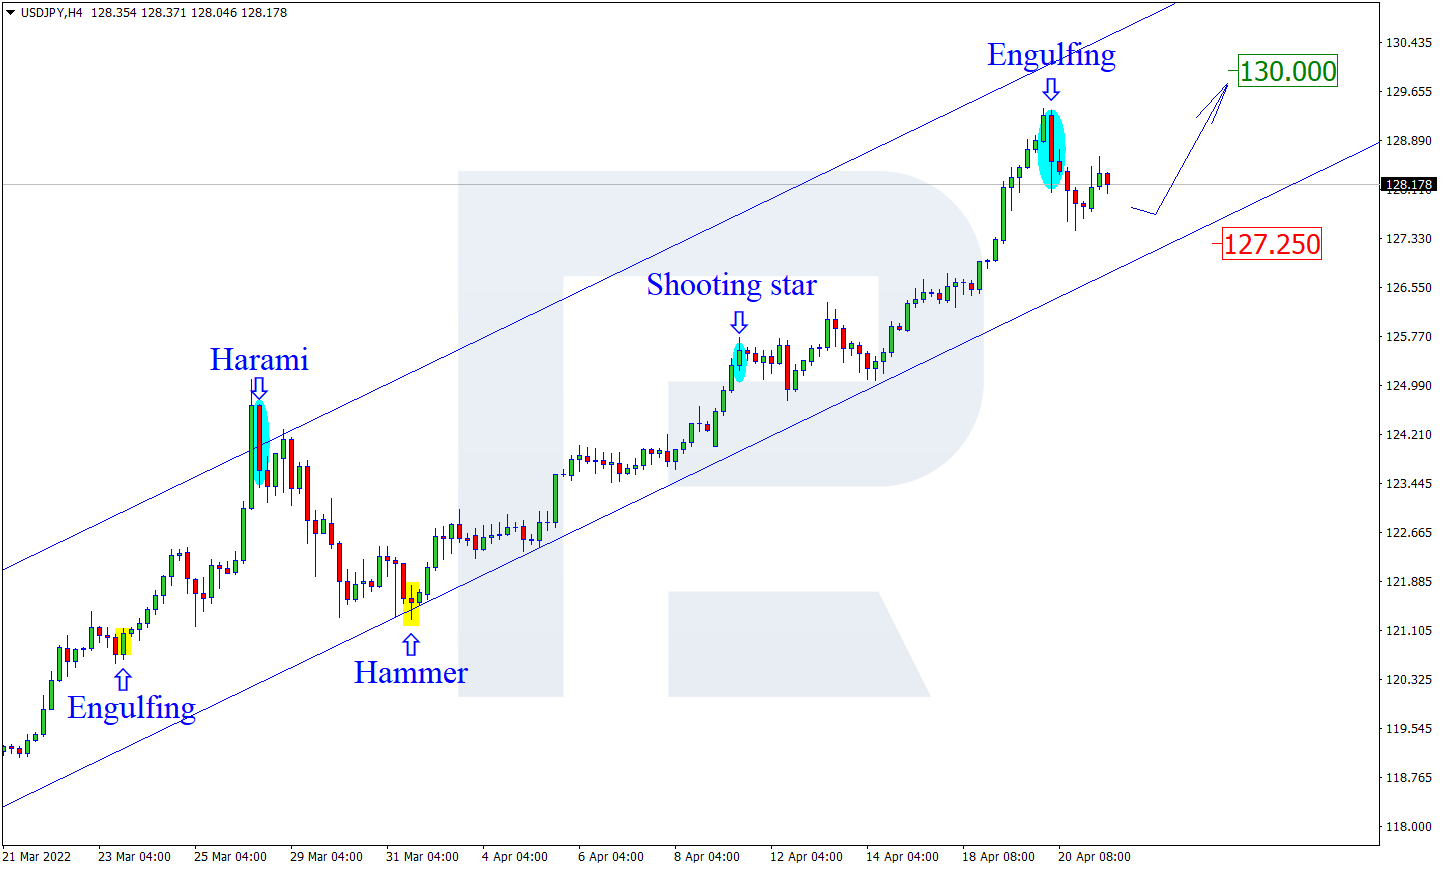
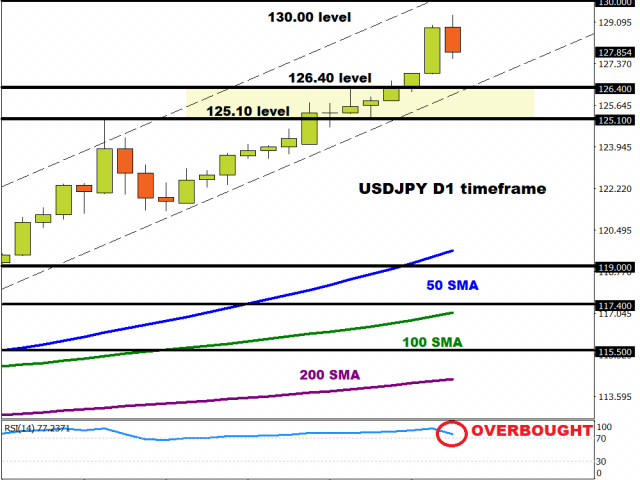
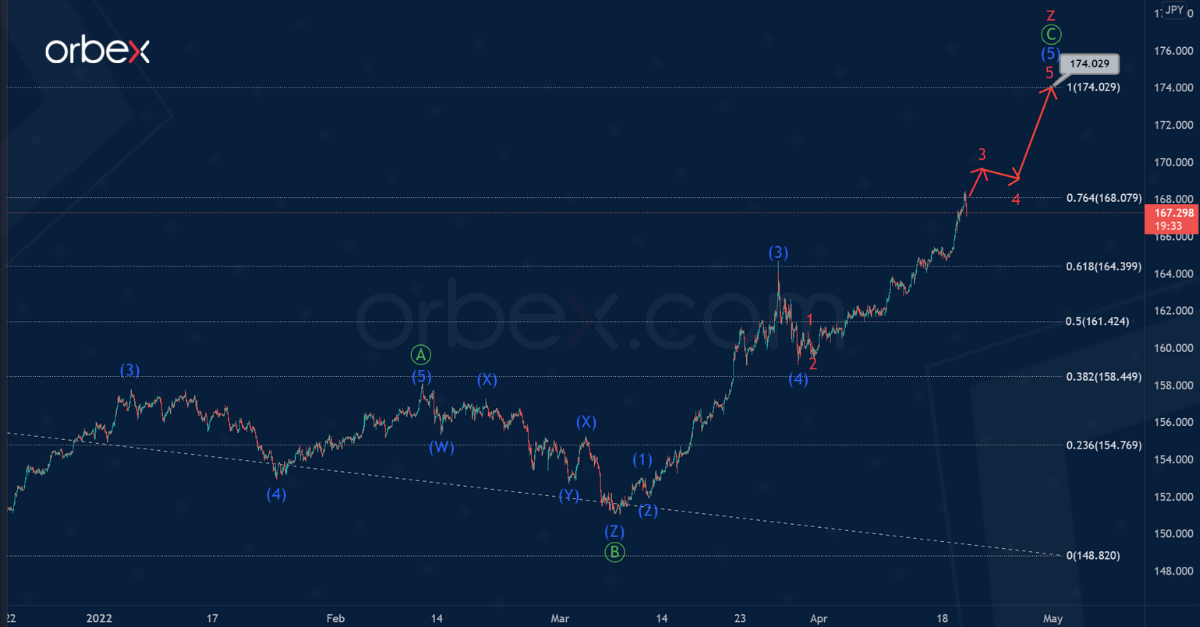
The USD/JPY currency pair
- Prev Open: 128.33
- Prev Close: 128.46
- % chg. over the last day: +0.10%
The monetary policy of the Bank of Japan remains unchanged. The central bank uses an ultra-soft approach to push the inflation rate closer to the 2% target. The Bank of Japan will hold its next monetary policy meeting this week, but analysts do not expect changes. Thus, fundamentally, USD/JPY quotes tend to rise as the Fed tightens monetary policy, which leads to a rise in the dollar index. But traders should not forget that the Bank of Japan will enter the debt market and sell government bonds to prevent a significant depreciation of the yen in a short period of time. Therefore, a correction might occur soon.
- Support levels: 126.69, 125.72, 124.66, 124.24, 122.97, 122.63, 121.81
- Resistance levels: 128.83, 129.36
The medium-term trend on the USD/JPY currency pair is bullish. The MACD indicator has become inactive, but the divergence is still visible on the higher timeframes. The price is trading in a narrow corridor. Under such market conditions, it is best to look for buy deals, expecting the continuation of the uptrend, but after the price makes a pullback to the average lines and the nearest support levels. First of all, it is worth considering the support level of 126.69, but with additional confirmation. A resistance level of 128.83 may be considered for sell deals, but only with short targets.
Alternative scenario: If the price fixes below 124.66, the uptrend will likely be broken.

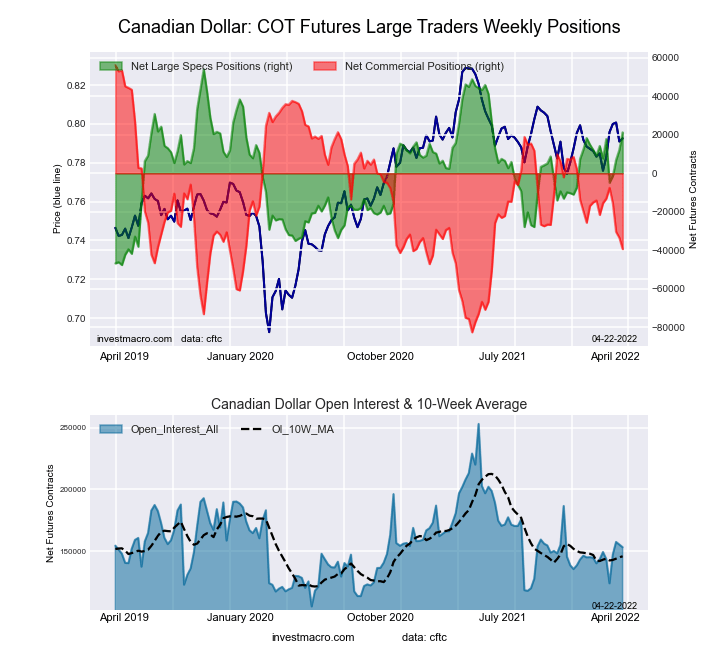
The USD/CAD currency pair
- Prev Open: 1.2579
- Prev Close: 1.2708
- % chg. over the last day: +1.02%
The Canadian dollar is a commodity currency, highly dependent on oil price dynamics and the dollar index. The dollar index on Friday continued to grow amid statements by the Fed officials, while oil prices remained at the same level. As a result, the USD/CAD currency pair also increased. Fundamentally, there are currently no prerequisites for a medium-term trend in USD/CAD.
- Support levels: 1.2644, 1.2607, 1.2521
- Resistance levels: 1.2714, 1.2849
The USD/CAD currency pair is bullish in terms of technical analysis. Buying pressure is still high, but the price has deviated strongly from the average values. The MACD indicator has become positive, with no signs of reversal. Trade is worth it only with short targets. Under such market conditions, it is better to look for buy trades on the lower timeframes from the support level of 1.2607 or 1.2644, but it is better with additional confirmation. For sell deals, it is better to consider the resistance level of 1.2849, but it is also better with confirmation and short targets.
Alternative scenario: if the price breaks through and consolidates below 1.2521, the downtrend will likely be resumed.

- – Canada Boc Gov Macklem Speaks at 18:00 (GMT+2).
by JustForex
This article reflects a personal opinion and should not be interpreted as an investment advice, and/or offer, and/or a persistent request for carrying out financial transactions, and/or a guarantee, and/or a forecast of future events.


