The pound surged after the UK saw a jump in average earnings over the past three months. Solid bullish momentum above 1.2400 has prompted sellers to cover their positions, exacerbating volatility in the process. The daily resistance at 1.2640 coincides with the 30-day moving average and is an important supply zone. Its breach could pave the way for a bullish reversal in the weeks to come. In the meantime, an overbought RSI may cause a pullback as intraday buyers take profit. 1.2310 is the closest support.
USDJPY enters narrowing consolidation
The yen recouped some losses after Japan’s GDP growth beat expectations in Q1. The US dollar is taking a breather after a prolonged rally. The latest retreat has found support at 127.50 over the 30-day moving average. Medium-term sentiment would stay upbeat as long as the price remains above this demand zone. 130.80 from a previously faded rebound is a key resistance and a bullish breakout could resume the rally towards 133.00. 128.70 is the immediate support for the current consolidation.
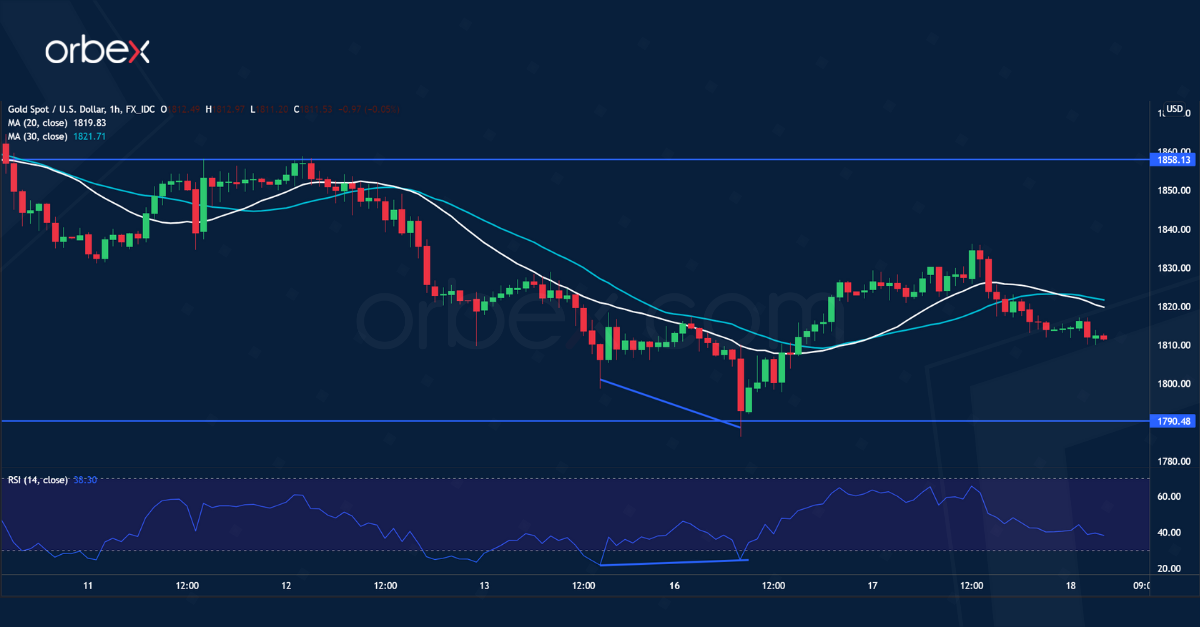
XAUUSD tests critical floor
Gold inched higher as the US dollar index pulled back from a two-decade high. The price action has stabilised near January’s lows at 1790. A bullish RSI divergence indicates a loss of bearish momentum in this critical demand area, triggering a buy-the-dip behaviour. Sellers’ profit-taking could drive the precious metal higher. A bounce above 1858 may trigger an even broader short-covering. On the downside, a fall below 1790 would send the price into bearish territory with December’s lows (1750) as the next stop.
Orbex is a fully licensed broker that was established in 2011. Founded with a mission to serve its traders responsibly and provides traders with access to the world’s largest and most liquid financial markets. www.orbex.com
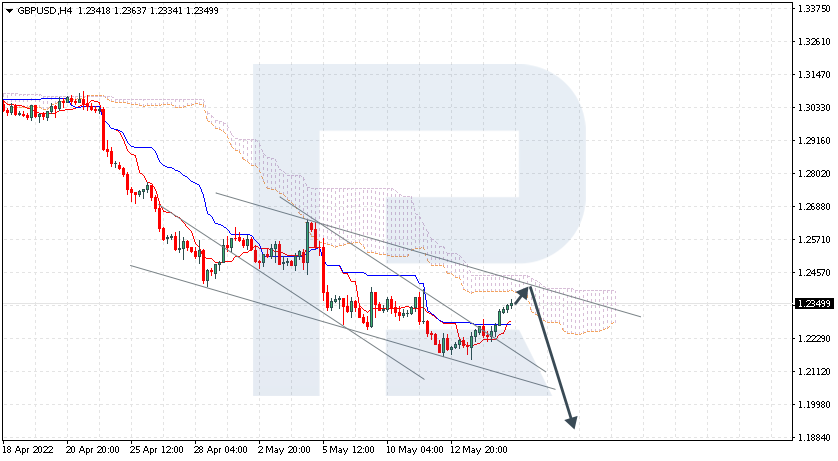
GBPUSD is correcting within the bearish channel. The instrument is currently moving below Ichimoku Cloud, thus indicating a descending tendency. The markets could indicate that the price may test the cloud’s upside border at 1.2365 and then resume moving downwards to reach 1.1945 Another signal in favour of a further downtrend will be a rebound from the descending channel’s upside border. However, the bearish scenario may no longer be valid if the price breaks the cloud’s upside border and fixes above 1.2465. In this case, the pair may continue growing towards 1.2555.
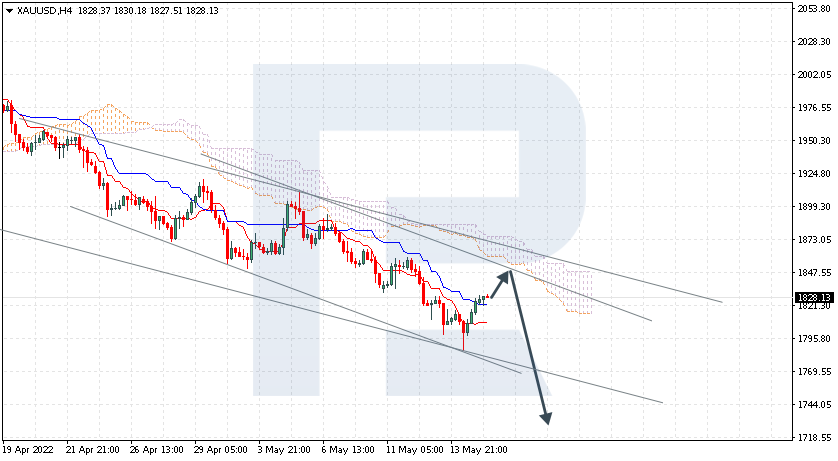
XAUUSD, “Gold vs US Dollar”
XAUUSD has fixed above Tenkan-Sen and Kijun-Sen. The instrument is currently moving below Ichimoku Cloud, thus indicating a descending tendency. The markets could indicate that the price may test the cloud’s downside border at 1850.00 and then resume moving downwards to reach 1735.00. Another signal in favour of a further downtrend will be a rebound from the descending channel’s upside border. However, the bearish scenario may no longer be valid if the price breaks the cloud’s upside border and fixes above 1880.00. In this case, the pair may continue growing towards 1915.00.
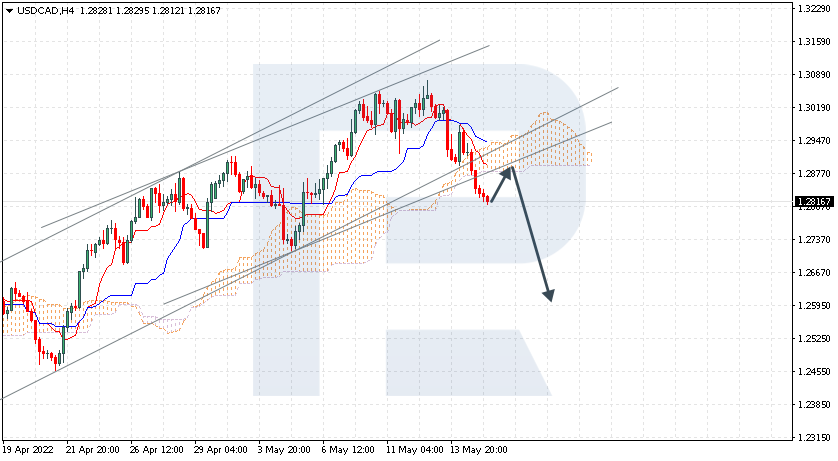
USDCAD, “US Dollar vs Canadian Dollar”
USDCAD is no longer moving within the bullish channel. The instrument is currently moving below Ichimoku Cloud, thus indicating a descending tendency. The markets could indicate that the price may test the cloud’s downside border at 1.2875 and then resume moving downwards to reach 1.2595. Another signal in favour of a further downtrend will be a rebound from the rising channel’s downside border. However, the bearish scenario may no longer be valid if the price breaks the cloud’s upside border and fixes above 1.3035. In this case, the pair may continue growing towards 1.3125.
Attention! Forecasts presented in this section only reflect the author’s private opinion and should not be considered as guidance for trading. RoboForex LP bears no responsibility for trading results based on trading recommendations described in these analytical reviews.
The Pound sterling continues recovering against the USD on Tuesday. The current quote for the instrument is 1.2458.
A short pause in the USD rally allows other traded currencies to reach stability or even recover a little bit. However, nothing really changes strategically.
Earlier today, the United Kingdom released the first of the two huge pieces of macroeconomic statistics planned for this week. First of all, the Unemployment Rate in the country was 3.7% in March after being 3.8% in February. The indicator wasn’t expected to change, so the actual reading might be considered positive. The Claimant Count Change showed -56.9K in April against the expected reading of -42.3K. The Average Earnings Index added 7.0% 3m/y after gaining 5.6% 3m/y the quarter before and against market expectations of 5.4% 3m/y.
The situation might be explained in the following way: in April, businesses and enterprises started feeling the negative external background, which only worsened the situation. However, they managed to save jobs and increase salaries adjusting for inflation. Probably, they might be able to hold this position for another quarter, but then the external pressure will come in full force. This, in turn, might lead to the disintegration of job and salary prospects.
The labour market, no matter how strong it may seem, didn’t completely recover after the pandemic – this process requires much time. one shouldn’t also forget about the Brexit issues – Northern Ireland turned out to be a sticking point in trade negotiations. In addition, interruptions in deliveries didn’t’ go anywhere. It appears that there are more complications than glimmers of hope and optimism right now. and that’s not good news for the Pound.
Attention! Forecasts presented in this section only reflect the author’s private opinion and should not be considered as guidance for trading. RoboForex LP bears no responsibility for trading results based on trading recommendations described in these analytical reviews.
More and more ECB representatives are inclined to raise the interest rate at the July meeting. At the same time, analysts are predicting that the ECB is likely to decide to end its stimulus program at its next meeting. The European currency has already started to strengthen a bit by this scenario, but it should be noted that by the summer the interest rate will be about 0.25% in Europe, while the US rate will be around 2%. This disbalance will cause EUR/USD quotes to decline in the mid-term.
From the technical point of view, the trend of the EUR/USD currency pair on the hourly time frame is still bearish. The MACD indicator became positive, the buyers began to show initiative, but it is weak. Under such market conditions, traders can look for sell deals from the resistance level of 1.0484, but only after the additional confirmation. Buy trades can be considered on intraday timeframes from the support level of 1.0379, but only with short targets and confirmation.
Alternative scenario: if the price breaks out through the 1.0588 resistance level and fixes above, the uptrend will likely resume.
News feed for 2022.05.17:
– Eurozone Italian Consumer Price Index (m/m) at 12:00 (GMT+3);
– Eurozone GDP (q/q) at 12:00 (GMT+3);
– US FOMC Member Bullard Speaks at 15:00 (GMT+3);
– US Retail Sales (m/m) at 15:30 (GMT+3);
– US Industrial Production (m/m) at 16:15 (GMT+3);
– Eurozone ECB President Lagarde Speaks at 20:00 (GMT+3);
– US Fed Chair Powell Speaks at 21:00 (GMT+3);
– US FOMC Member Mester Speaks at 21:30 (GMT+3).
The GBP/USD currency pair
Technical indicators of the currency pair:
Prev Open: 1.2240
Prev Close: 1.2319
% chg. over the last day: +0.64%
The Governor of the Bank of England warned yesterday that “apocalyptic” food and energy prices are coming in Britain. The Bank of England said inflation is likely to peak at 10.25% in the last quarter of 2022. This will affect domestic demand and reduce activity and is likely to lead to an increase in unemployment. Also, Bailey added that raising the Bank of England’s interest rate is not enough to keep inflation within the target range. Michael Saunders of the Bank’s Monetary Policy Committee said that he believes a tighter monetary policy would do little to change the current level of inflation.
On the hourly time frame, the GBP/USD currency pair trend is still bearish. The MACD indicator became positive and there is a slight buying pressure. Under such market conditions, sell trades should be looked for from the resistance level of 1.2338, but with additional confirmation. For buy deals, traders may consider the level of 1.2283 or 1.2199, but only with additional confirmation in the form of a buyers’ initiative.
Alternative scenario: if the price breaks down through the 1.2450 resistance level and fixes above, the mid-term uptrend will likely be resumed.
News feed for 2022.05.17:
– UK Average Earnings Index (m/m) at 09:00 (GMT+3);
– UK Claimant Count Change (m/m) at 09:00 (GMT+3);
– UK Unemployment Rate (m/m) at 09:00 (GMT+3).
The USD/JPY currency pair
Technical indicators of the currency pair:
Prev Open: 129.24
Prev Close: 129.15
% chg. over the last day: -0.07%
Deputy Governor of the Bank of Japan Amamiya says that he does not expect further increases in energy and commodity prices. If his assumption is correct, inflation in Japan will fall again, and as a result, the Bank of Japan will continue its soft monetary policy, which is negative for the Japanese Yen.
Trading recommendations
Support levels: 129.02, 126.91, 126.00, 125.57
Resistance levels: 129.74, 130.12, 130.99
The medium-term trend on the USD/JPY currency has changed to bearish. The price has confidently broken through the priority change level and is now trading between the moving averages. Despite the change in the trend on the hour timeframe, it is better to look for buy deals with the expectation of an uptrend continuation, since the Japanese Yen has no fundamental support. First of all, it is worth considering the support level of 129.02, but with confirmation. A resistance level of 129.74 may be considered for sell deals, but only with additional confirmation.
Alternative scenario: If the price fixes above 130.99, the uptrend will likely be resumed.
There is no news feed for today.
The USD/CAD currency pair
Technical indicators of the currency pair:
Prev Open: 1.2915
Prev Close: 1.2846
% chg. over the last day: -0.54%
The Canadian dollar is a commodity currency and is highly dependent not only on the monetary policy of the Bank of Canada but also on the dynamics of the dollar index and oil prices. Oil prices added another 3% yesterday as OPEC is suppressing any production increases. In turn, Canada’s economic indicators are showing growth, which along with low unemployment will force the Bank of Canada to move to a more aggressive monetary policy. This situation, along with rising oil prices, will strengthen the Canadian dollar.
Trading recommendations
Support levels: 1.2774, 1.2692, 1.2644, 1.2607, 1.2521
The USD/CAD currency pair trend has changed to bearish in terms of technical analysis. The price broke through the priority change level and consolidated below the moving averages. The MACD indicator has become negative, and the sellers’ pressure has increased. It is worth trading only with short targets because fundamentally both the dollar index and the Canadian dollar are inclined to grow. Under such market conditions buy trades should be considered on the lower timeframes from the support level of 1.2774, but only with additional confirmation. For sell deals, it is better to consider the resistance level of 1.2875 or 1.2904, but also better with confirmation and short targets.
Alternative scenario: if the price breaks through and consolidates above 1.3000, the uptrend will likely be resumed.
This article reflects a personal opinion and should not be interpreted as an investment advice, and/or offer, and/or a persistent request for carrying out financial transactions, and/or a guarantee, and/or a forecast of future events.
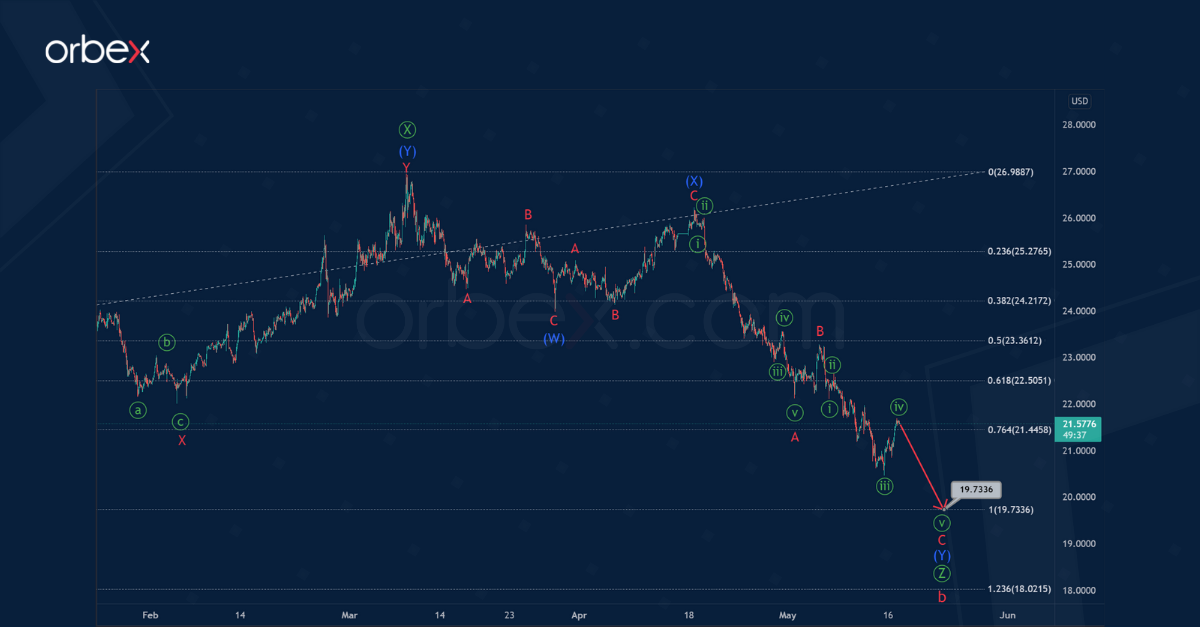
The XAGUSD pair hints at the development of a long correction wave b of the cycle degree.
Wave b, judging by the shape, is a primary triple zigzag Ⓦ-Ⓧ-Ⓨ-Ⓧ-Ⓩ.
The final wave Ⓩ will be an intermediate triple zigzag (W)-(X)-(Y)-(X)-(Z). It seems that the formation of the actionary intermediate wave (Y) has recently come to an end. This took the form of a standard zigzag pattern.
Now we are observing the construction of the initial part of the intermediate intervening wave (X). This can also take the form of a minor zigzag A-B-C, as shown in the chart.
The end of the wave (X) is expected to reach 23.334. At that level, it will be at 50% of sub-wave (Y).
The alternative scenario indicates that the bearish primary wave Ⓩ could end in the form of a double zigzag (W)-(X)-(Y), and much earlier than expected in the main scenario.
Most likely, the market is now in the final part of the actionary wave (Y), or rather in its final minor sub-wave C.
It is likely that wave C will end in the form of a minute impulse near 19.733. At the indicated price point, primary wave Ⓩ will be equal to previous actionary wave Ⓨ.
Orbex is a fully licensed broker that was established in 2011. Founded with a mission to serve its traders responsibly and provides traders with access to the world’s largest and most liquid financial markets. www.orbex.com
The euro edged higher after an ECB official supported the idea of a stronger currency to combat inflation. The pair is bouncing off December 2017’s lows at 1.0350. The RSI’s oversold situation on both daily and hourly charts led some sellers to cover as a wave of profit-taking could help the euro snap back from this demand zone. The bias remains down unless the bulls lift the first hurdle (1.0530) from the latest sell-off. 1.0640 on the 30-day moving average is a major resistance to clear before a bullish reversal could happen.
NZDUSD stays under pressure
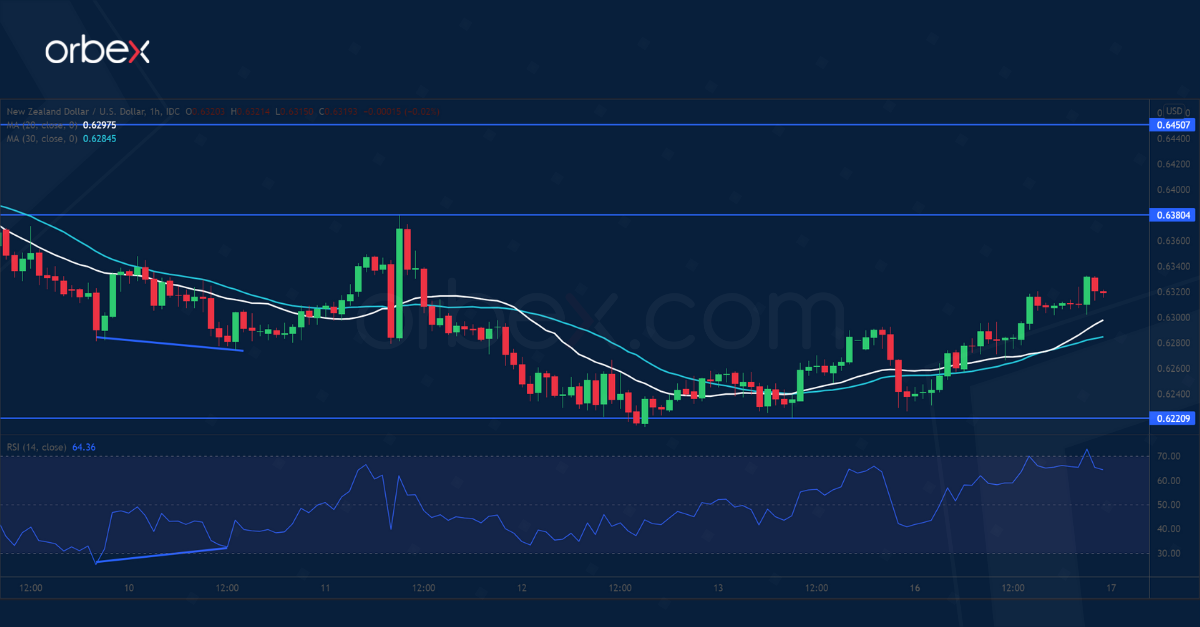
The New Zealand dollar recovers as weak data from China may trigger more policy support. The RSI’s double dip into the oversold territory shows an overextension. The sell-off has become such a crowded one-way trade and the kiwi could use some breathing room. A bullish RSI divergence suggests a slowdown in the downtrend but needs a breakout to confirm buying interest. 0.6380 is a fresh resistance and 0.6450 on the 20-day moving average a major obstacle. A drop below 0.6220 would further extend the kiwi’s losses.
US 30 tests resistance
The Dow Jones 30 struggles as investors still ponder a recession scenario. A break below the daily support at 32600 has put the bulls on the defensive. Bargain hunting may cause limited rebounds, but the lack of buying momentum means that the mood is still extremely cautious. 32600 has become a resistance and its breach could extend the recovery to 34000, where sell orders could be expected from trend followers. 31250 is the closest support and a breakout may send the index to the psychological level of 30000.
Orbex is a fully licensed broker that was established in 2011. Founded with a mission to serve its traders responsibly and provides traders with access to the world’s largest and most liquid financial markets. www.orbex.com
The mighty dollar kicked off the week in a shaky fashion despite crossing above 105.0 last Friday, its highest level since December 2002!
Nevertheless, it has appreciated against almost every single G10 currency this month thanks to Fed hike expectations and risk aversion stemming from not only global growth concerns but ongoing geopolitical risks.
With the Dollar Index (DXY) hovering around levels not seen in 20 years and the fundamentals clearly in favour of bulls, the greenback could be primed to hit fresh two-decade highs in the week ahead. Given how the next few days are jam packed with economic US data and speeches from Federal Reserve officials, it may be wise to fasten your seatbelts due to increased dollar volatility.
Before we take a deep dive into what to expect from the dollar this week, it is worth keeping in mind that the DXY is heavily bullish on the daily timeframe. There have been consistently higher highs and higher lows with 105.0 acting as a key point of interest.
The same can be said for the equally-weighted USD index which is trading at levels not seen since mid-2020.
The week ahead…
On Tuesday, all eyes will be on the US April retail sales and industrial production data which could provide insight into the health of the largest economy in the world. This will be complemented by numerous speeches from Fed speakers including Federal Reserve chair Jerome Powell. If Powell and other policymakers strike a hawkish tone, this may fuel expectations around a 75-basis point rate hike in June – ultimately boosting the dollar.
Mid-week, Philadelphia Fed President Patrick Harker will be under the spotlight while on Thursday it’s all about the weekly initial jobless claims. Given how these speeches and economic reports could influence rate hike expectations, the next few days could be wild for the greenback.
Last week, U.S Treasury yields climbed to new cycle highs, powered by aggressive rate hike bets. Although yields have pulled back from multi-year highs, prices are still hovering around the 3% level and could push higher in the week ahead. Should yields resume their climb higher, this is likely to elevate the dollar.
Bulls remain in control for now…
Watch this space as the equally-weighted USD Index could be gearing up for another rally.
Prices are heavily bullish on the weekly and daily timeframe as there have been consistently higher highs and higher lows. Beyond 1.1850, the next key level of interest can be found at 1.2070. A solid breakout above 1.2070 could open the doors towards 1.2300.
Should 1.1850 prove to be reliable resistance, a decline back towards 1.1550 could become reality.
On the daily charts, we see a similar story with prices respecting a bullish channel. A breakout above 1.1950 could trigger a move towards 1.2070 and 1.2300. below 1.1850, bears may test the 1.1170 higher low before challenging 1.1550.
RoboForex, a company that provides trading services in global financial markets, is the proud winner of the “Most Trusted Broker (Global)” award, as announced by the “International Business Magazine Awards 2022”. RoboForex has won the title for the third consecutive year, and it shows the professional community’s high level of credibility in the company’s products and services.
RoboForex has been operating in the market since 2009 and has proved its worth as a reliable company over the years, having millions of clients worldwide and being committed to providing them with the best trading conditions and cutting-edge technologies. RoboForex is an international broker offering access to 8 asset classes and over 12,000 instruments for trading and investing.
Robert Stephenson, CBO at RoboForex comments: “We express our gratitude to everyone who voted for our company. It’s been the third straight year we received the Most Trusted Broker (Global) award but this fact doesn’t make it less valuable. Maintaining a high level of services amid the business expansion is not an easy task. We’re very delighted to justify our clients’ credit of trust – it proves that we’re doing a good job”.
International Business Magazine Awards was established in 2018 and has since then become a landmark event in determining the most outstanding and prospective business enterprises all over the world. The organisers make shortlists of the companies from different regions and jurisdictions to choose from: the Middle East, Africa, America, Asia, and Europe. The process of determining the winners is controlled by the committee that consists of the leading experts in their fields and the award panel.
About RoboForex
RoboForex is a company, which delivers brokerage services. The company provides traders, who work on financial markets, with access to its proprietary trading platforms. RoboForex Ltd has the brokerage license FSC 000138/333. More detailed information about the Company’s products and activities can be found on the official website at roboforex.com.
The International Business Magazine Awards 2022 recognised RoboMarkets, a company that offers brokerage services for trading and investing in financial markets, as the “Best Indices Broker Global 2022”.
Low spreads: from 5 pips for ECN and Prime accounts
High order executions speed: from 1 second
Low commissions: from $4 (for the trading volume of one million USD)
Minimum lot: from 0.1
Denis Golomedov, Chief Marketing Officer at RoboMarkets, comments: “Receiving this award once again is yet another proof that the conditions for investing in indices RoboMarkets is offering stand out from those of the competitors in the industry. We provide low spreads and some of the most attractive commissions for indices-based transactions”.
Since 2018, the International Business Magazine Awards has been choosing the best companies from all over the world, including the Middle East, Africa, America, Asia, and Europe. The awards have been established with the purpose of determining the most impressive achievements in a variety of international business/finance-related spheres. The yearly nominations are intended to highlight the major corporate enterprises that demonstrated outstanding management and high quality of offered services while placing a high value on business ethics and efficiency.
About RoboMarkets
RoboMarkets is an investment company operating under CySEC license No. 191/13. RoboMarkets offers investment services in many European countries by providing traders who work in the financial market with access to its proprietary trading platforms. Find out more detailed information about the Company’s products and activities on www.robomarkets.com.
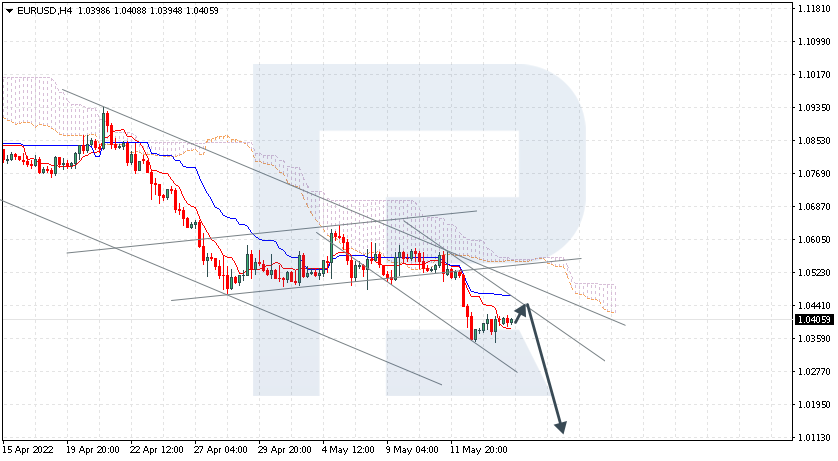
EURUSD is testing Tenkan-Sen and Kijun-Sen. The instrument is currently moving below Ichimoku Cloud, thus indicating a descending tendency. The markets could indicate that the price may test Kijun-Sen at 1.0445 and then resume moving downwards to reach 1.0115. Another signal in favour of a further downtrend will be a rebound from the descending channel’s upside border. However, the bearish scenario may no longer be valid if the price breaks the cloud’s upside border and fixes above 1.0615. In this case, the pair may continue growing towards 1.0705.
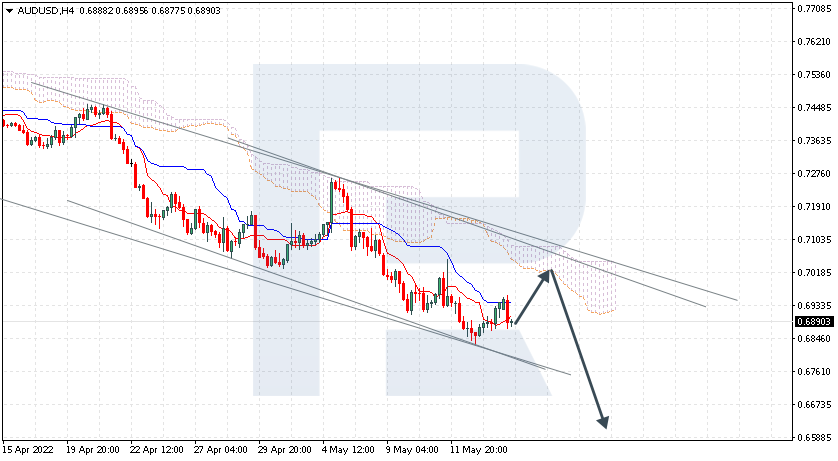
AUDUSD, “Australian Dollar vs US Dollar”
AUDUSD is correcting within the bearish channel. The instrument is currently moving below Ichimoku Cloud, thus indicating a descending tendency. The markets could indicate that the price may test the cloud’s downside border at 0.7120 and then resume moving downwards to reach 0.6595. Another signal in favour of a further downtrend will be a rebound from the descending channel’s upside border. However, the bearish scenario may no longer be valid if the price breaks the cloud’s upside border and fixes above 0.7225. In this case, the pair may continue growing towards 0.7315.
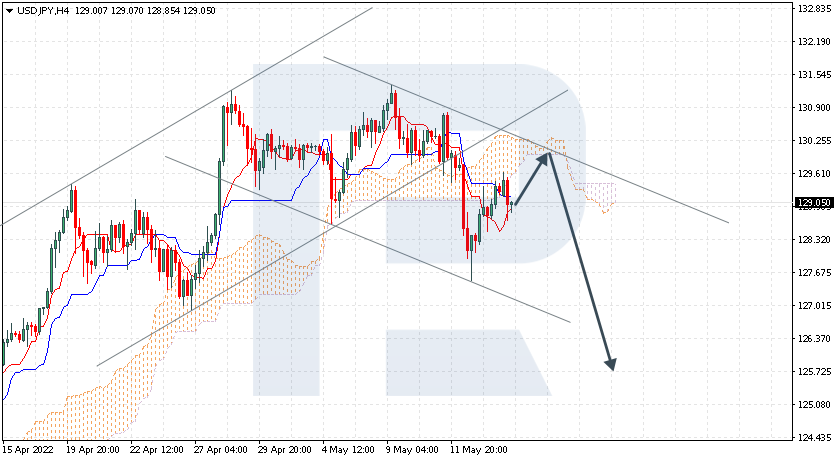
USDJPY, “US Dollar vs Japanese Yen”
USDJPY is rebounding from the cloud’s downside border. The instrument is currently moving below Ichimoku Cloud, thus indicating a descending tendency. The markets could indicate that the price may test the cloud’s downside border at 129.85 and then resume moving downwards to reach 125.75. Another signal in favour of a further downtrend will be a rebound from the descending channel’s upside border. However, the bearish scenario may no longer be valid if the price breaks the cloud’s upside border and fixes above 130.45. In this case, the pair may continue growing towards 131.35.
Attention! Forecasts presented in this section only reflect the author’s private opinion and should not be considered as guidance for trading. RoboForex LP bears no responsibility for trading results based on trading recommendations described in these analytical reviews.