By Ino.com
– Since my last update, the dollar advanced further to the upside establishing the new multi-year top of $105 in the middle of May. Later, the market started the correction as the dollar index (DX) drifted into the area of $101.
Last time, you bet the most on the further rise of the dollar to $121 (Neckline of Giant Double Bottom pattern). The second choice was the Bearish scenario for the main currency. It is early to judge the results as the price dynamics are somewhat mixed.
Let me show you one comparison graph that shows the underlying fundamentals of the dollar index. But, before that, to refresh the memory, firstly, I put below the chart showing the composition of the dollar index.
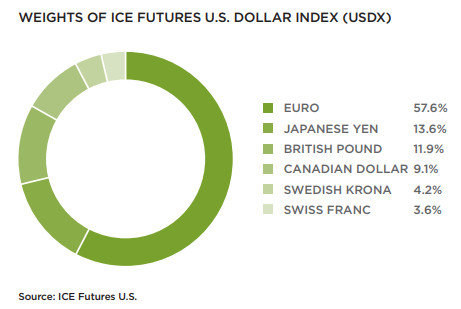
The euro takes the largest piece of cake with 57.6%; the Japanese yen with 13.6% is the second largest component, although the gap with the euro is huge. The third is the British pound, as its part weighs 11.9%.
I put the top three components mentioned above against the U.S. in terms of real interest yield in the chart below.
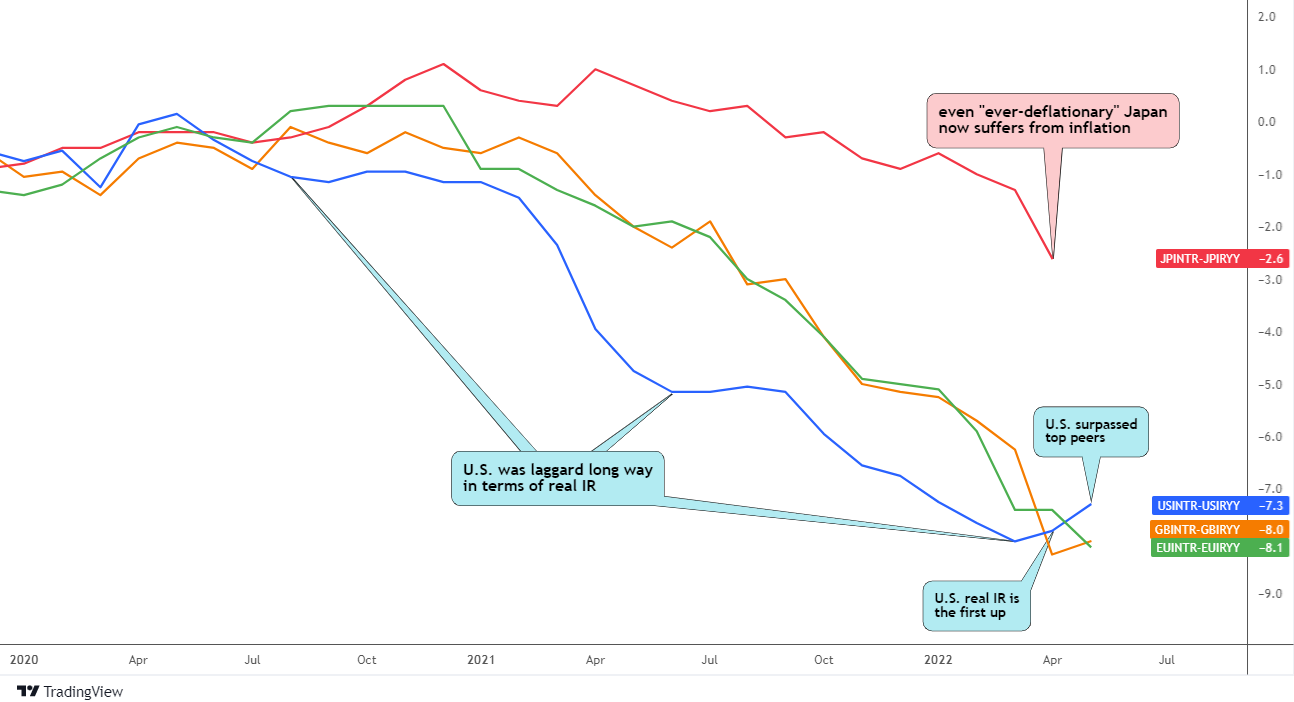
As we can see from the chart above, the U.S. (blue line) was the laggard for almost two years in terms of real interest rate compared to peers. The consequence was the sinking dollar index during the whole of 2020 and the first half of 2021.
The global inflation has no mercy for any country as we can see how peers also followed the U.S. real interest rate downtrend to even catch up with it around -8% this year as I am talking about the Euro area (green line) and the United Kingdom (orange line).
The U.S. underdog has recently escaped from the death spiral streaming into the abyss. It was the first up to break the long-running downtrend in April. On top of that, the U.S. real interest rate could surpass the Euro area and the U.K. as the Fed took it seriously.
The U.K. real interest rate was the second up, while the main rival Euro and Yen are still falling down. Moreover, the latter “ever deflationary” country now suffers from inflation either.
In that very update, you also voted the most for the Fed to lift the interest rate to the 4-6% area amid my projection of double-digit interest rate.
This situation favors the stronger dollar index and supports your bet on a target of $121.
I prepared for you another chart that spots a correlation that could help us to see the prospects of the dollar index.
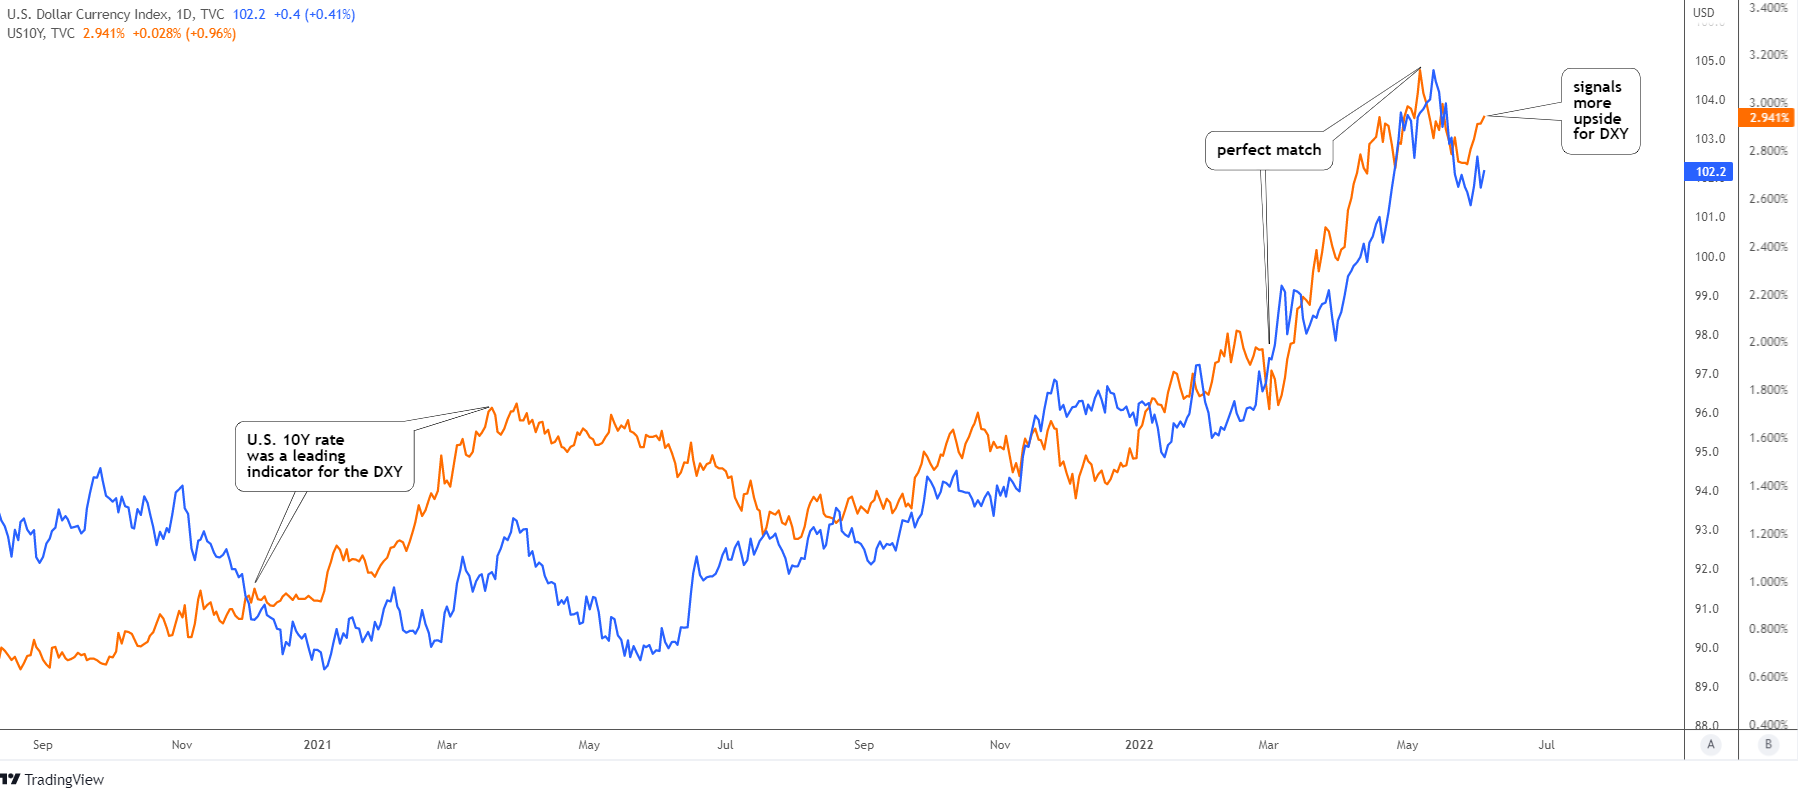
The U.S. government bond 10-year yield (10Y, orange) had bottomed in 2020. However, it was months ahead until DX (blue) could do it either. The 10Y had shown the outlook of the market participants who just demanded the Fed to act on accelerating inflation. It was the turning point when the 10Y line crossed over the DX line as the latter continued to the downside on inertia for only a few months onwards to establish a multi-year bottom.
The dollar index started to pick up from the valley following the rising yield. The Fed had muted that signal from the market that day, and the yield started its correction down, and so did the DX. A strong correlation was back on track in summer 2021, and the sync continues these days.
We can observe the perfect match of these two instruments this year as the market finally got the clarity from the Fed. Moreover, the ideal synced top is another evidence of the strong correlation.
The recent correction was deeper for the DX than for the 10Y. The latter restarted its trend to the upside into the 3% area. This leading indicator could signal more upcoming strength for the dollar index.
Intelligent trades!
Aibek Burabayev
INO.com Contributor, Metals
Disclosure: This contributor has no positions in any stocks mentioned in this article. This article is the opinion of the contributor themselves. The above is a matter of opinion provided for general information purposes only and is not intended as investment advice. This contributor is not receiving compensation (other than from INO.com) for their opinion.
By Ino.com – See our Trader Blog, INO TV Free & Market Analysis Alerts
Source: Dollar Index: The Last Shall Be First