By InvestMacro | COT | Data Tables | COT Leaders | Downloads | COT Newsletter

Here are the latest charts and statistics for the Commitment of Traders (COT) data published by the Commodities Futures Trading Commission (CFTC).
The latest COT data is updated through Tuesday July 5th and shows a quick view of how large traders (for-profit speculators and commercial entities) were positioned in the futures markets. All currency positions are in direct relation to the US dollar where, for example, a bet for the euro is a bet that the euro will rise versus the dollar while a bet against the euro will be a bet that the euro will decline versus the dollar.
Currency market speculator bets were lower this week as all of the eleven currency markets we cover had lower positioning on the week.
Leading the declines in speculator bets this week were the Brazil real (-20,695 contracts) and the Euro (-6,256 contracts) while the Canadian dollar (-4,804 contracts), Australian dollar (-4,641 contracts), US Dollar Index (-3,978 contracts), British pound sterling (-3,090 contracts), Japanese yen (-1,875 contracts), New Zealand dollar (-1,745 contracts), Swiss franc (-1,544 contracts), Bitcoin (-665 contracts) and the Mexican peso (-438 contracts) all saw lower speculator bets for the week.
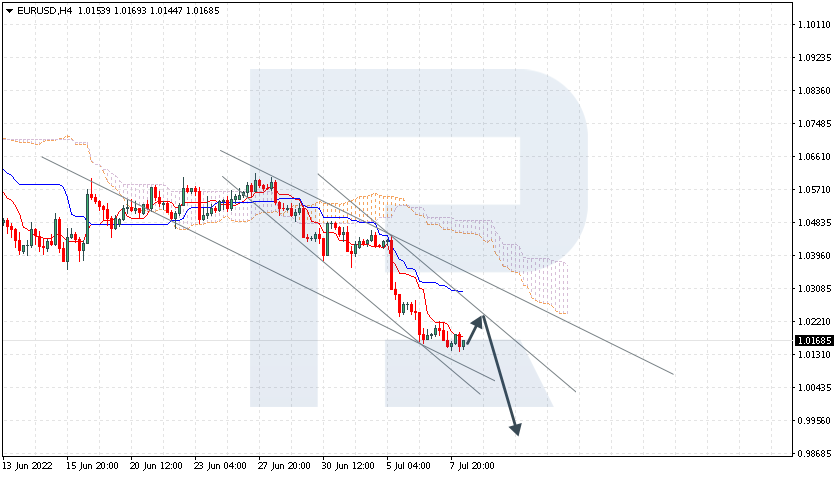
Highlighting the currency futures data this week was the Euro speculator position that fell deeper into bearish territory and dropped for the fourth time in the past five weeks. The speculator position has now decreased by a whopping -69,124 contracts in just the past five weeks and has brought the overall standing to the lowest level since November 30th of 2021, a span of 31 weeks. The Euro price has been strongly on the defensive against the dollar as the EURUSD currency pair this week hit the lowest level since December 0f 2002. The EURUSD fell to a low under the 1.0200 exchange rate on Friday and sets up what seems to be an inevitable test of parity which would also be the first time that has happened since December of 2002.
More COT currency notes:
US Dollar Index bets fell for a second straight week and dipped below +40,000 contracts for the first time in four weeks. Despite the 2-week decline, the Dollar Index speculator position remains extremely bullish which has seen increases in speculator bets in ten out of the past fifteen weeks. Overall, the Dollar Index positioning has been in bullish territory for fifty-three straight weeks after turning from bearish to bullish on July 6th of 2021. The Dollar Index price this week continued to climb (up 5 out of 6 weeks) and hit the highest level since October of 2002 at above the 107.75 level.
Japanese yen speculator bets fell for the first time in the past eight weeks this week. Yen bets remain bearish but have improved strongly over the past few months going from a total of -110,454 contracts on May 10th to a total of -54,445 contracts this week. Despite, the speculator sentiment improvement, the USDJPY currency pair has remained near the top of its range (and close to 20-year highs) at around the 136.00 exchange rate.
Brazilian real speculator bets dropped sharply this week by over -20,000 contracts and fell for the third straight week. These declines have brought the BRL position down to the lowest level in the past twenty-two weeks at just +16,333 contracts. The Brazil real price has been on the defensive in the past month as the BRLUSD currency pair fell to a five month low this week near the 0.1850 exchange rate and dropped under its 200-day moving average for the first time since January.

Strength scores (a measure of the 3-Year range of Speculator positions, from 0 to 100 where above 80 is extreme bullish and below 20 is extreme bearish) show that the US Dollar Index (90.4 percent) and Bitcoin (87.9 percent) lead the currencies at the top of their respective ranges and are both in bullish extreme positions. The Brazilian real (66.4 percent) comes in as the next highest currency in strength scores but took a large tumble this week to fall out of a bullish extreme level. On the downside, the Mexican peso at 21.2 percent continues to be at the lowest strength level currently and is followed by the Euro at 29.8 percent and the Swiss franc at 30.8 percent.

Strength score trends (or move index, that calculate 6-week changes in strength scores) shows that the Japanese yen (27.7 percent) leads the past six weeks trends once again this week. The Swiss franc (24.2 percent), New Zealand dollar (20.6 percent) and the Canadian dollar (19.1 percent) round out the top movers in the latest data. The Brazilian real (-22.0 percent) saw a huge decrease in speculator positions this week and leads the downside trend scores currently. The next currencies will lower trend scores were the Mexican peso at -18.9 percent followed by the Euro at -17.1 percent.
| Jul-05-2022 | OI | OI-Index | Spec-Net | Spec-Index | Com-Net | COM-Index | Smalls-Net | Smalls-Index |
|---|
| USD Index | 60,857 | 91 | 39,251 | 90 | -41,510 | 10 | 2,259 | 41 |
| EUR | 673,772 | 71 | -16,852 | 30 | -8,636 | 74 | 25,488 | 17 |
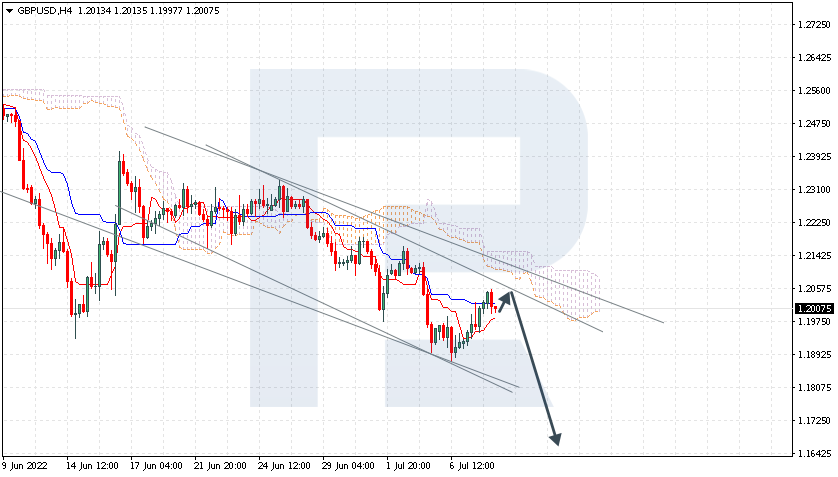
| GBP | 240,926 | 65 | -56,208 | 34 | 77,009 | 75 | -20,801 | 13 |
| JPY | 217,672 | 67 | -54,445 | 35 | 64,063 | 67 | -9,618 | 34 |
| CHF | 38,504 | 18 | -10,135 | 31 | 20,075 | 75 | -9,940 | 24 |
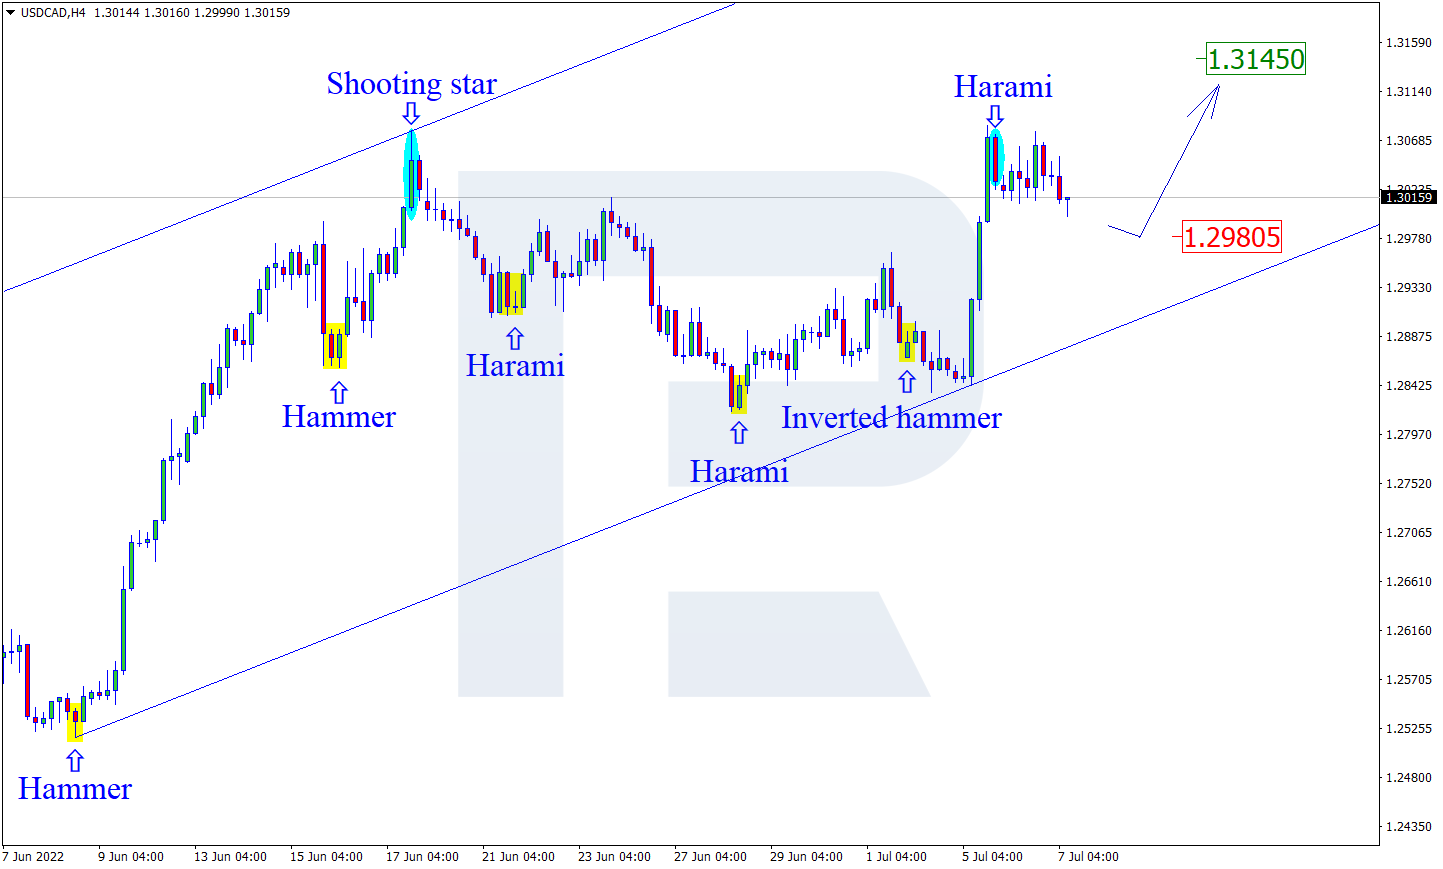
| CAD | 145,372 | 27 | 4,293 | 44 | -4,533 | 65 | 240 | 31 |
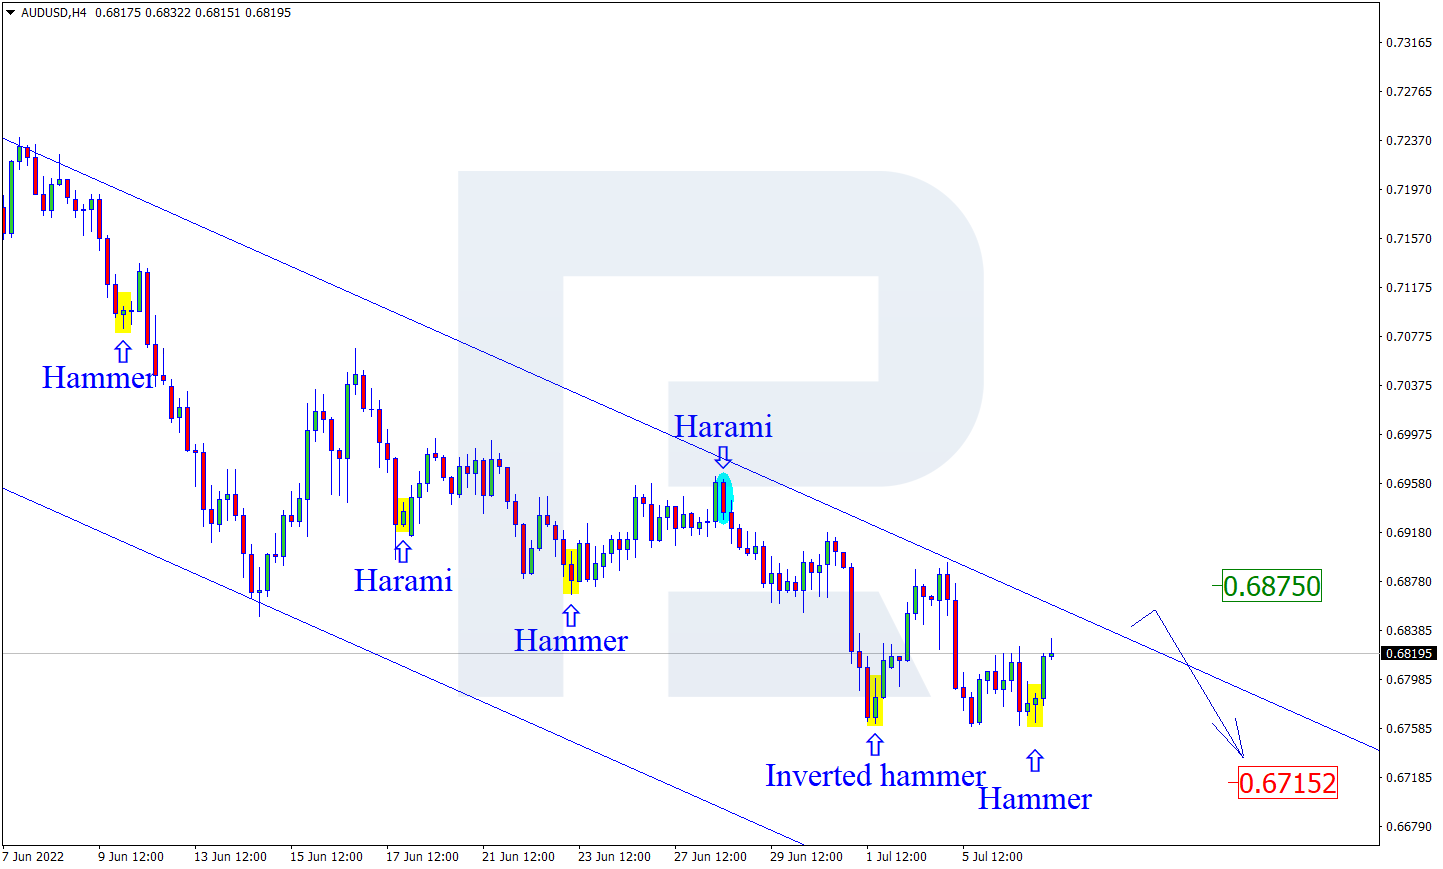
| AUD | 146,950 | 42 | -47,621 | 41 | 55,708 | 60 | -8,087 | 33 |
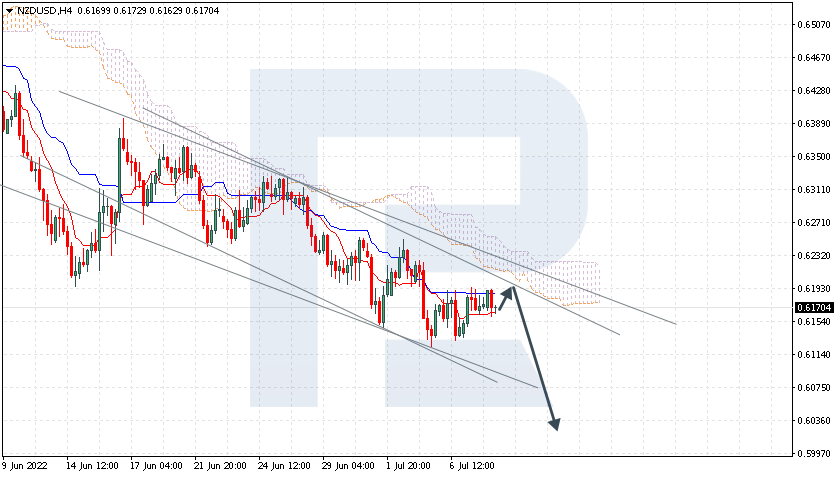
| NZD | 45,403 | 35 | -7,056 | 59 | 10,521 | 47 | -3,465 | 12 |
| MXN | 197,463 | 48 | -14,418 | 21 | 10,096 | 77 | 4,322 | 61 |
| RUB | 20,930 | 4 | 7,543 | 31 | -7,150 | 69 | -393 | 24 |
| BRL | 39,470 | 26 | 16,333 | 66 | -17,398 | 34 | 1,065 | 77 |
| Bitcoin | 13,258 | 75 | 420 | 88 | -462 | 0 | 42 | 14 |
US Dollar Index Futures:
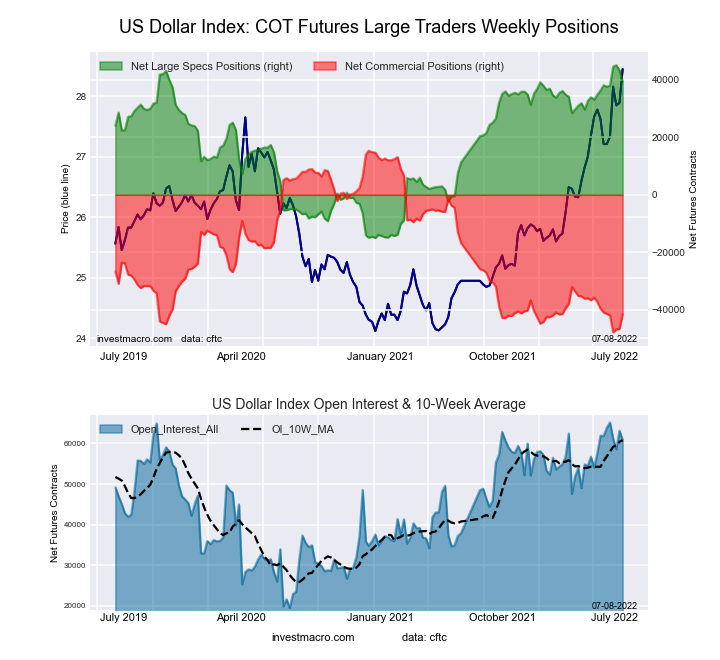 The US Dollar Index large speculator standing this week resulted in a net position of 39,251 contracts in the data reported through Tuesday. This was a weekly decline of -3,978 contracts from the previous week which had a total of 43,229 net contracts.
This week’s current strength score (the trader positioning range over the past three years, measured from 0 to 100) shows the speculators are currently Bullish-Extreme with a score of 90.4 percent. The commercials are Bearish-Extreme with a score of 9.9 percent and the small traders (not shown in chart) are Bearish with a score of 41.2 percent.
| US DOLLAR INDEX Statistics | SPECULATORS | COMMERCIALS | SMALL TRADERS |
| – Percent of Open Interest Longs: | 87.0 | 3.3 | 8.2 |
| – Percent of Open Interest Shorts: | 22.5 | 71.5 | 4.5 |
| – Net Position: | 39,251 | -41,510 | 2,259 |
| – Gross Longs: | 52,927 | 2,023 | 4,993 |
| – Gross Shorts: | 13,676 | 43,533 | 2,734 |
| – Long to Short Ratio: | 3.9 to 1 | 0.0 to 1 | 1.8 to 1 |
| NET POSITION TREND: | | | |
| – Strength Index Score (3 Year Range Pct): | 90.4 | 9.9 | 41.2 |
| – Strength Index Reading (3 Year Range): | Bullish-Extreme | Bearish-Extreme | Bearish |
| NET POSITION MOVEMENT INDEX: | | | |
| – 6-Week Change in Strength Index: | 2.0 | -1.0 | -6.3 |
Euro Currency Futures:
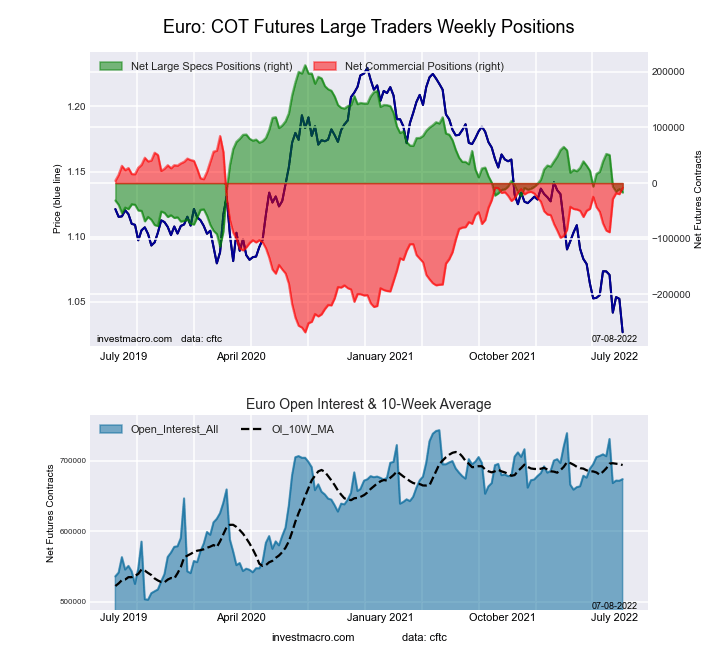 The Euro Currency large speculator standing this week resulted in a net position of -16,852 contracts in the data reported through Tuesday. This was a weekly decline of -6,256 contracts from the previous week which had a total of -10,596 net contracts.
This week’s current strength score (the trader positioning range over the past three years, measured from 0 to 100) shows the speculators are currently Bearish with a score of 29.8 percent. The commercials are Bullish with a score of 73.6 percent and the small traders (not shown in chart) are Bearish-Extreme with a score of 16.6 percent.
| EURO Currency Statistics | SPECULATORS | COMMERCIALS | SMALL TRADERS |
| – Percent of Open Interest Longs: | 29.3 | 56.1 | 12.2 |
| – Percent of Open Interest Shorts: | 31.8 | 57.3 | 8.5 |
| – Net Position: | -16,852 | -8,636 | 25,488 |
| – Gross Longs: | 197,138 | 377,654 | 82,525 |
| – Gross Shorts: | 213,990 | 386,290 | 57,037 |
| – Long to Short Ratio: | 0.9 to 1 | 1.0 to 1 | 1.4 to 1 |
| NET POSITION TREND: | | | |
| – Strength Index Score (3 Year Range Pct): | 29.8 | 73.6 | 16.6 |
| – Strength Index Reading (3 Year Range): | Bearish | Bullish | Bearish-Extreme |
| NET POSITION MOVEMENT INDEX: | | | |
| – 6-Week Change in Strength Index: | -17.1 | 18.1 | -13.5 |
British Pound Sterling Futures:
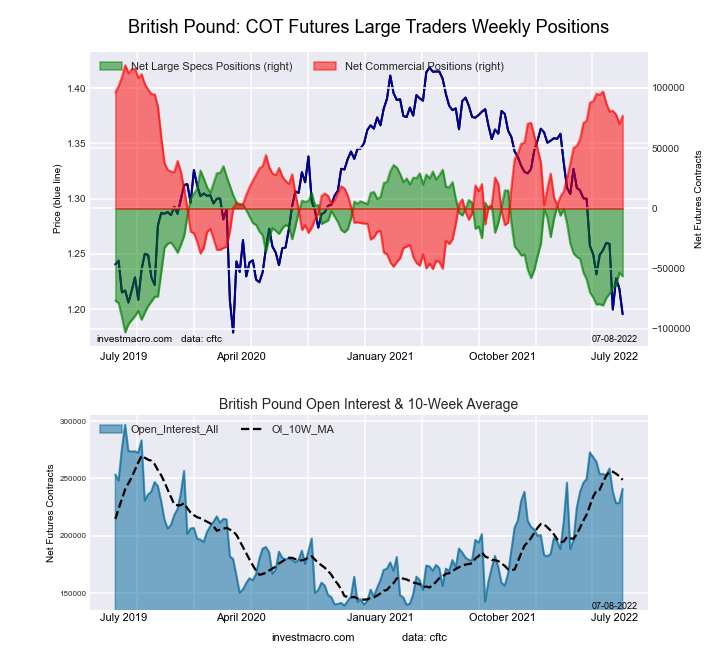 The British Pound Sterling large speculator standing this week resulted in a net position of -56,208 contracts in the data reported through Tuesday. This was a weekly fall of -3,090 contracts from the previous week which had a total of -53,118 net contracts.
This week’s current strength score (the trader positioning range over the past three years, measured from 0 to 100) shows the speculators are currently Bearish with a score of 33.5 percent. The commercials are Bullish with a score of 75.2 percent and the small traders (not shown in chart) are Bearish-Extreme with a score of 12.5 percent.
| BRITISH POUND Statistics | SPECULATORS | COMMERCIALS | SMALL TRADERS |
| – Percent of Open Interest Longs: | 16.4 | 74.2 | 7.3 |
| – Percent of Open Interest Shorts: | 39.8 | 42.2 | 16.0 |
| – Net Position: | -56,208 | 77,009 | -20,801 |
| – Gross Longs: | 39,618 | 178,745 | 17,693 |
| – Gross Shorts: | 95,826 | 101,736 | 38,494 |
| – Long to Short Ratio: | 0.4 to 1 | 1.8 to 1 | 0.5 to 1 |
| NET POSITION TREND: | | | |
| – Strength Index Score (3 Year Range Pct): | 33.5 | 75.2 | 12.5 |
| – Strength Index Reading (3 Year Range): | Bearish | Bullish | Bearish-Extreme |
| NET POSITION MOVEMENT INDEX: | | | |
| – 6-Week Change in Strength Index: | 17.4 | -11.8 | -8.6 |
Japanese Yen Futures:
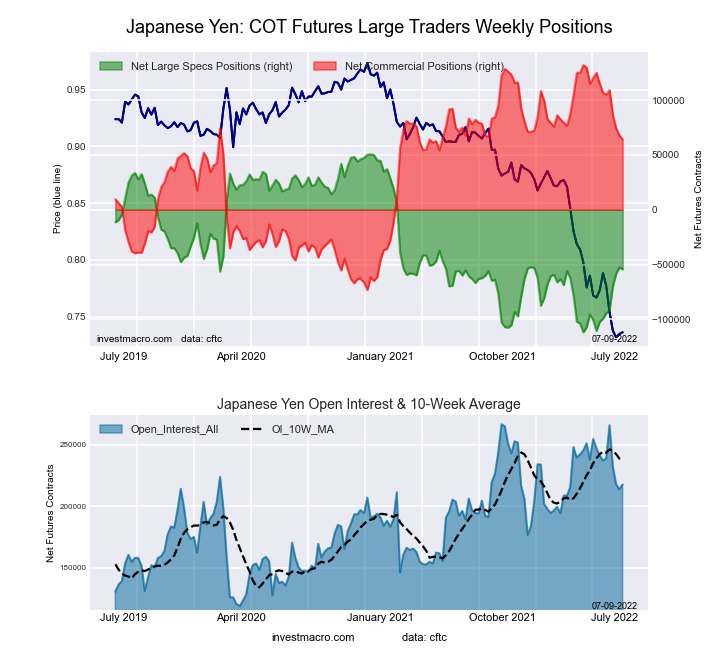
The Japanese Yen large speculator standing this week resulted in a net position of -54,445 contracts in the data reported through Tuesday. This was a weekly reduction of -1,875 contracts from the previous week which had a total of -52,570 net contracts.
This week’s current strength score (the trader positioning range over the past three years, measured from 0 to 100) shows the speculators are currently Bearish with a score of 35.3 percent. The commercials are Bullish with a score of 66.9 percent and the small traders (not shown in chart) are Bearish with a score of 33.9 percent.
| JAPANESE YEN Statistics | SPECULATORS | COMMERCIALS | SMALL TRADERS |
| – Percent of Open Interest Longs: | 17.8 | 68.8 | 11.7 |
| – Percent of Open Interest Shorts: | 42.8 | 39.3 | 16.1 |
| – Net Position: | -54,445 | 64,063 | -9,618 |
| – Gross Longs: | 38,660 | 149,702 | 25,452 |
| – Gross Shorts: | 93,105 | 85,639 | 35,070 |
| – Long to Short Ratio: | 0.4 to 1 | 1.7 to 1 | 0.7 to 1 |
| NET POSITION TREND: | | | |
| – Strength Index Score (3 Year Range Pct): | 35.3 | 66.9 | 33.9 |
| – Strength Index Reading (3 Year Range): | Bearish | Bullish | Bearish |
| NET POSITION MOVEMENT INDEX: | | | |
| – 6-Week Change in Strength Index: | 27.7 | -20.8 | -4.8 |
Swiss Franc Futures:
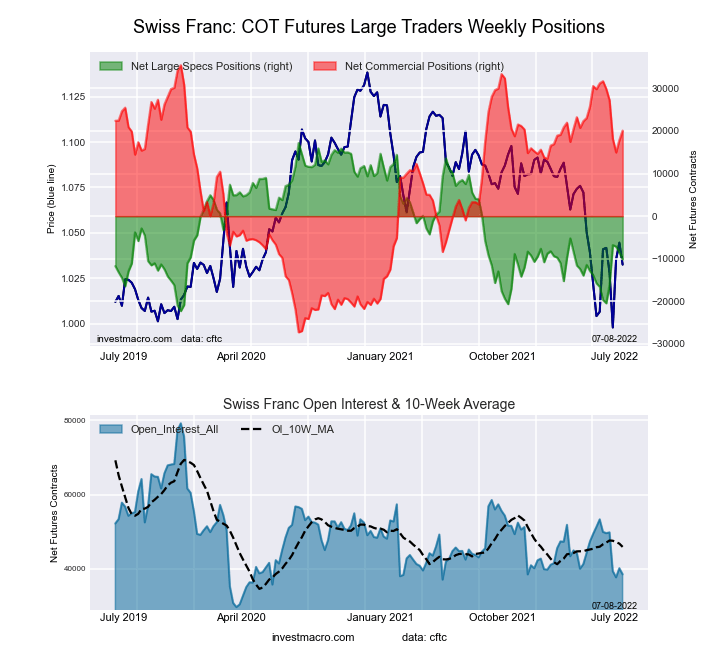 The Swiss Franc large speculator standing this week resulted in a net position of -10,135 contracts in the data reported through Tuesday. This was a weekly reduction of -1,544 contracts from the previous week which had a total of -8,591 net contracts.
This week’s current strength score (the trader positioning range over the past three years, measured from 0 to 100) shows the speculators are currently Bearish with a score of 30.8 percent. The commercials are Bullish with a score of 75.5 percent and the small traders (not shown in chart) are Bearish with a score of 23.9 percent.
| SWISS FRANC Statistics | SPECULATORS | COMMERCIALS | SMALL TRADERS |
| – Percent of Open Interest Longs: | 8.4 | 69.2 | 22.3 |
| – Percent of Open Interest Shorts: | 34.7 | 17.1 | 48.2 |
| – Net Position: | -10,135 | 20,075 | -9,940 |
| – Gross Longs: | 3,218 | 26,664 | 8,602 |
| – Gross Shorts: | 13,353 | 6,589 | 18,542 |
| – Long to Short Ratio: | 0.2 to 1 | 4.0 to 1 | 0.5 to 1 |
| NET POSITION TREND: | | | |
| – Strength Index Score (3 Year Range Pct): | 30.8 | 75.5 | 23.9 |
| – Strength Index Reading (3 Year Range): | Bearish | Bullish | Bearish |
| NET POSITION MOVEMENT INDEX: | | | |
| – 6-Week Change in Strength Index: | 24.2 | -18.5 | 7.0 |
Canadian Dollar Futures:
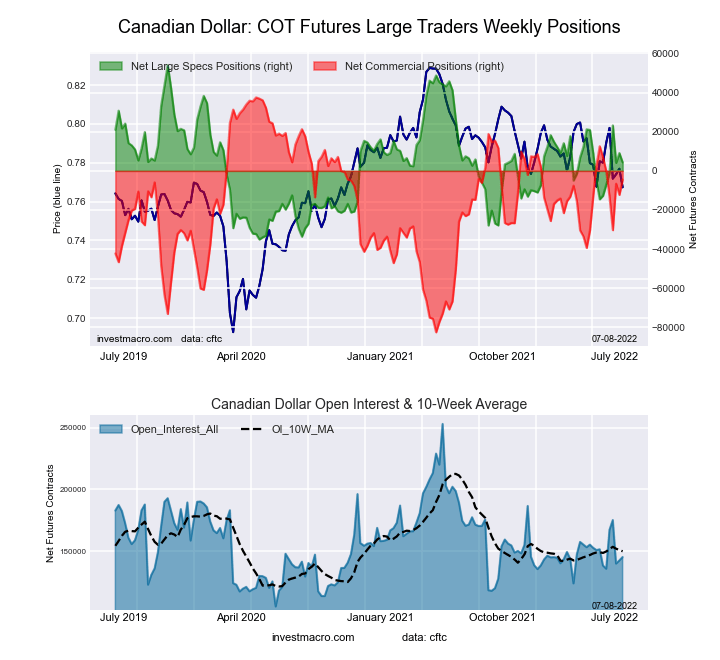 The Canadian Dollar large speculator standing this week resulted in a net position of 4,293 contracts in the data reported through Tuesday. This was a weekly lowering of -4,804 contracts from the previous week which had a total of 9,097 net contracts.
This week’s current strength score (the trader positioning range over the past three years, measured from 0 to 100) shows the speculators are currently Bearish with a score of 44.2 percent. The commercials are Bullish with a score of 65.0 percent and the small traders (not shown in chart) are Bearish with a score of 30.6 percent.
| CANADIAN DOLLAR Statistics | SPECULATORS | COMMERCIALS | SMALL TRADERS |
| – Percent of Open Interest Longs: | 31.2 | 46.7 | 21.0 |
| – Percent of Open Interest Shorts: | 28.3 | 49.8 | 20.8 |
| – Net Position: | 4,293 | -4,533 | 240 |
| – Gross Longs: | 45,365 | 67,829 | 30,460 |
| – Gross Shorts: | 41,072 | 72,362 | 30,220 |
| – Long to Short Ratio: | 1.1 to 1 | 0.9 to 1 | 1.0 to 1 |
| NET POSITION TREND: | | | |
| – Strength Index Score (3 Year Range Pct): | 44.2 | 65.0 | 30.6 |
| – Strength Index Reading (3 Year Range): | Bearish | Bullish | Bearish |
| NET POSITION MOVEMENT INDEX: | | | |
| – 6-Week Change in Strength Index: | 19.1 | -9.6 | -11.1 |
Australian Dollar Futures:
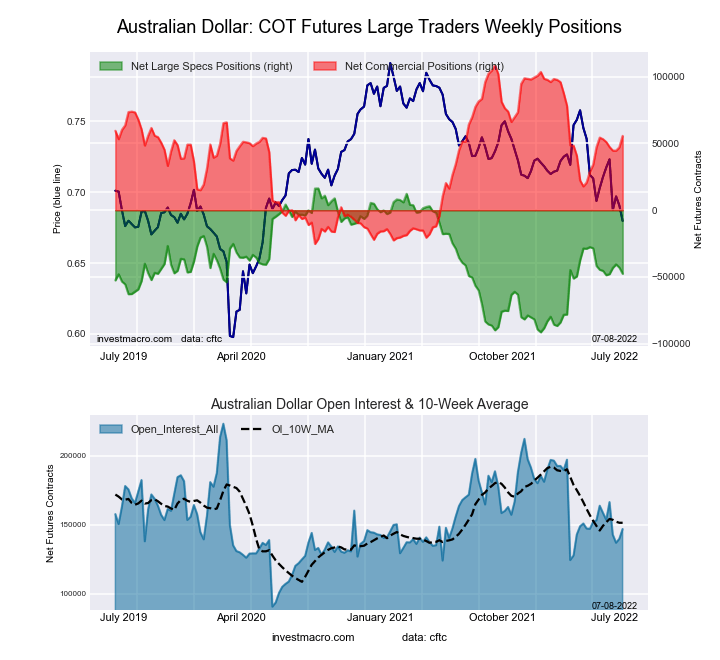 The Australian Dollar large speculator standing this week resulted in a net position of -47,621 contracts in the data reported through Tuesday. This was a weekly decrease of -4,641 contracts from the previous week which had a total of -42,980 net contracts.
This week’s current strength score (the trader positioning range over the past three years, measured from 0 to 100) shows the speculators are currently Bearish with a score of 40.7 percent. The commercials are Bullish with a score of 60.4 percent and the small traders (not shown in chart) are Bearish with a score of 32.7 percent.
| AUSTRALIAN DOLLAR Statistics | SPECULATORS | COMMERCIALS | SMALL TRADERS |
| – Percent of Open Interest Longs: | 18.8 | 64.8 | 12.6 |
| – Percent of Open Interest Shorts: | 51.2 | 26.9 | 18.1 |
| – Net Position: | -47,621 | 55,708 | -8,087 |
| – Gross Longs: | 27,622 | 95,252 | 18,508 |
| – Gross Shorts: | 75,243 | 39,544 | 26,595 |
| – Long to Short Ratio: | 0.4 to 1 | 2.4 to 1 | 0.7 to 1 |
| NET POSITION TREND: | | | |
| – Strength Index Score (3 Year Range Pct): | 40.7 | 60.4 | 32.7 |
| – Strength Index Reading (3 Year Range): | Bearish | Bullish | Bearish |
| NET POSITION MOVEMENT INDEX: | | | |
| – 6-Week Change in Strength Index: | -2.0 | 1.8 | -0.6 |
New Zealand Dollar Futures:
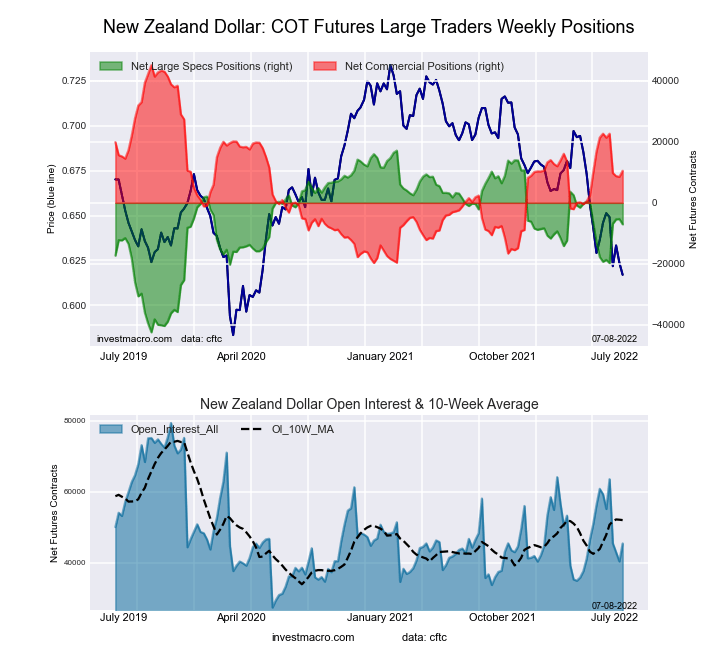 The New Zealand Dollar large speculator standing this week resulted in a net position of -7,056 contracts in the data reported through Tuesday. This was a weekly decline of -1,745 contracts from the previous week which had a total of -5,311 net contracts.
This week’s current strength score (the trader positioning range over the past three years, measured from 0 to 100) shows the speculators are currently Bullish with a score of 59.4 percent. The commercials are Bearish with a score of 46.6 percent and the small traders (not shown in chart) are Bearish-Extreme with a score of 11.8 percent.
| NEW ZEALAND DOLLAR Statistics | SPECULATORS | COMMERCIALS | SMALL TRADERS |
| – Percent of Open Interest Longs: | 30.0 | 63.9 | 5.9 |
| – Percent of Open Interest Shorts: | 45.6 | 40.8 | 13.6 |
| – Net Position: | -7,056 | 10,521 | -3,465 |
| – Gross Longs: | 13,634 | 29,029 | 2,689 |
| – Gross Shorts: | 20,690 | 18,508 | 6,154 |
| – Long to Short Ratio: | 0.7 to 1 | 1.6 to 1 | 0.4 to 1 |
| NET POSITION TREND: | | | |
| – Strength Index Score (3 Year Range Pct): | 59.4 | 46.6 | 11.8 |
| – Strength Index Reading (3 Year Range): | Bullish | Bearish | Bearish-Extreme |
| NET POSITION MOVEMENT INDEX: | | | |
| – 6-Week Change in Strength Index: | 20.6 | -18.8 | -1.0 |
Mexican Peso Futures:
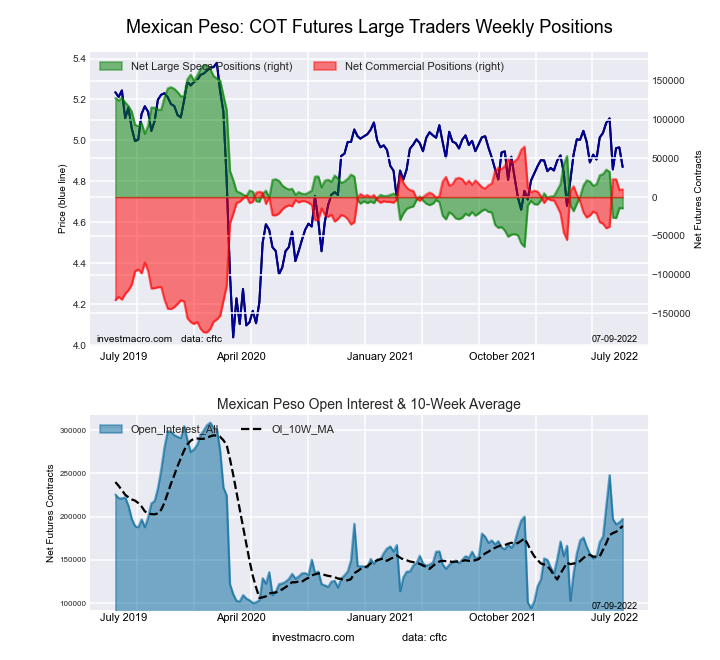
The Mexican Peso large speculator standing this week resulted in a net position of -14,418 contracts in the data reported through Tuesday. This was a weekly reduction of -438 contracts from the previous week which had a total of -13,980 net contracts.
This week’s current strength score (the trader positioning range over the past three years, measured from 0 to 100) shows the speculators are currently Bearish with a score of 21.2 percent. The commercials are Bullish with a score of 77.0 percent and the small traders (not shown in chart) are Bullish with a score of 61.3 percent.
| MEXICAN PESO Statistics | SPECULATORS | COMMERCIALS | SMALL TRADERS |
| – Percent of Open Interest Longs: | 54.3 | 41.6 | 3.5 |
| – Percent of Open Interest Shorts: | 61.6 | 36.5 | 1.3 |
| – Net Position: | -14,418 | 10,096 | 4,322 |
| – Gross Longs: | 107,141 | 82,106 | 6,947 |
| – Gross Shorts: | 121,559 | 72,010 | 2,625 |
| – Long to Short Ratio: | 0.9 to 1 | 1.1 to 1 | 2.6 to 1 |
| NET POSITION TREND: | | | |
| – Strength Index Score (3 Year Range Pct): | 21.2 | 77.0 | 61.3 |
| – Strength Index Reading (3 Year Range): | Bearish | Bullish | Bullish |
| NET POSITION MOVEMENT INDEX: | | | |
| – 6-Week Change in Strength Index: | -18.9 | 18.5 | -1.0 |
Brazilian Real Futures:
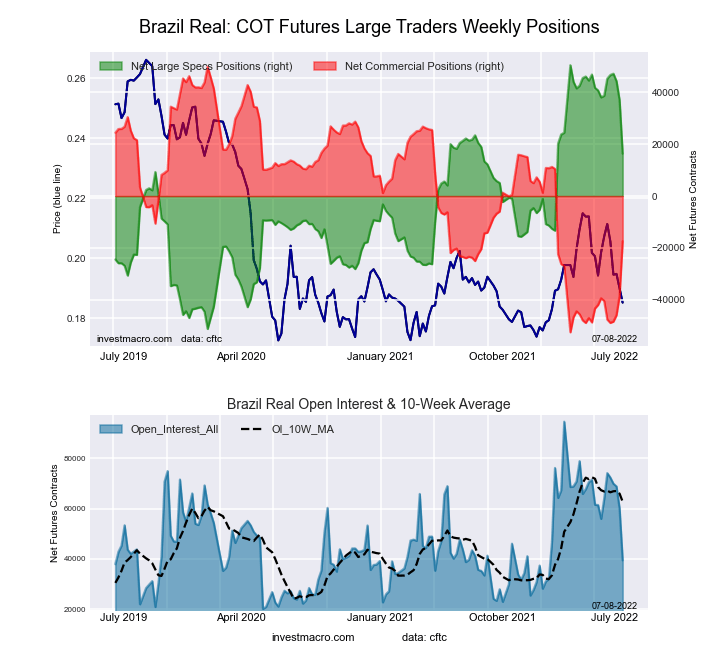 The Brazilian Real large speculator standing this week resulted in a net position of 16,333 contracts in the data reported through Tuesday. This was a weekly reduction of -20,695 contracts from the previous week which had a total of 37,028 net contracts.
This week’s current strength score (the trader positioning range over the past three years, measured from 0 to 100) shows the speculators are currently Bullish with a score of 66.4 percent. The commercials are Bearish with a score of 34.3 percent and the small traders (not shown in chart) are Bullish with a score of 77.2 percent.
| BRAZIL REAL Statistics | SPECULATORS | COMMERCIALS | SMALL TRADERS |
| – Percent of Open Interest Longs: | 61.5 | 29.8 | 7.8 |
| – Percent of Open Interest Shorts: | 20.1 | 73.9 | 5.1 |
| – Net Position: | 16,333 | -17,398 | 1,065 |
| – Gross Longs: | 24,261 | 11,776 | 3,089 |
| – Gross Shorts: | 7,928 | 29,174 | 2,024 |
| – Long to Short Ratio: | 3.1 to 1 | 0.4 to 1 | 1.5 to 1 |
| NET POSITION TREND: | | | |
| – Strength Index Score (3 Year Range Pct): | 66.4 | 34.3 | 77.2 |
| – Strength Index Reading (3 Year Range): | Bullish | Bearish | Bullish |
| NET POSITION MOVEMENT INDEX: | | | |
| – 6-Week Change in Strength Index: | -22.0 | 22.5 | -8.5 |
Bitcoin Futures:
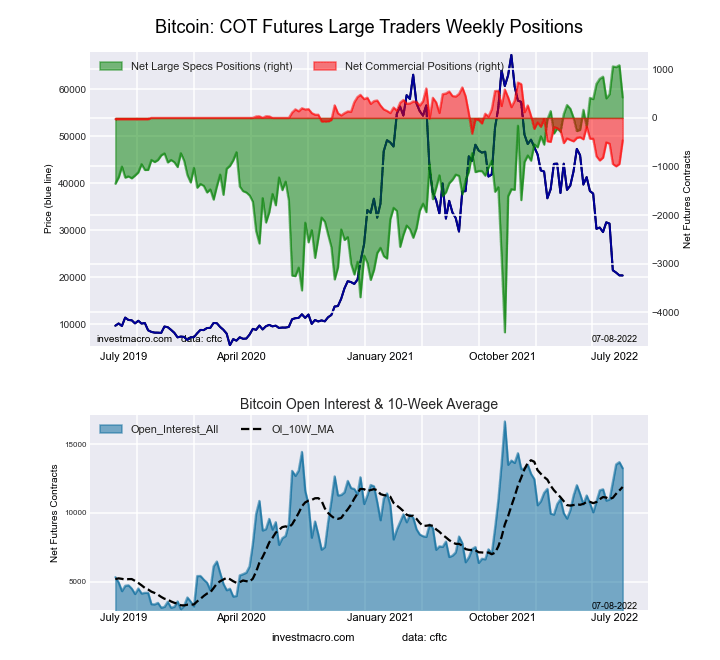 The Bitcoin large speculator standing this week resulted in a net position of 420 contracts in the data reported through Tuesday. This was a weekly lowering of -665 contracts from the previous week which had a total of 1,085 net contracts.
This week’s current strength score (the trader positioning range over the past three years, measured from 0 to 100) shows the speculators are currently Bullish-Extreme with a score of 87.9 percent. The commercials are Bearish with a score of 30.9 percent and the small traders (not shown in chart) are Bearish-Extreme with a score of 13.9 percent.
| BITCOIN Statistics | SPECULATORS | COMMERCIALS | SMALL TRADERS |
| – Percent of Open Interest Longs: | 80.3 | 1.2 | 8.0 |
| – Percent of Open Interest Shorts: | 77.1 | 4.7 | 7.7 |
| – Net Position: | 420 | -462 | 42 |
| – Gross Longs: | 10,642 | 158 | 1,058 |
| – Gross Shorts: | 10,222 | 620 | 1,016 |
| – Long to Short Ratio: | 1.0 to 1 | 0.3 to 1 | 1.0 to 1 |
| NET POSITION TREND: | | | |
| – Strength Index Score (3 Year Range Pct): | 87.9 | 30.9 | 13.9 |
| – Strength Index Reading (3 Year Range): | Bullish-Extreme | Bearish | Bearish-Extreme |
| NET POSITION MOVEMENT INDEX: | | | |
| – 6-Week Change in Strength Index: | -7.8 | 20.6 | 1.7 |
Article By InvestMacro – Receive our weekly COT Reports by Email
*COT Report: The COT data, released weekly to the public each Friday, is updated through the most recent Tuesday (data is 3 days old) and shows a quick view of how large speculators or non-commercials (for-profit traders) were positioned in the futures markets.
The CFTC categorizes trader positions according to commercial hedgers (traders who use futures contracts for hedging as part of the business), non-commercials (large traders who speculate to realize trading profits) and nonreportable traders (usually small traders/speculators) as well as their open interest (contracts open in the market at time of reporting).See CFTC criteria here.


