
By RoboForex Analytical Department
Brent crude oil prices decreased slightly on Wednesday, falling to 89.50 USD per barrel. The decline is primarily attributed to concerns over global oil demand, particularly given the economic indicators coming out of China, the world’s largest energy importer. Although China’s GDP grew faster than expected in Q1 2024, other critical economic parameters such as property investment, retail sales, and industrial production remain subdued, dampening overall demand prospects.
According to the American Petroleum Institute (API), US crude oil inventories have risen more than expected, adding to the complexities. While such an increase in inventories typically might bolster oil prices, the prevailing anxiety over global demand continues to exert downward pressure.
Political developments in the Middle East also remain a focal point for the oil markets. A high-level meeting involving Western nations and Israel was postponed to Wednesday, with efforts expected to focus on averting a significant escalation in regional conflicts. Given the region’s important global oil supply, such disputes are crucial for the oil sector.
Later today, the US Department of Energy is scheduled to release updated statistics on crude oil and petroleum product inventories for the week, which could influence market volatility.
Technical analysis of Brent
Free Reports:
 Download Our Metatrader 4 Indicators – Put Our Free MetaTrader 4 Custom Indicators on your charts when you join our Weekly Newsletter
 Get our Weekly Commitment of Traders Reports - See where the biggest traders (Hedge Funds and Commercial Hedgers) are positioned in the futures markets on a weekly basis.
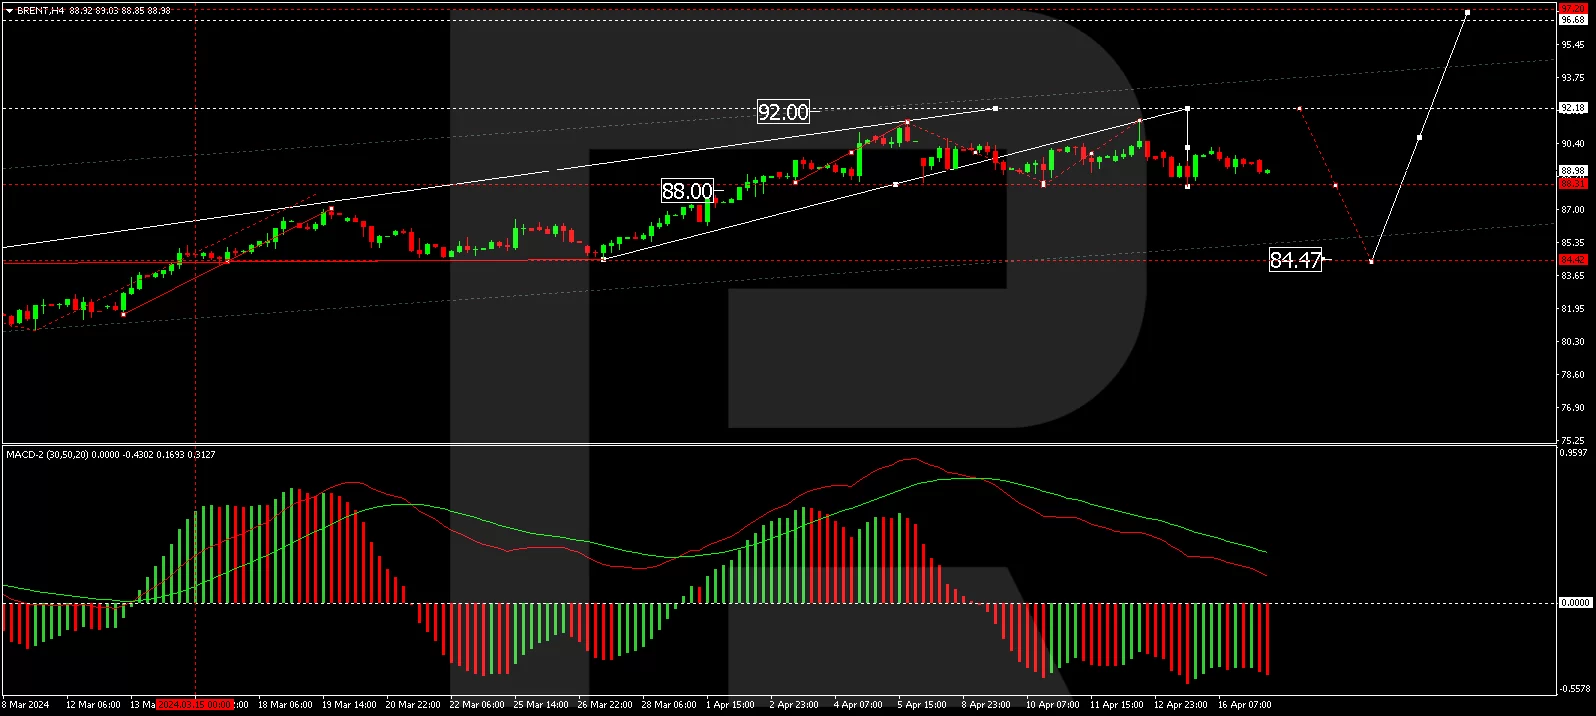
On the H4 chart, Brent crude has formed a consolidation range around the 88.30 USD level, indicating a lack of a clear trend. If there is an upward breakout from this range, a rise to 92.00 USD could be anticipated. This could be followed by a potential correction to 84.50 USD and further growth to 94.00 USD, potentially extending to 97.00 USD. The MACD indicator supports this scenario, with the signal line nearing zero and expected to rebound upwards, suggesting continued growth.
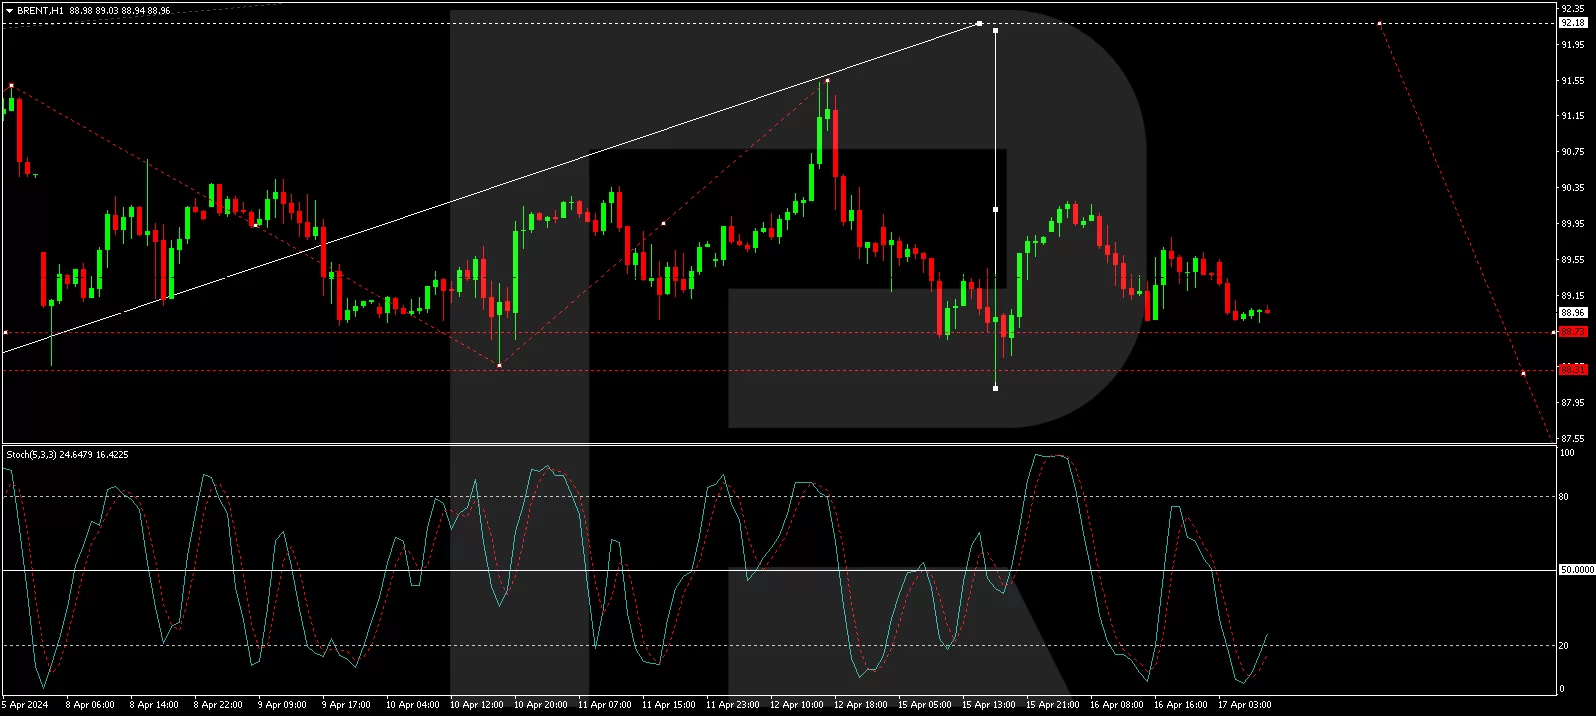
On the H1 chart, a growth impulse to 90.20 USD has been completed, and a corrective movement to 88.80 USD is underway. Once this correction is completed, a new growth wave towards 92.00 USD is anticipated, likely followed by a new corrective phase. The Stochastic oscillator, positioned below 20, prepares for a rebound, supporting the likelihood of further upward movement.
Disclaimer
Any forecasts contained herein are based on the author’s particular opinion. This analysis may not be treated as trading advice. RoboForex bears no responsibility for trading results based on trading recommendations and reviews contained herein.

- Geopolitical and macroeconomic conditions continue to pressure market sentiment Jul 20, 2026
- USD/JPY Poised to Continue Gains as Expensive Oil and Lack of Support Weigh on Yen Jul 20, 2026
- COT Metals Charts: Weekly Speculator Bets led by Copper & Steel Jul 18, 2026
- COT Bonds Charts: Weekly Speculator Bets led by 2-Year, SOFR 3M & 5-Year Bonds Jul 18, 2026
- COT Energy Charts: Weekly Speculator Bets led by Brent Oil & Heating Oil Jul 18, 2026
- COT Soft Commodities Charts: Weekly Speculator Bets led by Wheat, Corn & Soybean Meal Jul 18, 2026
- The Bank of Canada kept its interest rate unchanged. Platinum prices reached a three‑week high Jul 16, 2026
- Stock indices rose after the release of US inflation data. China’s GDP slowed sharply Jul 15, 2026
- GBP/USD Awaits Political News: What Will Happen Next Jul 15, 2026
- USD/JPY Holds at Highs: Pressure Lingers on Yen Jul 14, 2026
