By InvestMacro
Here are the latest charts and statistics for the Commitment of Traders (COT) reports data published by the Commodities Futures Trading Commission (CFTC).
The latest COT data is updated through Tuesday August 20th and shows a quick view of how large traders (for-profit speculators and commercial entities) were positioned in the futures markets.
Weekly Speculator Changes led by Wheat & Soybean Oil
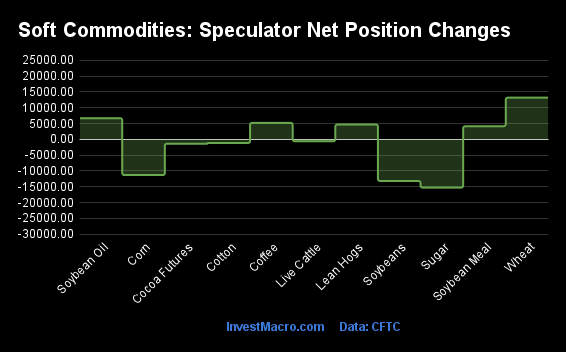
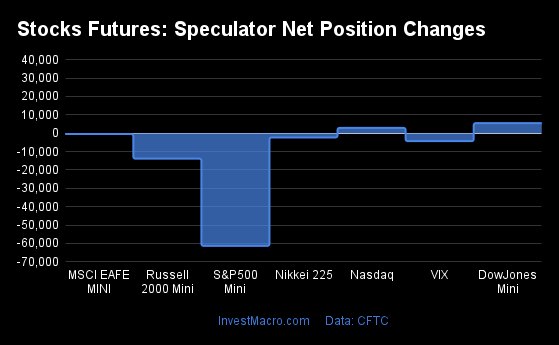
The COT soft commodities markets speculator bets were slightly lower this week as five out of the eleven softs markets we cover had higher positioning while the other six markets had lower speculator contracts.
Leading the gains for the softs markets was Wheat (13,199 contracts) with Soybean Oil (6,693 contracts), Coffee (5,218 contracts), Lean Hogs (4,692 contracts) and Soybean Meal (4,159 contracts) also showing positive weeks.
The markets with the declines in speculator bets this week were Sugar (-15,258 contracts) with Soybeans (-13,170 contracts), Corn (-11,291 contracts), Cocoa (-1,380 contracts), Cotton (-1,158 contracts) and with Live Cattle (-615 contracts) also registering lower bets on the week.
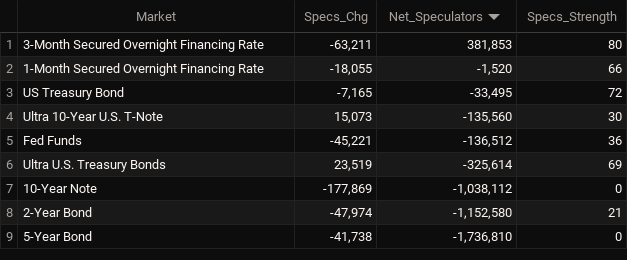
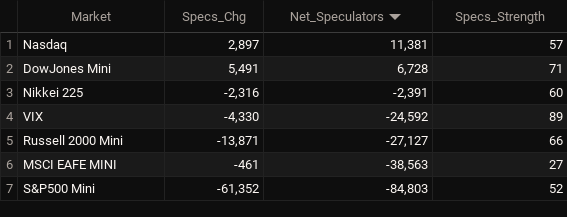
Soft Commodities Net Speculators Leaderboard
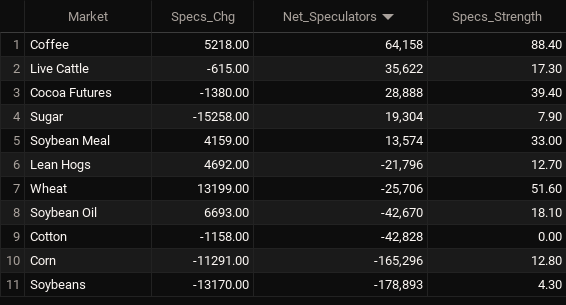
Legend: Weekly Speculators Change | Speculators Current Net Position | Speculators Strength Score compared to last 3-Years (0-100 range)
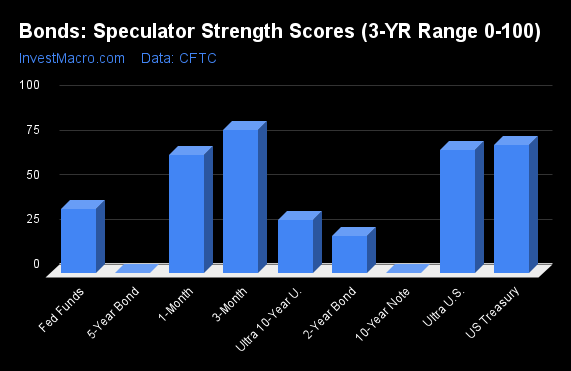
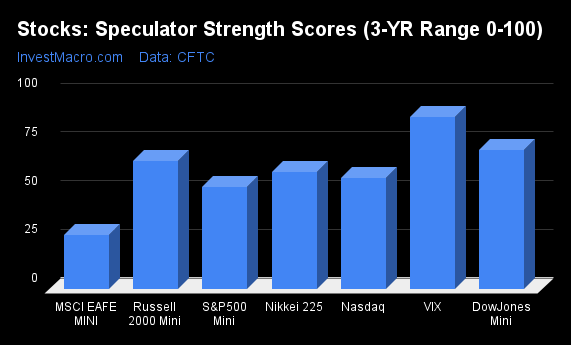
Strength Scores led by Coffee & Wheat
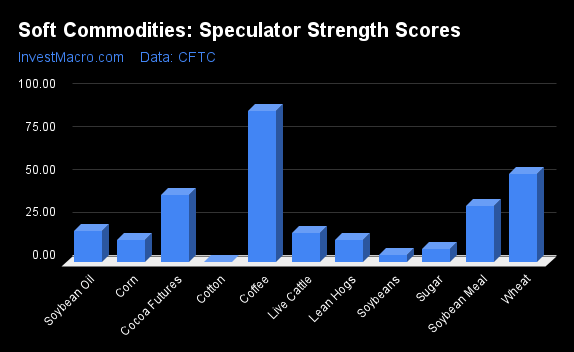
COT Strength Scores (a normalized measure of Speculator positions over a 3-Year range, from 0 to 100 where above 80 is Extreme-Bullish and below 20 is Extreme-Bearish) showed that Coffee (88 percent) leads the softs markets this week. Wheat (52 percent) comes in as the next highest in the weekly strength scores.
On the downside, Cotton (0 percent), Soybeans (4 percent), Sugar (8 percent), Corn (13 percent), Lean Hogs (13 percent), Live Cattle (17 percent) and Soybean Oil (18 percent) come in at the lowest strength levels currently and are in Extreme-Bearish territory (below 20 percent).
Strength Statistics:
Corn (12.8 percent) vs Corn previous week (14.3 percent)
Sugar (7.9 percent) vs Sugar previous week (13.1 percent)
Coffee (88.4 percent) vs Coffee previous week (83.3 percent)
Soybeans (4.3 percent) vs Soybeans previous week (7.4 percent)
Soybean Oil (18.1 percent) vs Soybean Oil previous week (14.4 percent)
Soybean Meal (33.0 percent) vs Soybean Meal previous week (31.3 percent)
Live Cattle (17.3 percent) vs Live Cattle previous week (18.0 percent)
Lean Hogs (12.7 percent) vs Lean Hogs previous week (8.6 percent)
Cotton (0.0 percent) vs Cotton previous week (0.7 percent)
Cocoa (39.4 percent) vs Cocoa previous week (40.8 percent)
Wheat (51.6 percent) vs Wheat previous week (42.0 percent)
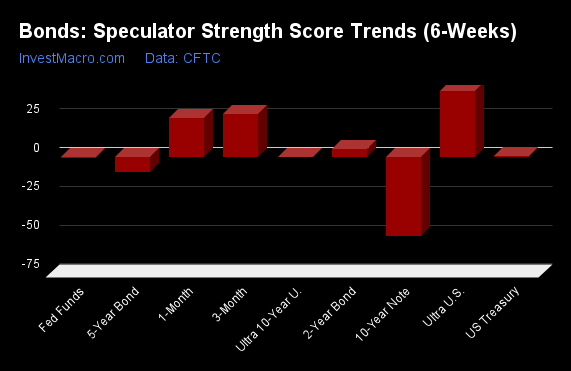
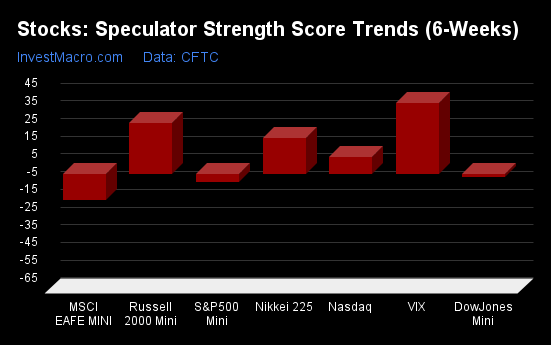
Corn tops the 6-Week Strength Trends
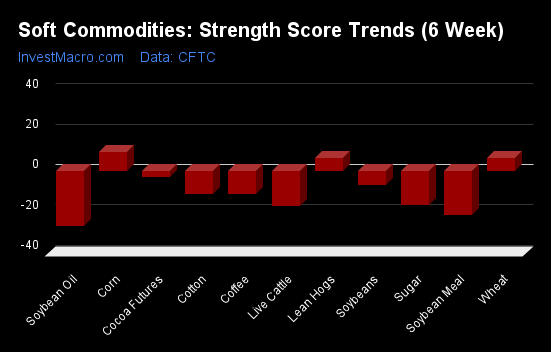
COT Strength Score Trends (or move index, calculates the 6-week changes in strength scores) showed that Corn (10 percent), Lean Hogs (7 percent) and Wheat (7 percent) lead the past six weeks trends for soft commodities.
Soybean Oil (-27 percent) leads the downside trend scores currently with Soybean Meal (-22 percent), Live Cattle (-17 percent) and Sugar (-16 percent) following next with lower trend scores.
Strength Trend Statistics:
Corn (9.5 percent) vs Corn previous week (9.5 percent)
Sugar (-16.5 percent) vs Sugar previous week (-10.3 percent)
Coffee (-11.0 percent) vs Coffee previous week (-8.6 percent)
Soybeans (-6.8 percent) vs Soybeans previous week (-10.3 percent)
Soybean Oil (-26.9 percent) vs Soybean Oil previous week (-10.2 percent)
Soybean Meal (-21.6 percent) vs Soybean Meal previous week (-27.6 percent)
Live Cattle (-16.9 percent) vs Live Cattle previous week (-15.5 percent)
Lean Hogs (6.7 percent) vs Lean Hogs previous week (2.2 percent)
Cotton (-11.2 percent) vs Cotton previous week (-14.8 percent)
Cocoa (-2.9 percent) vs Cocoa previous week (0.1 percent)
Wheat (6.5 percent) vs Wheat previous week (-0.2 percent)
Individual Soft Commodities Markets:
CORN Futures:
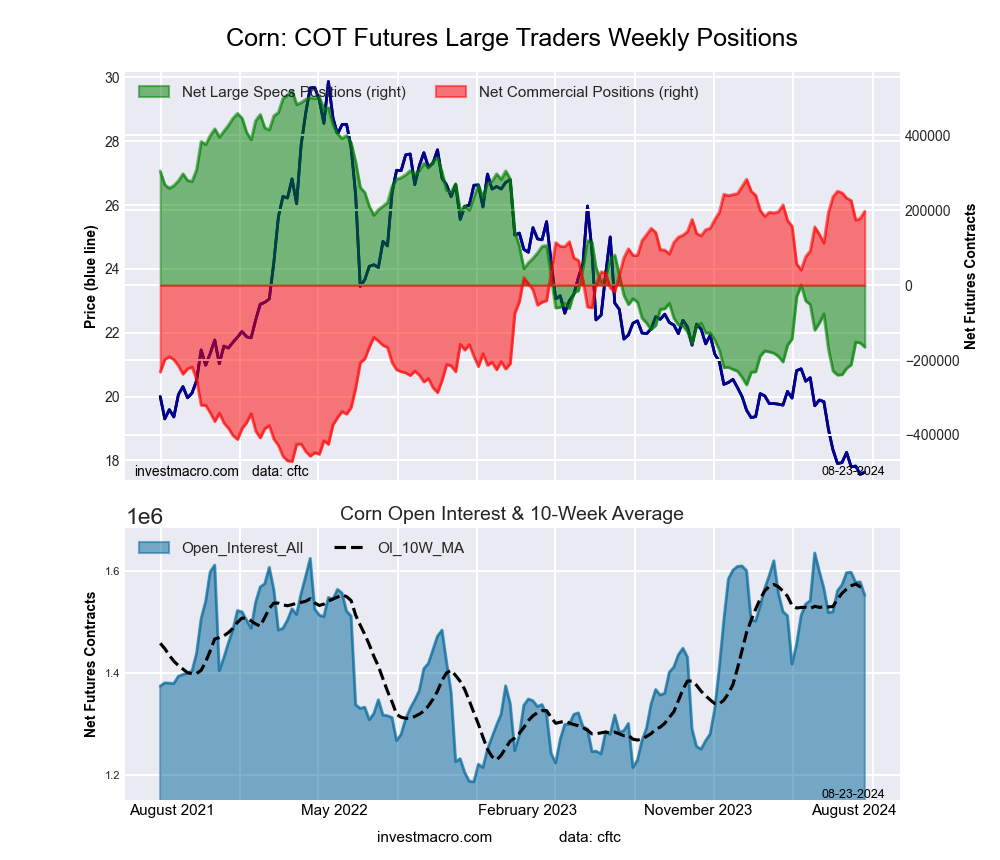 The CORN large speculator standing this week totaled a net position of -165,296 contracts in the data reported through Tuesday. This was a weekly decline of -11,291 contracts from the previous week which had a total of -154,005 net contracts.
This week’s current strength score (the trader positioning range over the past three years, measured from 0 to 100) shows the speculators are currently Bearish-Extreme with a score of 12.8 percent. The commercials are Bullish-Extreme with a score of 88.7 percent and the small traders (not shown in chart) are Bullish with a score of 65.3 percent.
Price Trend-Following Model: Strong Downtrend
Our weekly trend-following model classifies the current market price position as: Strong Downtrend. The current action for the model is considered to be: Hold – Maintain Short Position.
| CORN Futures Statistics | SPECULATORS | COMMERCIALS | SMALL TRADERS |
| – Percent of Open Interest Longs: | 20.6 | 44.9 | 9.1 |
| – Percent of Open Interest Shorts: | 31.2 | 32.2 | 11.1 |
| – Net Position: | -165,296 | 197,121 | -31,825 |
| – Gross Longs: | 319,844 | 697,858 | 140,896 |
| – Gross Shorts: | 485,140 | 500,737 | 172,721 |
| – Long to Short Ratio: | 0.7 to 1 | 1.4 to 1 | 0.8 to 1 |
| NET POSITION TREND: | | | |
| – Strength Index Score (3 Year Range Pct): | 12.8 | 88.7 | 65.3 |
| – Strength Index Reading (3 Year Range): | Bearish-Extreme | Bullish-Extreme | Bullish |
| NET POSITION MOVEMENT INDEX: | | | |
| – 6-Week Change in Strength Index: | 9.5 | -7.1 | -28.1 |
SUGAR Futures:
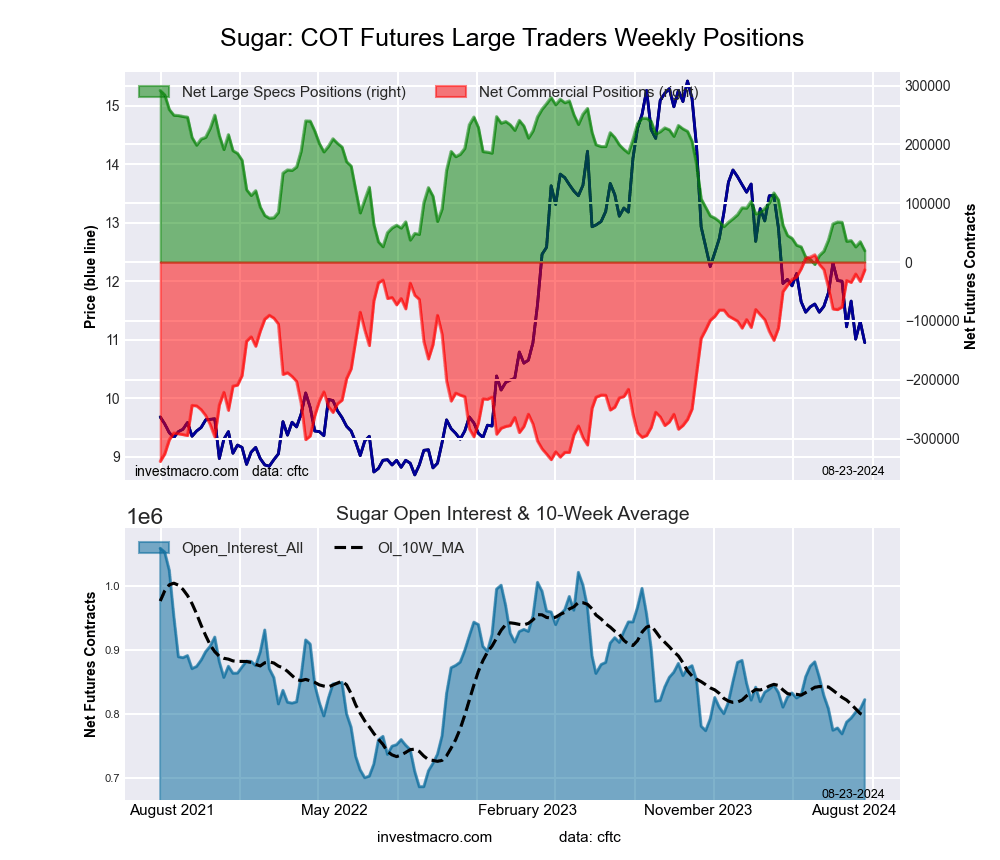 The SUGAR large speculator standing this week totaled a net position of 19,304 contracts in the data reported through Tuesday. This was a weekly fall of -15,258 contracts from the previous week which had a total of 34,562 net contracts.
This week’s current strength score (the trader positioning range over the past three years, measured from 0 to 100) shows the speculators are currently Bearish-Extreme with a score of 7.9 percent. The commercials are Bullish-Extreme with a score of 92.7 percent and the small traders (not shown in chart) are Bearish-Extreme with a score of 11.8 percent.
Price Trend-Following Model: Downtrend
Our weekly trend-following model classifies the current market price position as: Downtrend. The current action for the model is considered to be: Hold – Maintain Short Position.
| SUGAR Futures Statistics | SPECULATORS | COMMERCIALS | SMALL TRADERS |
| – Percent of Open Interest Longs: | 22.9 | 54.2 | 7.5 |
| – Percent of Open Interest Shorts: | 20.5 | 55.8 | 8.3 |
| – Net Position: | 19,304 | -13,294 | -6,010 |
| – Gross Longs: | 188,316 | 446,314 | 62,107 |
| – Gross Shorts: | 169,012 | 459,608 | 68,117 |
| – Long to Short Ratio: | 1.1 to 1 | 1.0 to 1 | 0.9 to 1 |
| NET POSITION TREND: | | | |
| – Strength Index Score (3 Year Range Pct): | 7.9 | 92.7 | 11.8 |
| – Strength Index Reading (3 Year Range): | Bearish-Extreme | Bullish-Extreme | Bearish-Extreme |
| NET POSITION MOVEMENT INDEX: | | | |
| – 6-Week Change in Strength Index: | -16.5 | 19.2 | -24.5 |
COFFEE Futures:
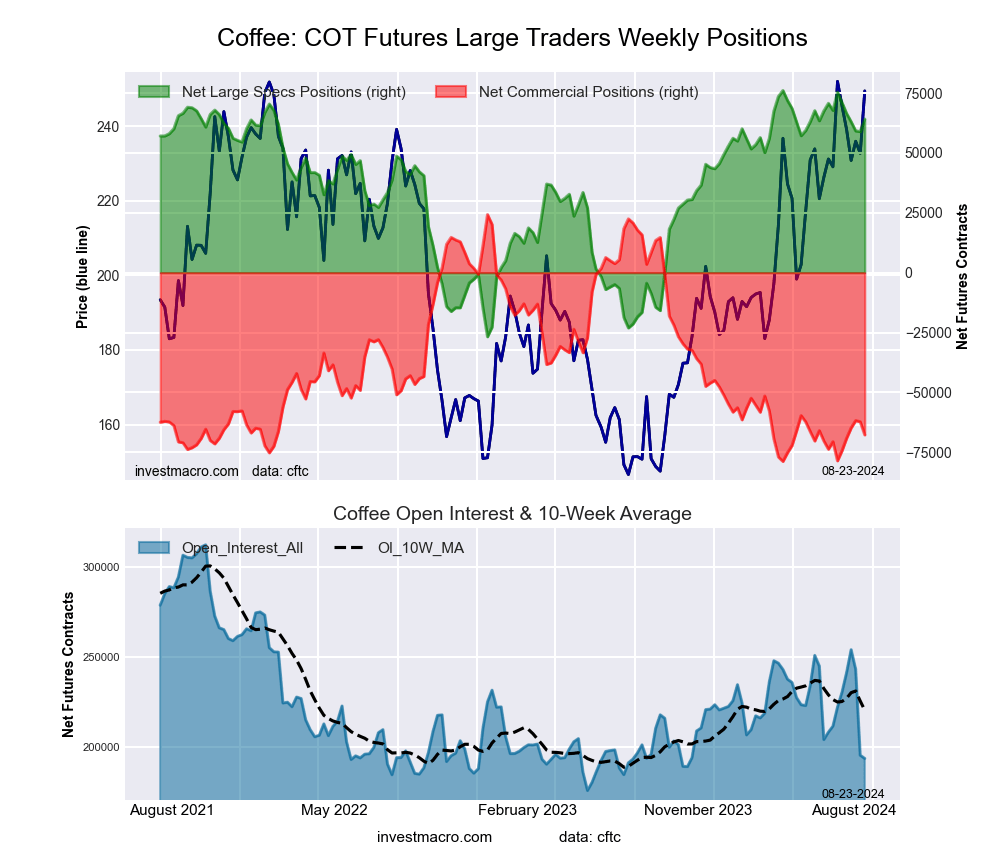 The COFFEE large speculator standing this week totaled a net position of 64,158 contracts in the data reported through Tuesday. This was a weekly rise of 5,218 contracts from the previous week which had a total of 58,940 net contracts.
This week’s current strength score (the trader positioning range over the past three years, measured from 0 to 100) shows the speculators are currently Bullish-Extreme with a score of 88.4 percent. The commercials are Bearish-Extreme with a score of 10.8 percent and the small traders (not shown in chart) are Bullish with a score of 71.8 percent.
Price Trend-Following Model: Strong Uptrend
Our weekly trend-following model classifies the current market price position as: Strong Uptrend. The current action for the model is considered to be: Hold – Maintain Long Position.
| COFFEE Futures Statistics | SPECULATORS | COMMERCIALS | SMALL TRADERS |
| – Percent of Open Interest Longs: | 40.9 | 38.8 | 4.3 |
| – Percent of Open Interest Shorts: | 7.7 | 73.8 | 2.4 |
| – Net Position: | 64,158 | -67,737 | 3,579 |
| – Gross Longs: | 79,032 | 74,979 | 8,296 |
| – Gross Shorts: | 14,874 | 142,716 | 4,717 |
| – Long to Short Ratio: | 5.3 to 1 | 0.5 to 1 | 1.8 to 1 |
| NET POSITION TREND: | | | |
| – Strength Index Score (3 Year Range Pct): | 88.4 | 10.8 | 71.8 |
| – Strength Index Reading (3 Year Range): | Bullish-Extreme | Bearish-Extreme | Bullish |
| NET POSITION MOVEMENT INDEX: | | | |
| – 6-Week Change in Strength Index: | -11.0 | 10.5 | 6.5 |
SOYBEANS Futures:
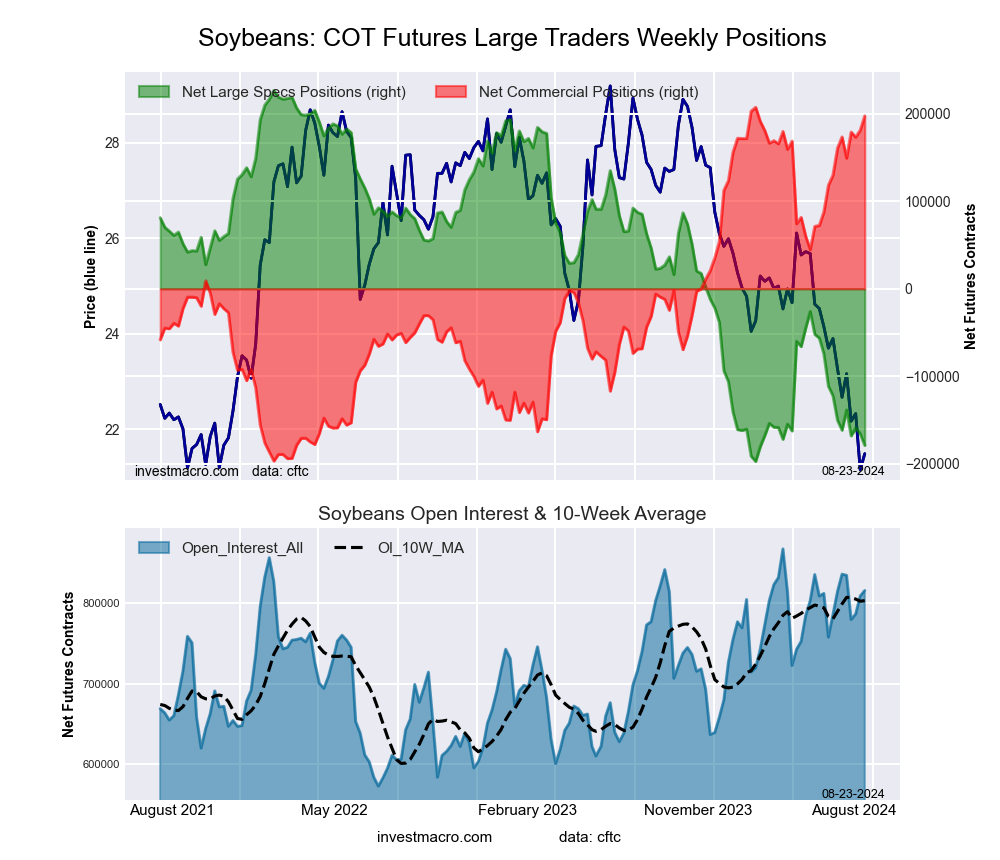 The SOYBEANS large speculator standing this week totaled a net position of -178,893 contracts in the data reported through Tuesday. This was a weekly reduction of -13,170 contracts from the previous week which had a total of -165,723 net contracts.
This week’s current strength score (the trader positioning range over the past three years, measured from 0 to 100) shows the speculators are currently Bearish-Extreme with a score of 4.3 percent. The commercials are Bullish-Extreme with a score of 97.6 percent and the small traders (not shown in chart) are Bullish with a score of 64.0 percent.
Price Trend-Following Model: Strong Downtrend
Our weekly trend-following model classifies the current market price position as: Strong Downtrend. The current action for the model is considered to be: Hold – Maintain Short Position.
| SOYBEANS Futures Statistics | SPECULATORS | COMMERCIALS | SMALL TRADERS |
| – Percent of Open Interest Longs: | 13.0 | 62.7 | 4.9 |
| – Percent of Open Interest Shorts: | 34.9 | 38.5 | 7.2 |
| – Net Position: | -178,893 | 197,454 | -18,561 |
| – Gross Longs: | 105,737 | 511,626 | 39,933 |
| – Gross Shorts: | 284,630 | 314,172 | 58,494 |
| – Long to Short Ratio: | 0.4 to 1 | 1.6 to 1 | 0.7 to 1 |
| NET POSITION TREND: | | | |
| – Strength Index Score (3 Year Range Pct): | 4.3 | 97.6 | 64.0 |
| – Strength Index Reading (3 Year Range): | Bearish-Extreme | Bullish-Extreme | Bullish |
| NET POSITION MOVEMENT INDEX: | | | |
| – 6-Week Change in Strength Index: | -6.8 | 9.1 | -20.9 |
SOYBEAN OIL Futures:
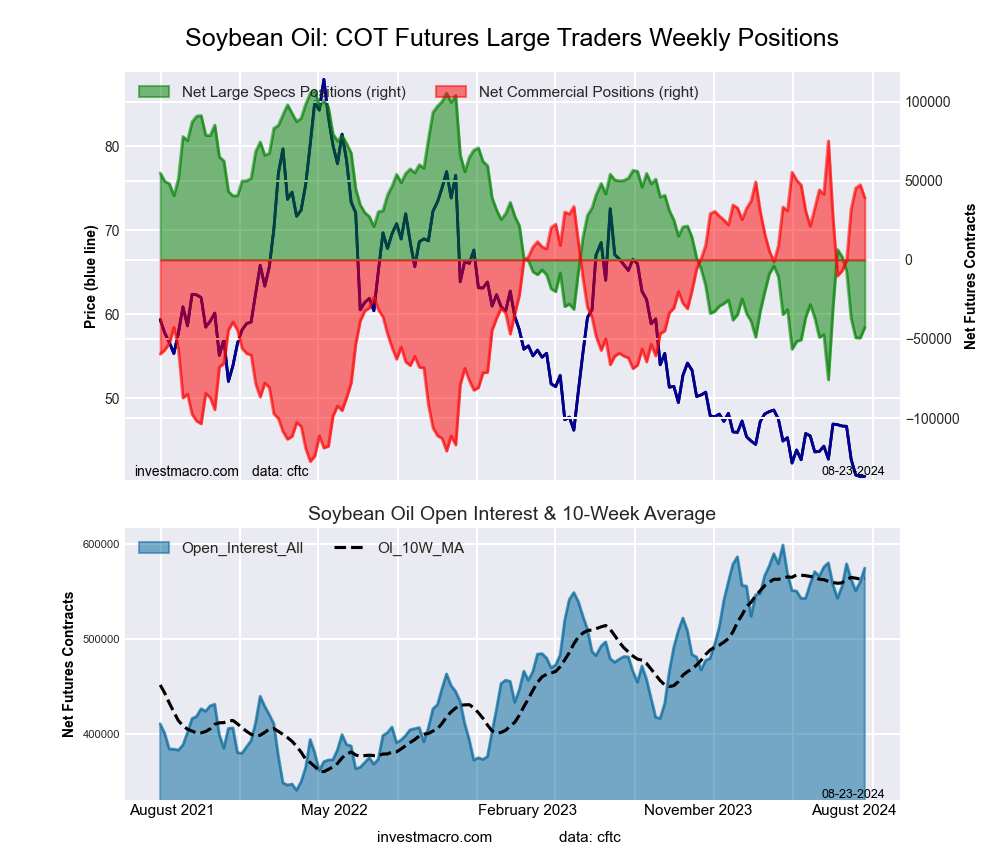 The SOYBEAN OIL large speculator standing this week totaled a net position of -42,670 contracts in the data reported through Tuesday. This was a weekly gain of 6,693 contracts from the previous week which had a total of -49,363 net contracts.
This week’s current strength score (the trader positioning range over the past three years, measured from 0 to 100) shows the speculators are currently Bearish-Extreme with a score of 18.1 percent. The commercials are Bullish-Extreme with a score of 82.3 percent and the small traders (not shown in chart) are Bearish with a score of 27.7 percent.
Price Trend-Following Model: Strong Downtrend
Our weekly trend-following model classifies the current market price position as: Strong Downtrend. The current action for the model is considered to be: Hold – Maintain Short Position.
| SOYBEAN OIL Futures Statistics | SPECULATORS | COMMERCIALS | SMALL TRADERS |
| – Percent of Open Interest Longs: | 23.3 | 53.2 | 5.3 |
| – Percent of Open Interest Shorts: | 30.7 | 46.4 | 4.7 |
| – Net Position: | -42,670 | 39,149 | 3,521 |
| – Gross Longs: | 133,857 | 305,934 | 30,612 |
| – Gross Shorts: | 176,527 | 266,785 | 27,091 |
| – Long to Short Ratio: | 0.8 to 1 | 1.1 to 1 | 1.1 to 1 |
| NET POSITION TREND: | | | |
| – Strength Index Score (3 Year Range Pct): | 18.1 | 82.3 | 27.7 |
| – Strength Index Reading (3 Year Range): | Bearish-Extreme | Bullish-Extreme | Bearish |
| NET POSITION MOVEMENT INDEX: | | | |
| – 6-Week Change in Strength Index: | -26.9 | 24.3 | -0.6 |
SOYBEAN MEAL Futures:
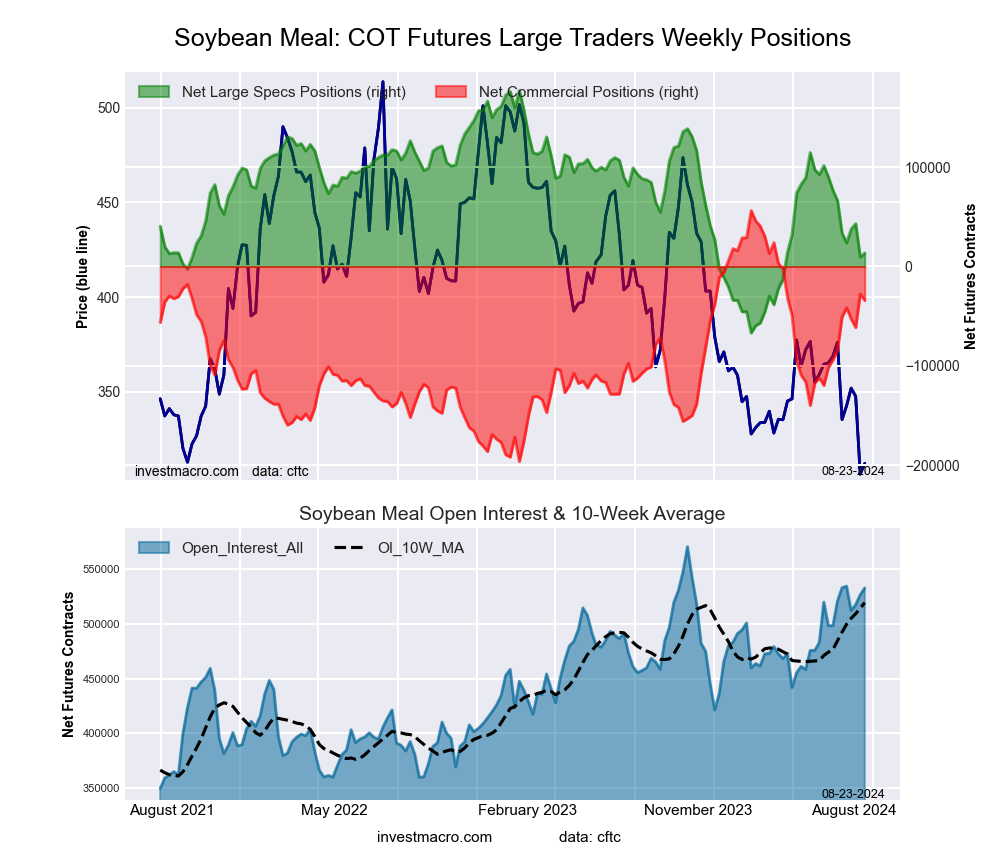 The SOYBEAN MEAL large speculator standing this week totaled a net position of 13,574 contracts in the data reported through Tuesday. This was a weekly lift of 4,159 contracts from the previous week which had a total of 9,415 net contracts.
This week’s current strength score (the trader positioning range over the past three years, measured from 0 to 100) shows the speculators are currently Bearish with a score of 33.0 percent. The commercials are Bullish with a score of 64.2 percent and the small traders (not shown in chart) are Bearish with a score of 48.5 percent.
Price Trend-Following Model: Strong Downtrend
Our weekly trend-following model classifies the current market price position as: Strong Downtrend. The current action for the model is considered to be: Hold – Maintain Short Position.
| SOYBEAN MEAL Futures Statistics | SPECULATORS | COMMERCIALS | SMALL TRADERS |
| – Percent of Open Interest Longs: | 22.2 | 46.4 | 9.3 |
| – Percent of Open Interest Shorts: | 19.6 | 52.8 | 5.4 |
| – Net Position: | 13,574 | -34,197 | 20,623 |
| – Gross Longs: | 118,191 | 247,393 | 49,516 |
| – Gross Shorts: | 104,617 | 281,590 | 28,893 |
| – Long to Short Ratio: | 1.1 to 1 | 0.9 to 1 | 1.7 to 1 |
| NET POSITION TREND: | | | |
| – Strength Index Score (3 Year Range Pct): | 33.0 | 64.2 | 48.5 |
| – Strength Index Reading (3 Year Range): | Bearish | Bullish | Bearish |
| NET POSITION MOVEMENT INDEX: | | | |
| – 6-Week Change in Strength Index: | -21.6 | 19.9 | 11.5 |
LIVE CATTLE Futures:
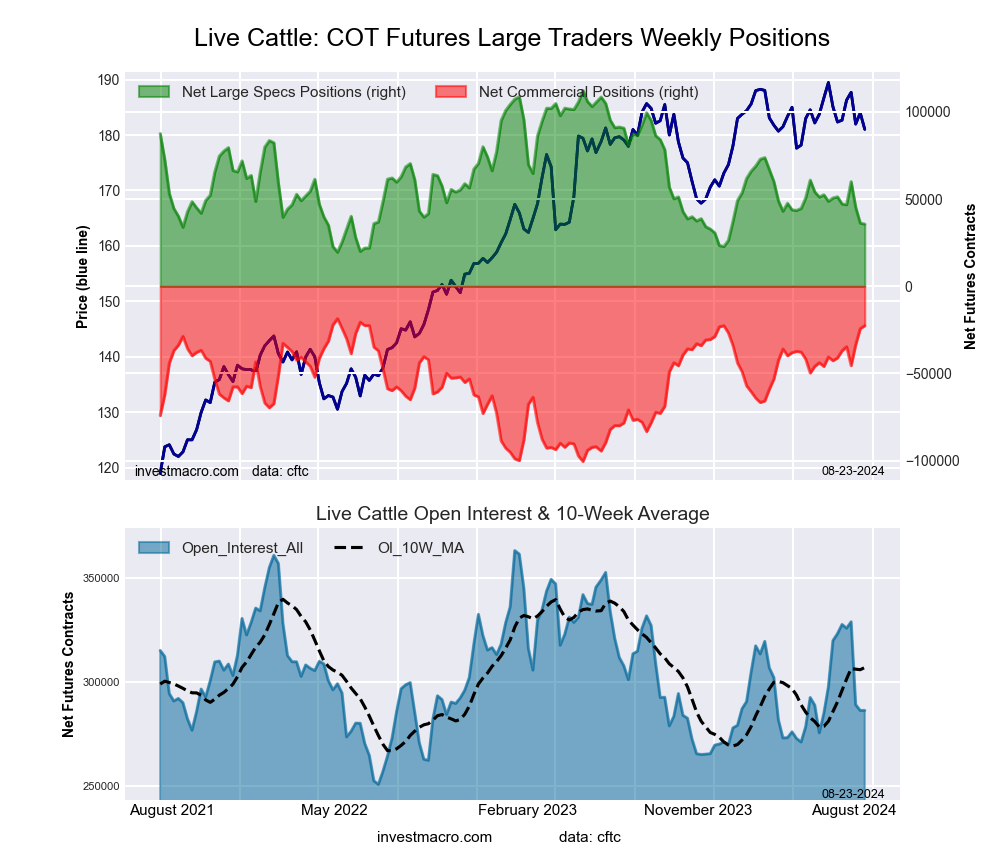 The LIVE CATTLE large speculator standing this week totaled a net position of 35,622 contracts in the data reported through Tuesday. This was a weekly reduction of -615 contracts from the previous week which had a total of 36,237 net contracts.
This week’s current strength score (the trader positioning range over the past three years, measured from 0 to 100) shows the speculators are currently Bearish-Extreme with a score of 17.3 percent. The commercials are Bullish-Extreme with a score of 95.1 percent and the small traders (not shown in chart) are Bearish with a score of 20.4 percent.
Price Trend-Following Model: Weak Uptrend
Our weekly trend-following model classifies the current market price position as: Weak Uptrend. The current action for the model is considered to be: Hold – Maintain Long Position.
| LIVE CATTLE Futures Statistics | SPECULATORS | COMMERCIALS | SMALL TRADERS |
| – Percent of Open Interest Longs: | 34.3 | 36.0 | 9.7 |
| – Percent of Open Interest Shorts: | 21.9 | 43.9 | 14.2 |
| – Net Position: | 35,622 | -22,612 | -13,010 |
| – Gross Longs: | 98,255 | 103,189 | 27,738 |
| – Gross Shorts: | 62,633 | 125,801 | 40,748 |
| – Long to Short Ratio: | 1.6 to 1 | 0.8 to 1 | 0.7 to 1 |
| NET POSITION TREND: | | | |
| – Strength Index Score (3 Year Range Pct): | 17.3 | 95.1 | 20.4 |
| – Strength Index Reading (3 Year Range): | Bearish-Extreme | Bullish-Extreme | Bearish |
| NET POSITION MOVEMENT INDEX: | | | |
| – 6-Week Change in Strength Index: | -16.9 | 22.5 | -14.9 |
LEAN HOGS Futures:
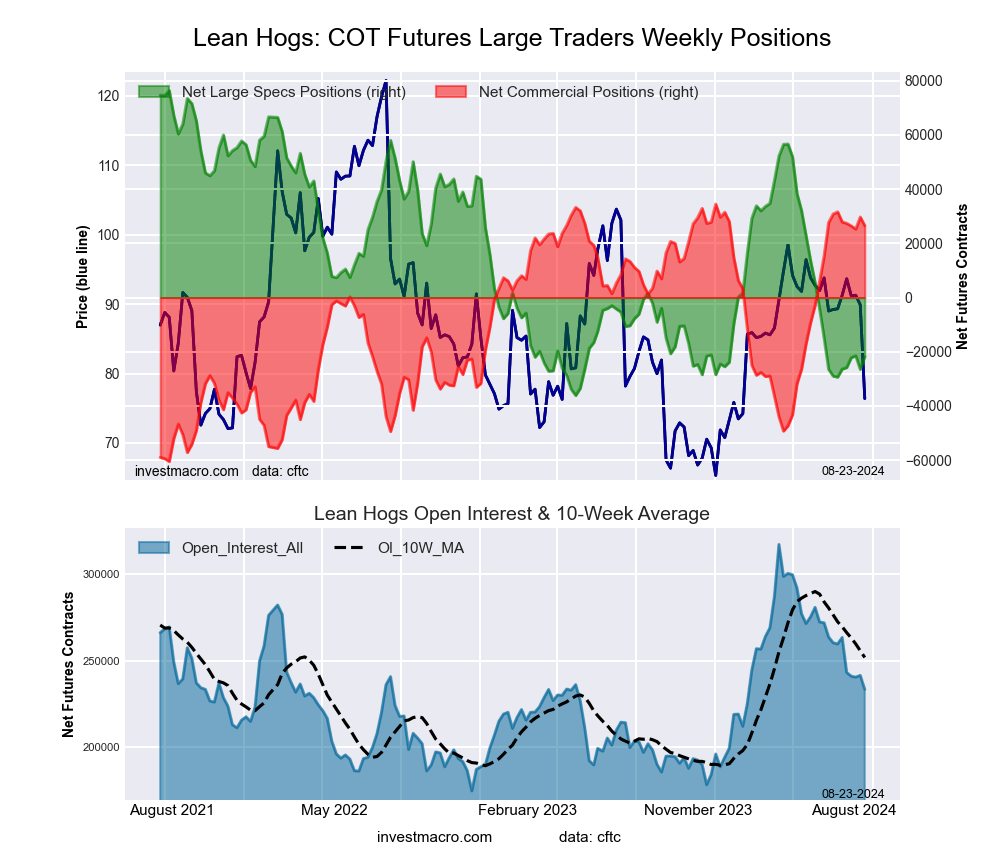 The LEAN HOGS large speculator standing this week totaled a net position of -21,796 contracts in the data reported through Tuesday. This was a weekly boost of 4,692 contracts from the previous week which had a total of -26,488 net contracts.
This week’s current strength score (the trader positioning range over the past three years, measured from 0 to 100) shows the speculators are currently Bearish-Extreme with a score of 12.7 percent. The commercials are Bullish-Extreme with a score of 91.6 percent and the small traders (not shown in chart) are Bullish with a score of 62.2 percent.
Price Trend-Following Model: Strong Downtrend
Our weekly trend-following model classifies the current market price position as: Strong Downtrend. The current action for the model is considered to be: Hold – Maintain Short Position.
| LEAN HOGS Futures Statistics | SPECULATORS | COMMERCIALS | SMALL TRADERS |
| – Percent of Open Interest Longs: | 36.9 | 39.1 | 6.1 |
| – Percent of Open Interest Shorts: | 46.3 | 27.7 | 8.1 |
| – Net Position: | -21,796 | 26,506 | -4,710 |
| – Gross Longs: | 86,247 | 91,225 | 14,296 |
| – Gross Shorts: | 108,043 | 64,719 | 19,006 |
| – Long to Short Ratio: | 0.8 to 1 | 1.4 to 1 | 0.8 to 1 |
| NET POSITION TREND: | | | |
| – Strength Index Score (3 Year Range Pct): | 12.7 | 91.6 | 62.2 |
| – Strength Index Reading (3 Year Range): | Bearish-Extreme | Bullish-Extreme | Bullish |
| NET POSITION MOVEMENT INDEX: | | | |
| – 6-Week Change in Strength Index: | 6.7 | -5.4 | -11.0 |
COTTON Futures:
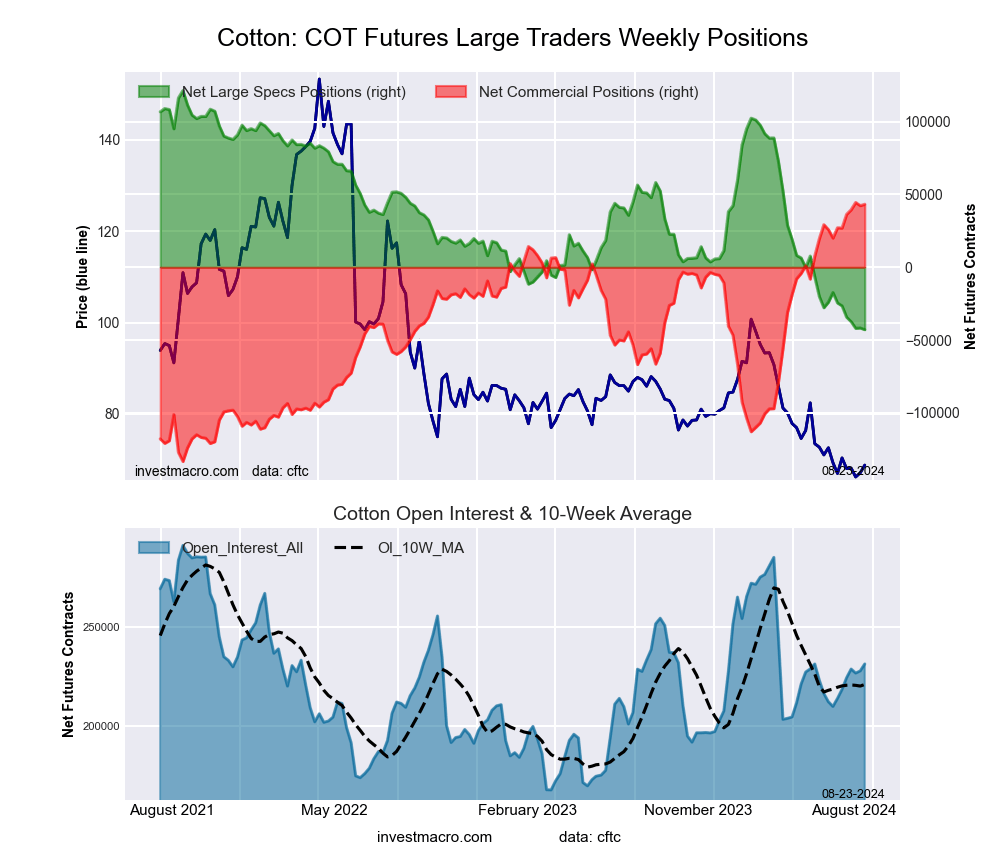 The COTTON large speculator standing this week totaled a net position of -42,828 contracts in the data reported through Tuesday. This was a weekly decrease of -1,158 contracts from the previous week which had a total of -41,670 net contracts.
This week’s current strength score (the trader positioning range over the past three years, measured from 0 to 100) shows the speculators are currently Bearish-Extreme with a score of 0.0 percent. The commercials are Bullish-Extreme with a score of 99.3 percent and the small traders (not shown in chart) are Bearish-Extreme with a score of 14.0 percent.
Price Trend-Following Model: Downtrend
Our weekly trend-following model classifies the current market price position as: Downtrend. The current action for the model is considered to be: Hold – Maintain Short Position.
| COTTON Futures Statistics | SPECULATORS | COMMERCIALS | SMALL TRADERS |
| – Percent of Open Interest Longs: | 25.2 | 49.5 | 5.8 |
| – Percent of Open Interest Shorts: | 43.7 | 30.8 | 5.9 |
| – Net Position: | -42,828 | 43,223 | -395 |
| – Gross Longs: | 58,393 | 114,521 | 13,326 |
| – Gross Shorts: | 101,221 | 71,298 | 13,721 |
| – Long to Short Ratio: | 0.6 to 1 | 1.6 to 1 | 1.0 to 1 |
| NET POSITION TREND: | | | |
| – Strength Index Score (3 Year Range Pct): | 0.0 | 99.3 | 14.0 |
| – Strength Index Reading (3 Year Range): | Bearish-Extreme | Bullish-Extreme | Bearish-Extreme |
| NET POSITION MOVEMENT INDEX: | | | |
| – 6-Week Change in Strength Index: | -11.2 | 9.1 | 13.3 |
COCOA Futures:
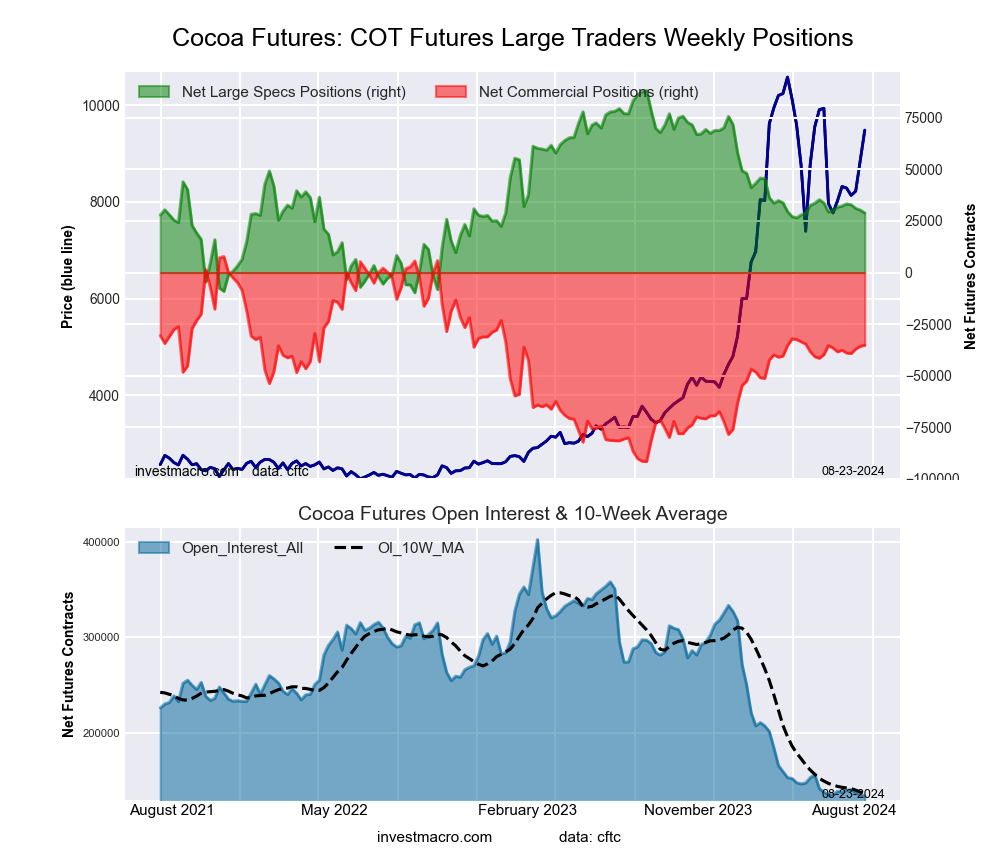 The COCOA large speculator standing this week totaled a net position of 28,888 contracts in the data reported through Tuesday. This was a weekly reduction of -1,380 contracts from the previous week which had a total of 30,268 net contracts.
This week’s current strength score (the trader positioning range over the past three years, measured from 0 to 100) shows the speculators are currently Bearish with a score of 39.4 percent. The commercials are Bullish with a score of 56.7 percent and the small traders (not shown in chart) are Bullish with a score of 66.5 percent.
Price Trend-Following Model: Weak Downtrend
Our weekly trend-following model classifies the current market price position as: Weak Downtrend. The current action for the model is considered to be: Hold – Maintain Short Position.
| COCOA Futures Statistics | SPECULATORS | COMMERCIALS | SMALL TRADERS |
| – Percent of Open Interest Longs: | 38.9 | 30.3 | 8.8 |
| – Percent of Open Interest Shorts: | 17.3 | 56.7 | 4.0 |
| – Net Position: | 28,888 | -35,270 | 6,382 |
| – Gross Longs: | 51,923 | 40,369 | 11,703 |
| – Gross Shorts: | 23,035 | 75,639 | 5,321 |
| – Long to Short Ratio: | 2.3 to 1 | 0.5 to 1 | 2.2 to 1 |
| NET POSITION TREND: | | | |
| – Strength Index Score (3 Year Range Pct): | 39.4 | 56.7 | 66.5 |
| – Strength Index Reading (3 Year Range): | Bearish | Bullish | Bullish |
| NET POSITION MOVEMENT INDEX: | | | |
| – 6-Week Change in Strength Index: | -2.9 | 3.2 | -2.6 |
WHEAT Futures:
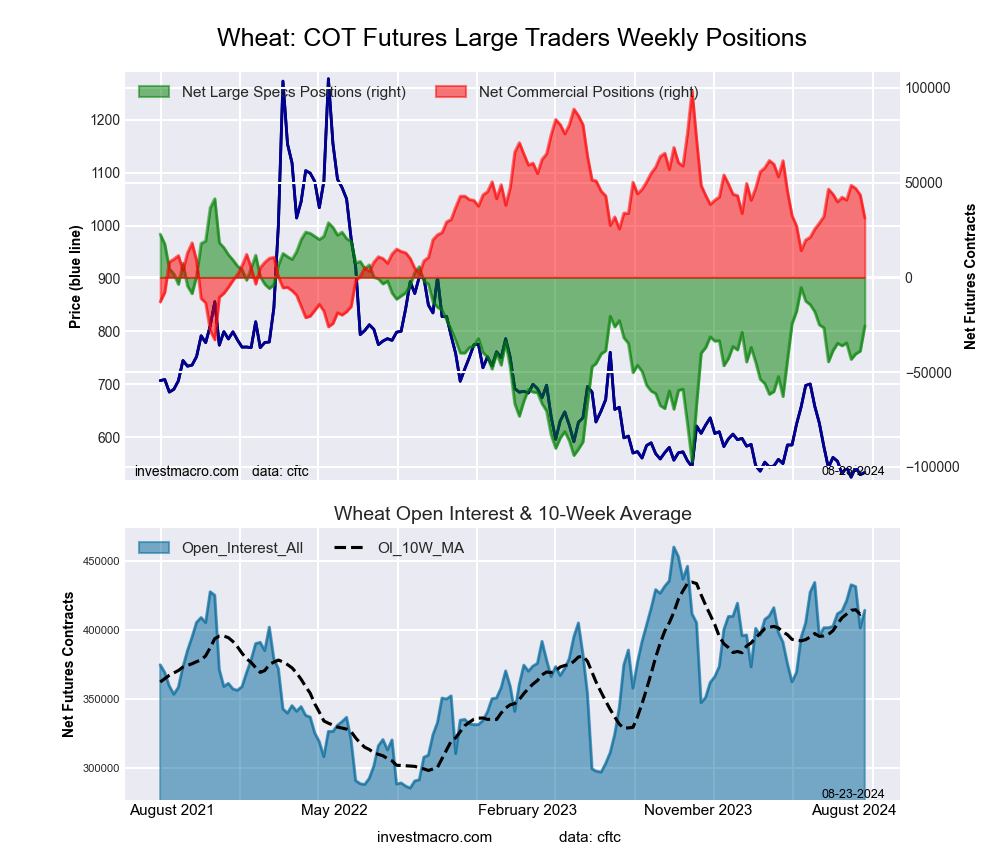 The WHEAT large speculator standing this week totaled a net position of -25,706 contracts in the data reported through Tuesday. This was a weekly lift of 13,199 contracts from the previous week which had a total of -38,905 net contracts.
This week’s current strength score (the trader positioning range over the past three years, measured from 0 to 100) shows the speculators are currently Bullish with a score of 51.6 percent. The commercials are Bearish with a score of 48.9 percent and the small traders (not shown in chart) are Bearish with a score of 34.2 percent.
Price Trend-Following Model: Strong Downtrend
Our weekly trend-following model classifies the current market price position as: Strong Downtrend. The current action for the model is considered to be: Hold – Maintain Short Position.
| WHEAT Futures Statistics | SPECULATORS | COMMERCIALS | SMALL TRADERS |
| – Percent of Open Interest Longs: | 32.4 | 33.9 | 7.8 |
| – Percent of Open Interest Shorts: | 38.6 | 26.3 | 9.1 |
| – Net Position: | -25,706 | 31,360 | -5,654 |
| – Gross Longs: | 134,387 | 140,441 | 32,167 |
| – Gross Shorts: | 160,093 | 109,081 | 37,821 |
| – Long to Short Ratio: | 0.8 to 1 | 1.3 to 1 | 0.9 to 1 |
| NET POSITION TREND: | | | |
| – Strength Index Score (3 Year Range Pct): | 51.6 | 48.9 | 34.2 |
| – Strength Index Reading (3 Year Range): | Bullish | Bearish | Bearish |
| NET POSITION MOVEMENT INDEX: | | | |
| – 6-Week Change in Strength Index: | 6.5 | -6.5 | -2.8 |
Article By InvestMacro – Receive our weekly COT Newsletter
*COT Report: The COT data, released weekly to the public each Friday, is updated through the most recent Tuesday (data is 3 days old) and shows a quick view of how large speculators or non-commercials (for-profit traders) were positioned in the futures markets.
The CFTC categorizes trader positions according to commercial hedgers (traders who use futures contracts for hedging as part of the business), non-commercials (large traders who speculate to realize trading profits) and nonreportable traders (usually small traders/speculators) as well as their open interest (contracts open in the market at time of reporting). See CFTC criteria here.