By InvestMacro
Here are the latest charts and statistics for the Commitment of Traders (COT) reports data published by the Commodities Futures Trading Commission (CFTC).
The latest COT data is updated through Tuesday March 24th and shows a quick view of how large traders (for-profit speculators and commercial hedgers) were positioned in the futures markets.
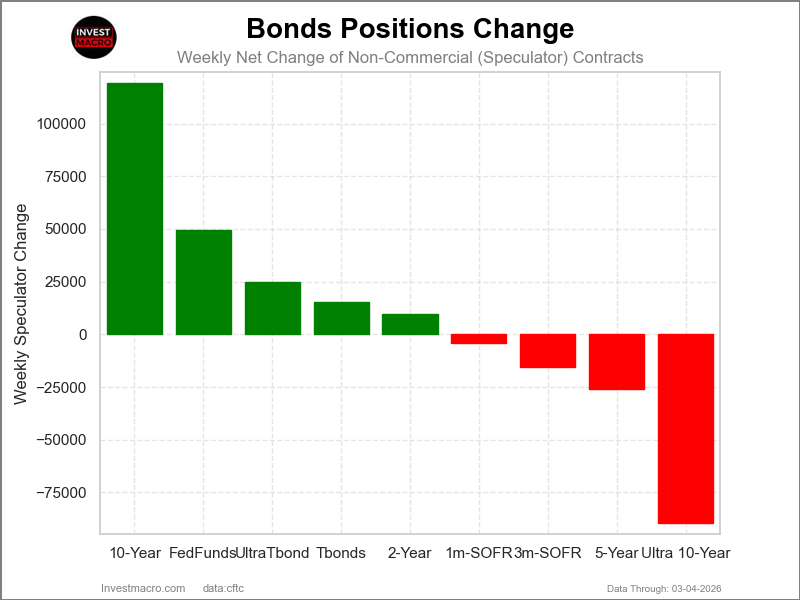
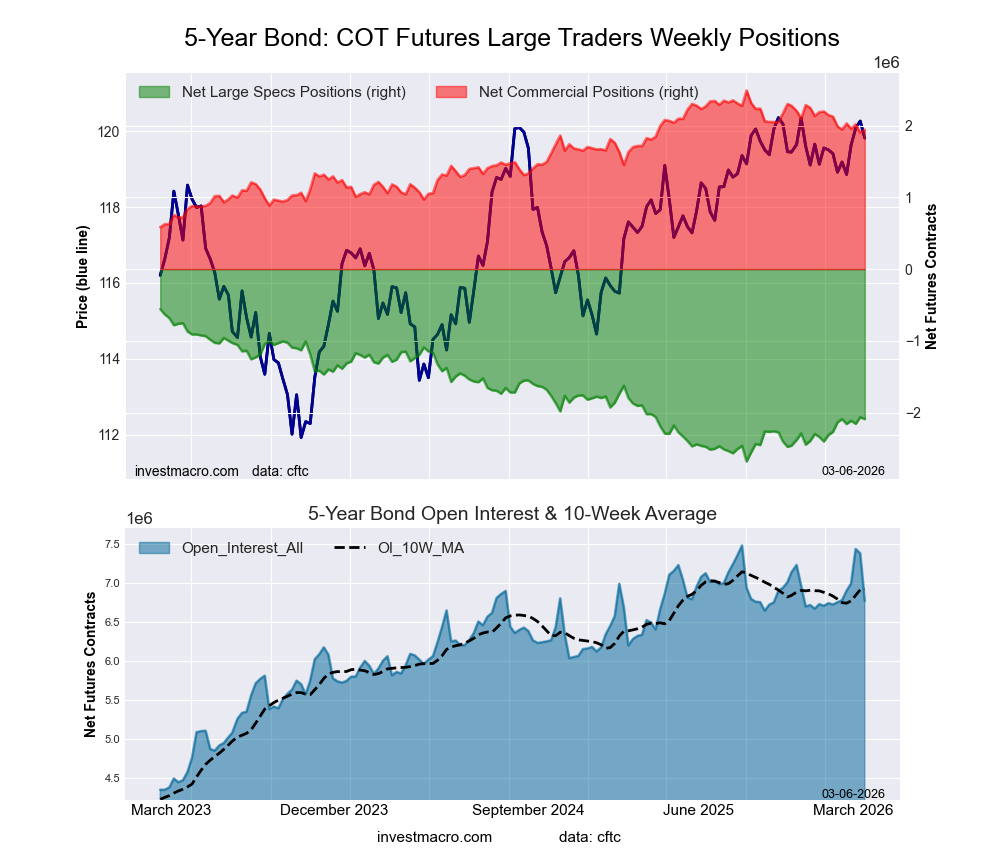
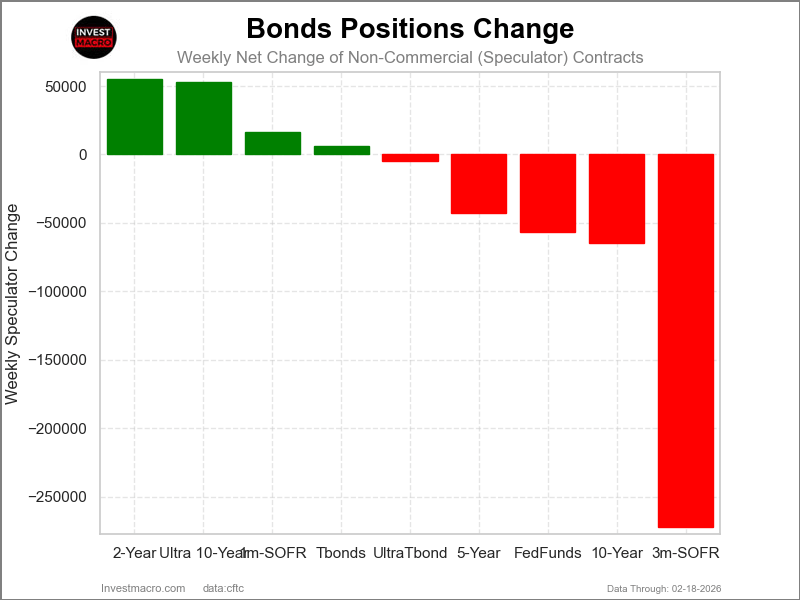
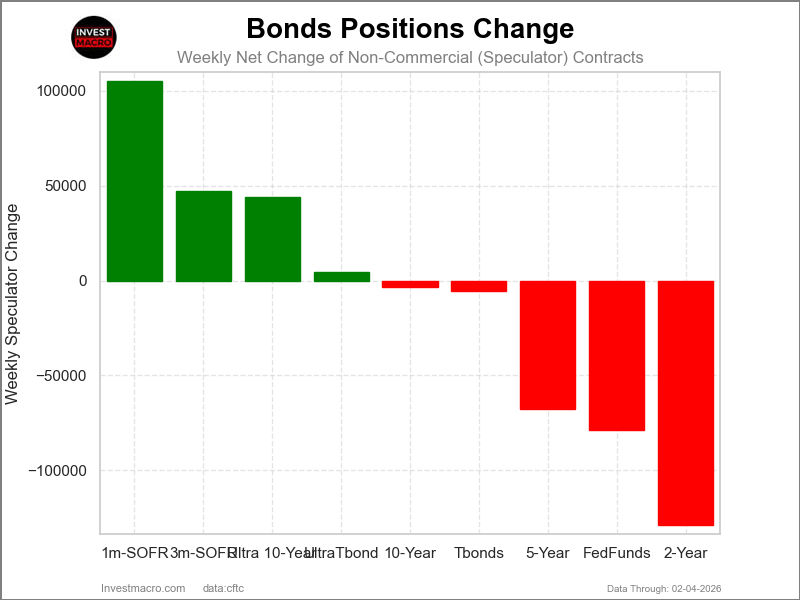
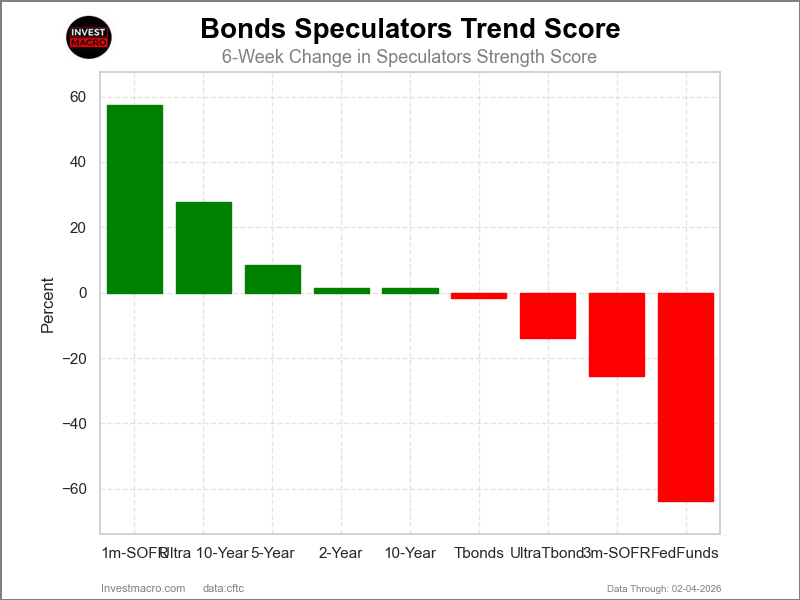
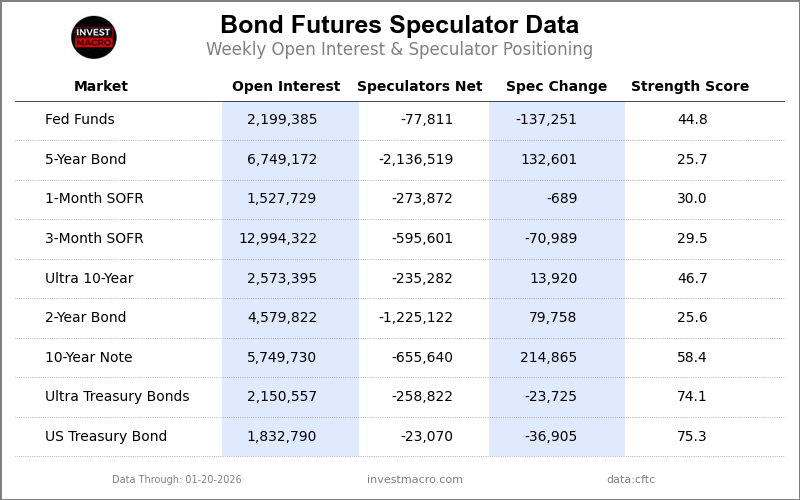
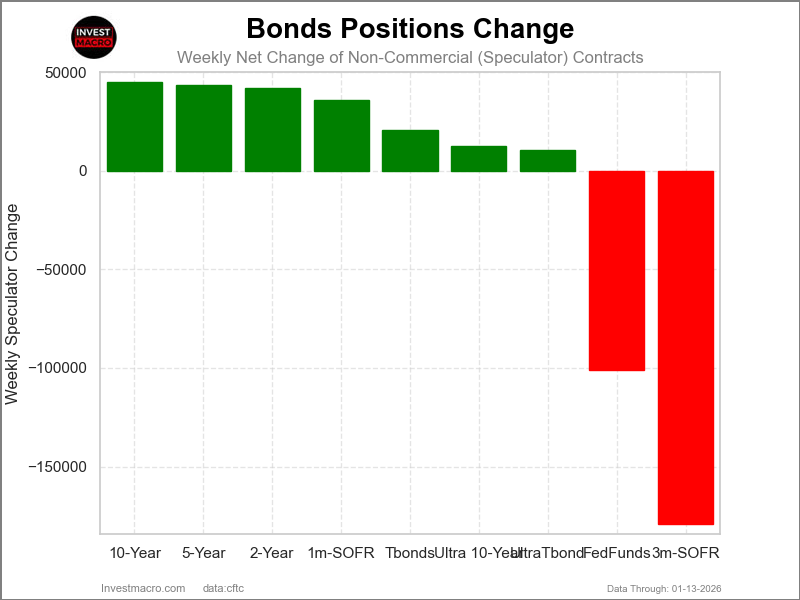
Weekly Speculator Changes led by 5-Year Bonds
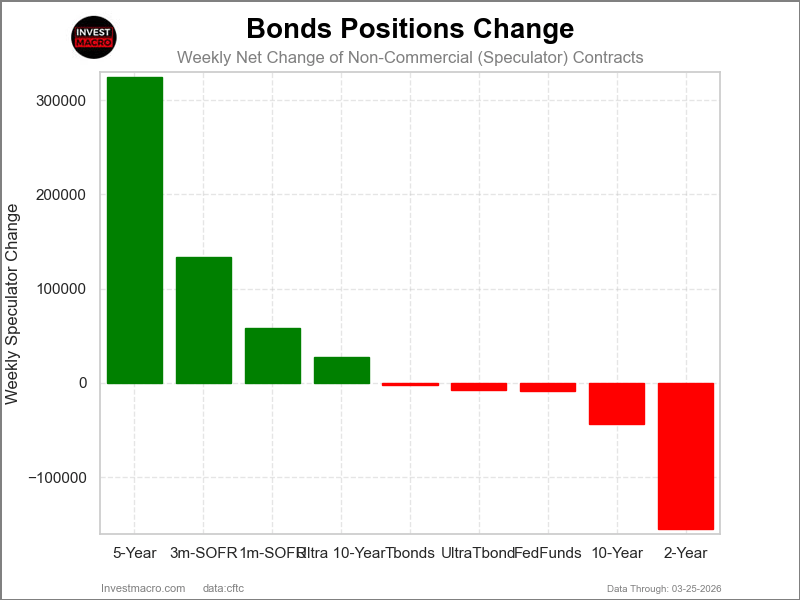
The COT bond market speculator bets were slightly lower this week as four out of the nine bond markets we cover had higher positioning while the other five markets had lower speculator contracts.
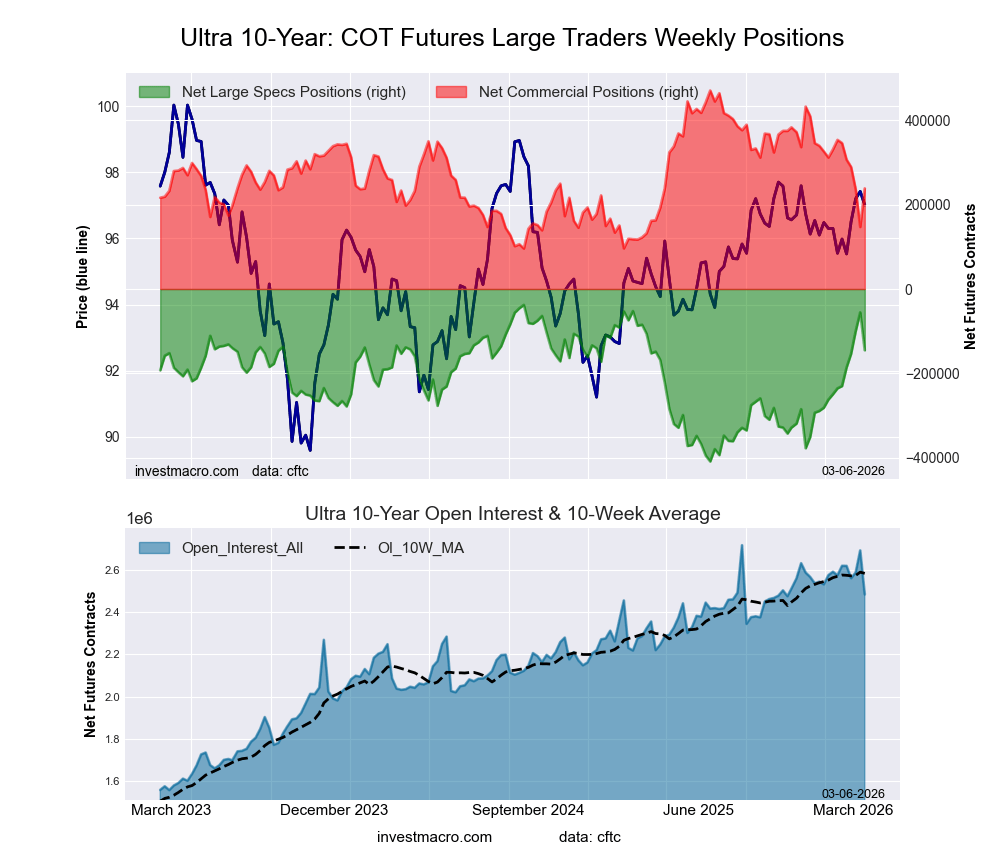
Leading the gains for the bond markets was the 5-Year Bonds (325,016 contracts) with the SOFR 3-Months (134,015 contracts), the SOFR 1-Month (58,570 contracts) and the Ultra 10-Year Bonds (27,241 contracts) also recording positive weeks.
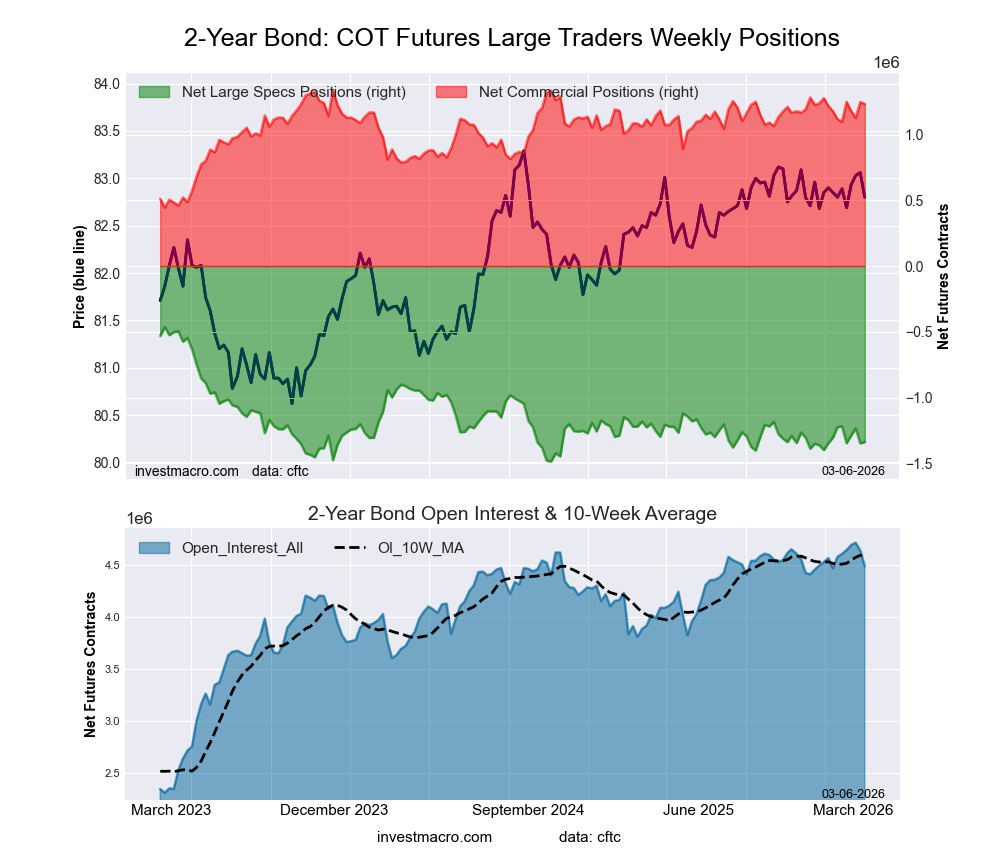
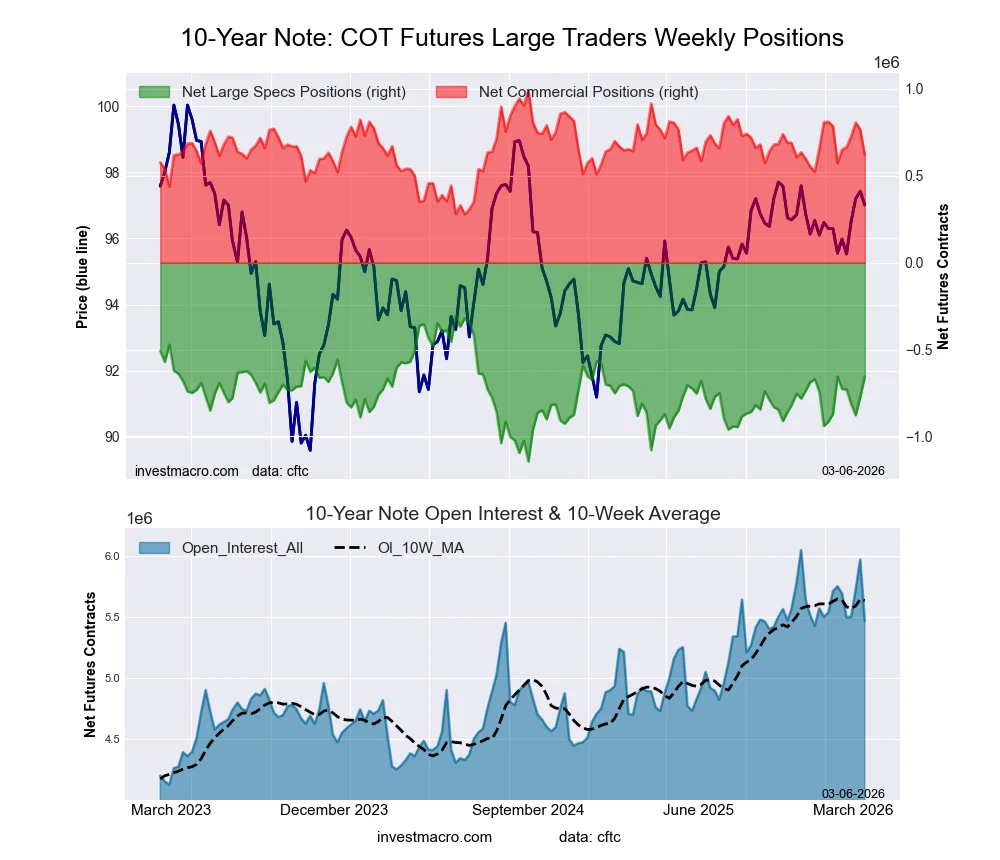
The bond markets with declines in speculator bets for the week were the 2-Year Bonds (-155,512 contracts), the 10-Year Bonds (-44,009 contracts), the Fed Funds (-8,643 contracts), the Ultra Treasury Bonds (-8,050 contracts) and with the US Treasury Bonds (-2,194 contracts) also registering lower bets on the week.
Speculators slash their bearish 5-Year Bond bets by most on record
The 5-Year Bond this week highlights the weekly speculator changes for the Bonds markets. The 5-Year Bonds speculator positions rose this week by 325,016 weekly net contracts and have now risen for three consecutive weeks. The 5-Year Bond speculator bets have been improving and have been positive in 9 out of the past 12 weeks with a gain of +954,361 net contracts over these past 12 weeks. This week’s rise by 325,016 weekly net contracts represents the highest 1-week change on record for speculator bets, according to CFTC data going back to the late 1980s.
The 5-Year Bond speculator positions, like most of the other major Bond positions, have been consistently bearish in recent years (the last time there has been multiple weeks of bullish positions for the 5-Year was in 2021). The 5-Year Bond hit an all-time low in speculator positions in September at a position of -2,463,971 net contracts. However, since that all-time low position, there has been an improvement in the 5-Year Bond speculator position, and this week the overall position comes in at -1,448,436 net contracts.
Bond market price performance was mostly unchanged on the week
The Bonds markets were modestly changed over the past five days, with the Two-Year Bond seeing a slight uptick by 0.10%, while the One-Month Secured Overnight Financing Rate (SOFR) was just a tick higher by 0.02%, and the Three-Month SOFR was higher by even less at an increase of 0.01%. The Fed Funds was relatively unchanged. The Five-Year Bond was slightly lower by -0.10%, while the Treasury Bonds were lower by -0.22%, and the Ten-Year Note was down by -0.30% on the week.
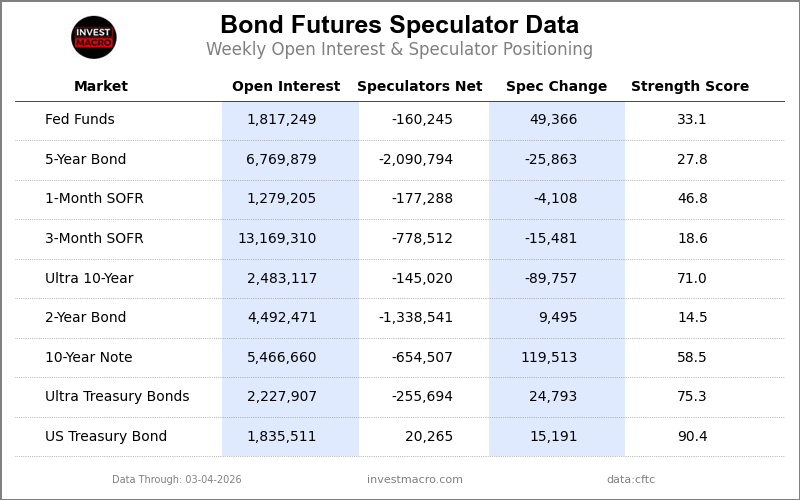
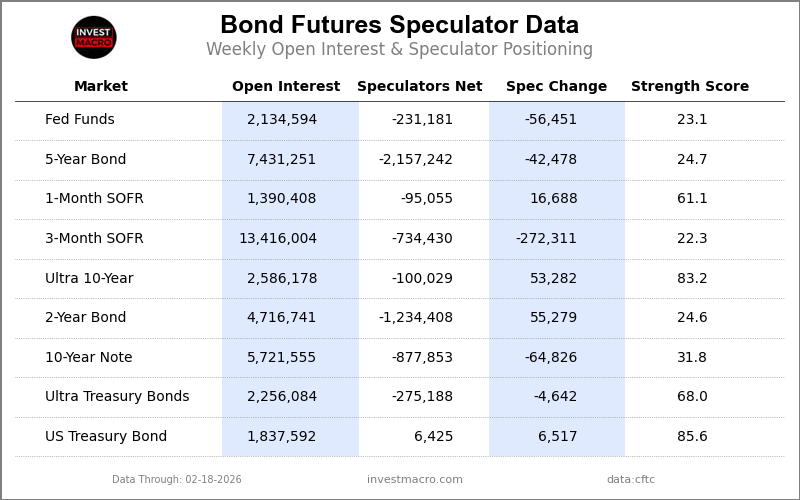
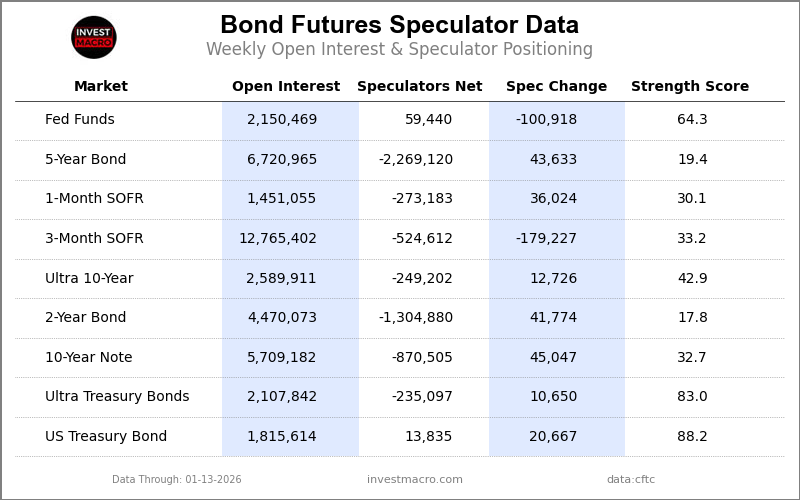
Bonds Data:

Legend: Open Interest | Speculators Current Net Position | Weekly Specs Change | Specs Strength Score compared to last 3-Years (0-100 range)
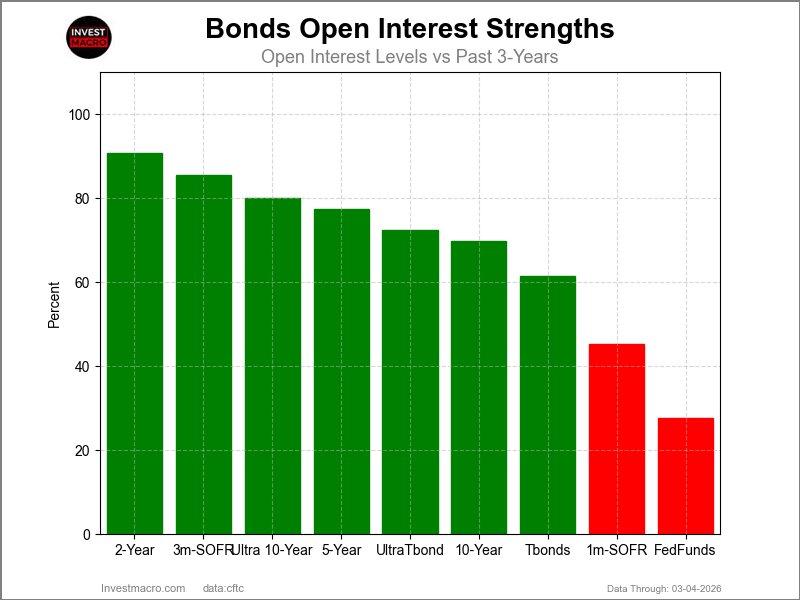
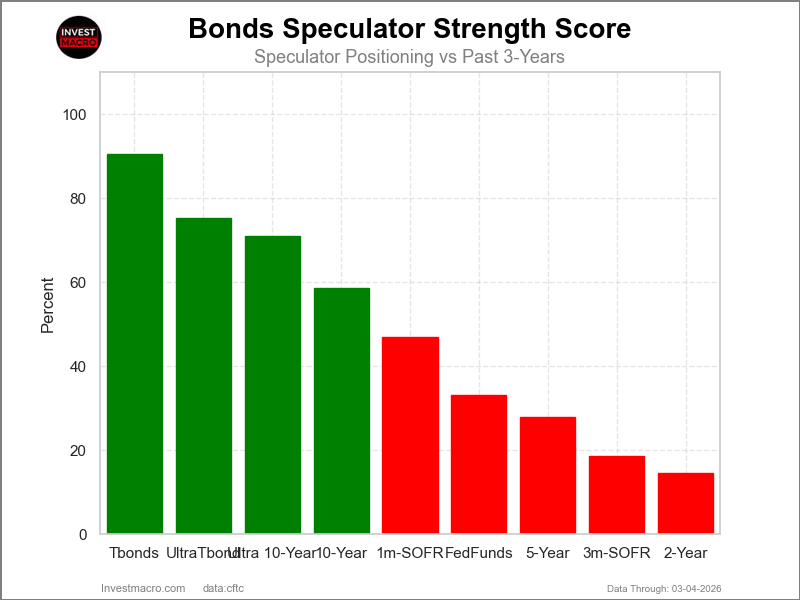
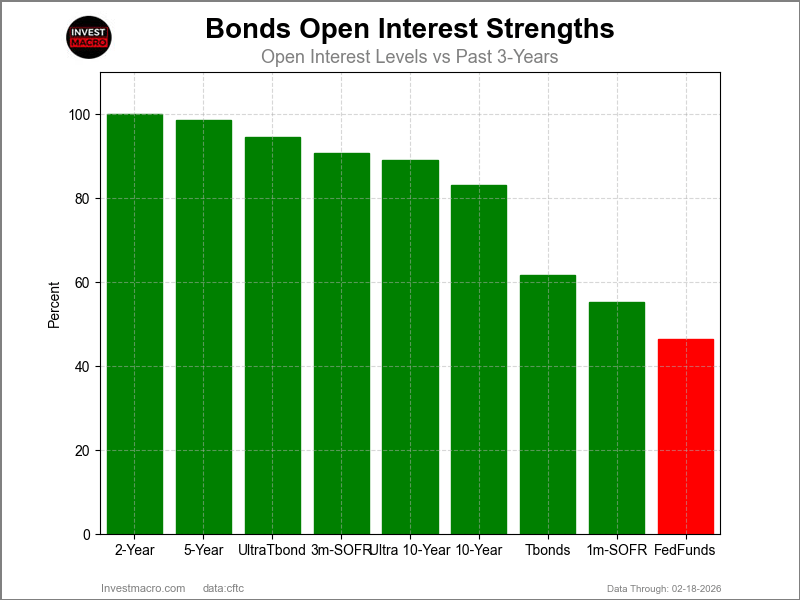
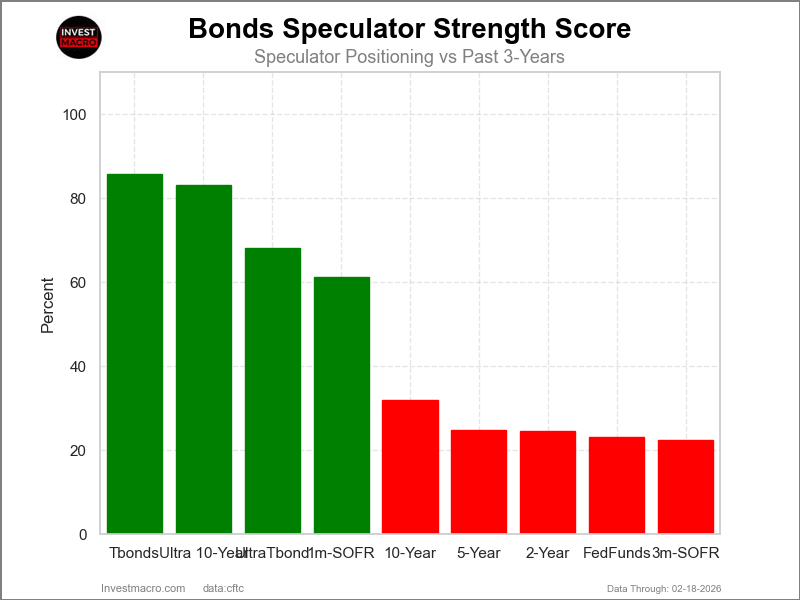
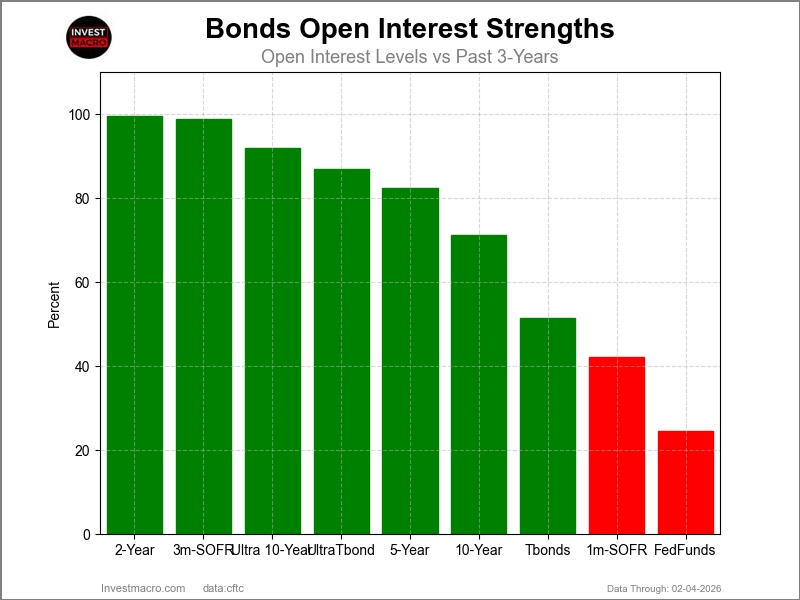
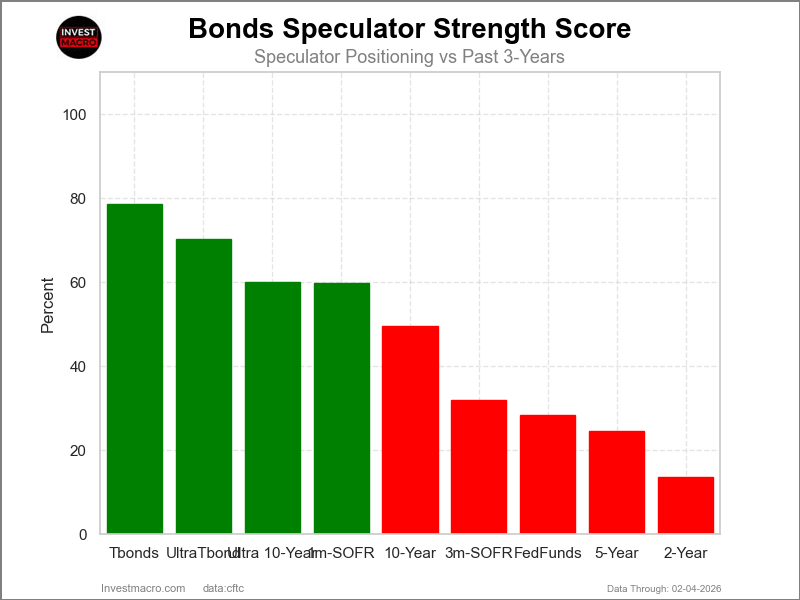
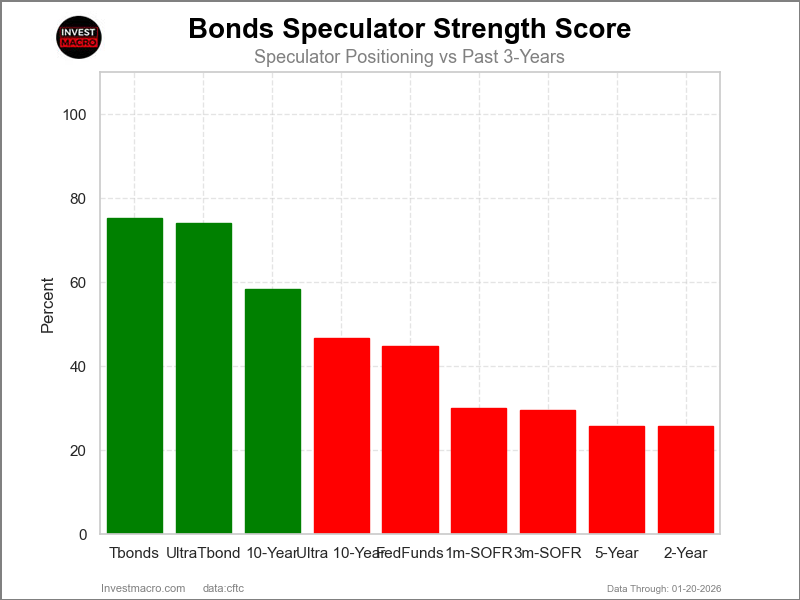
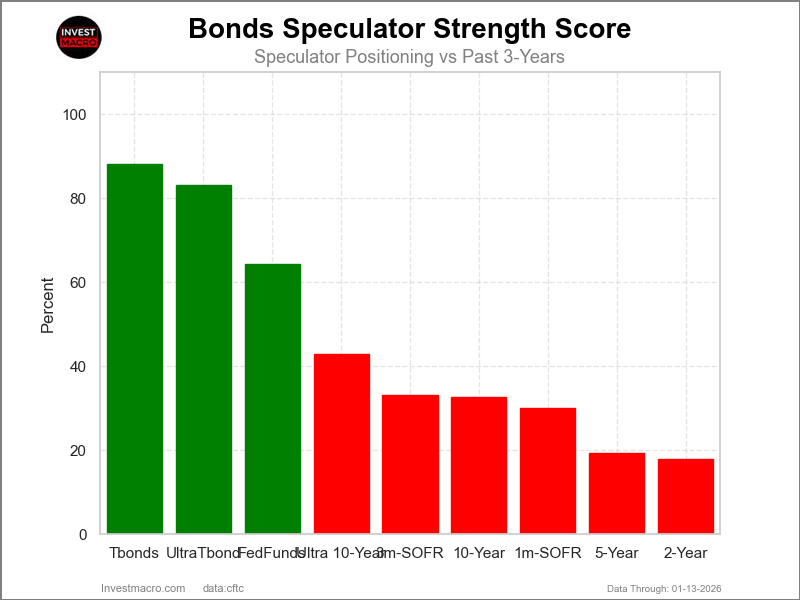
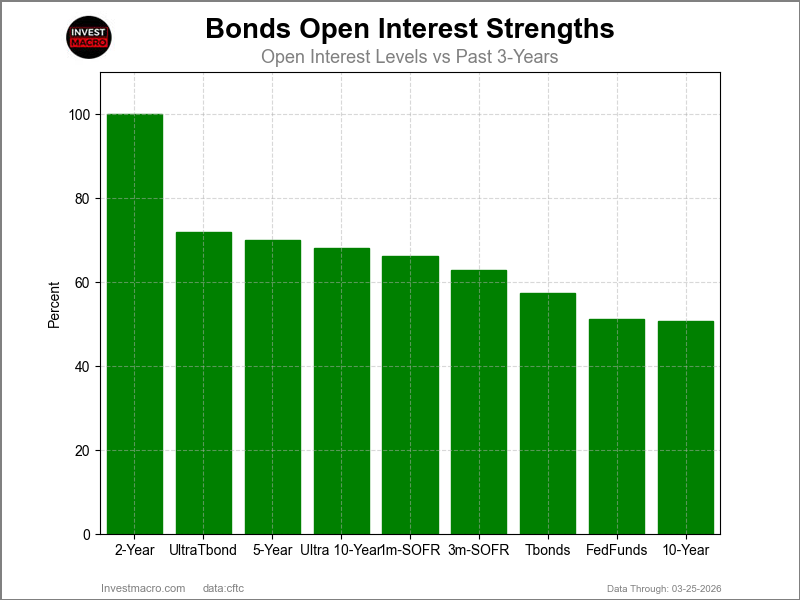
Strength Scores led by US Treasury Bonds & Ultra Treasury Bonds
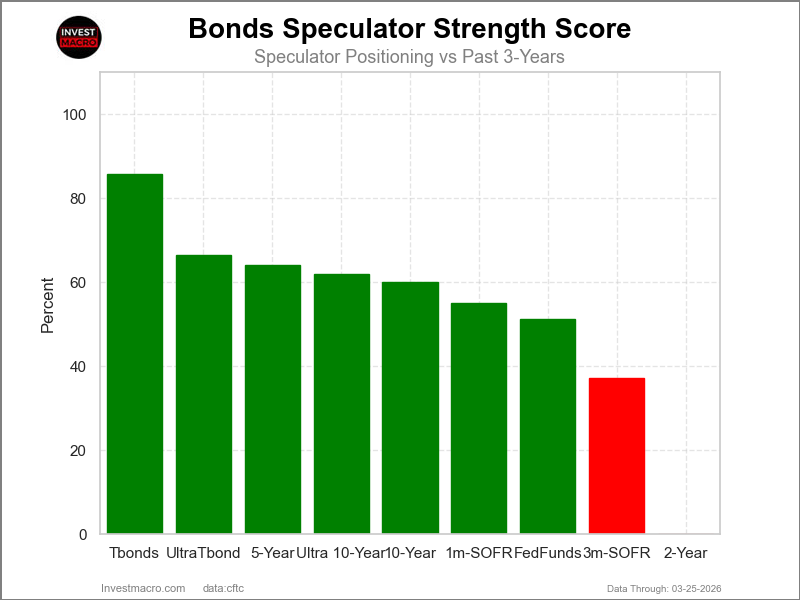
COT Strength Scores (a normalized measure of Speculator positions over a 3-Year range, from 0 to 100 where above 80 is Extreme-Bullish and below 20 is Extreme-Bearish) showed that the US Treasury Bonds (86 percent) and the Ultra Treasury Bonds (66 percent) lead the bond markets this week. The 5-Year Bonds (64 percent) comes in as the next highest in the weekly strength scores.
On the downside, the 2-Year Bond (0 percent) comes in at the lowest strength level currently and is in Extreme-Bearish territory (below 20 percent). The next lowest strength score was the SOFR 3-Months (37 percent).
Strength Statistics:
Fed Funds (51.3 percent) vs Fed Funds previous week (52.6 percent)
2-Year Bond (0.0 percent) vs 2-Year Bond previous week (13.6 percent)
5-Year Bond (64.0 percent) vs 5-Year Bond previous week (47.1 percent)
10-Year Bond (60.0 percent) vs 10-Year Bond previous week (65.3 percent)
Ultra 10-Year Bond (62.0 percent) vs Ultra 10-Year Bond previous week (54.6 percent)
US Treasury Bond (85.7 percent) vs US Treasury Bond previous week (86.4 percent)
Ultra US Treasury Bond (66.5 percent) vs Ultra US Treasury Bond previous week (69.5 percent)
SOFR 1-Month (54.9 percent) vs SOFR 1-Month previous week (44.7 percent)
SOFR 3-Months (37.2 percent) vs SOFR 3-Months previous week (30.1 percent)
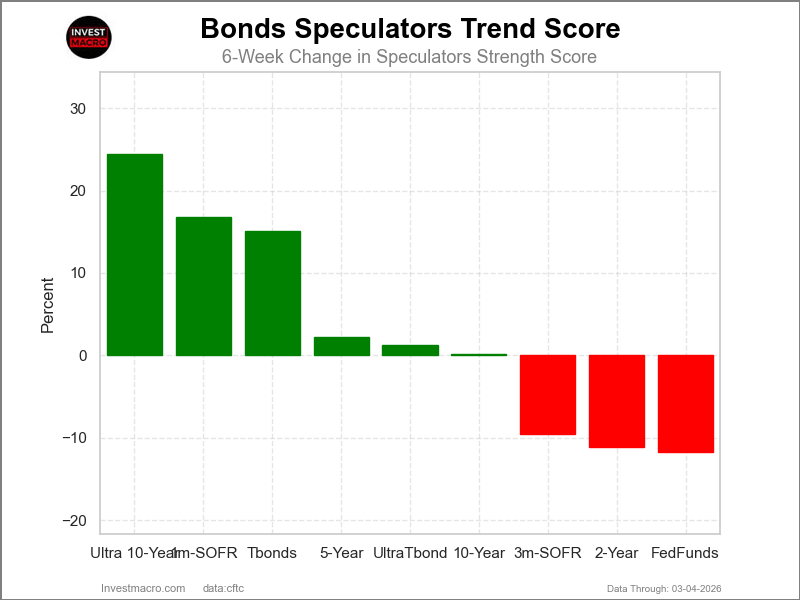
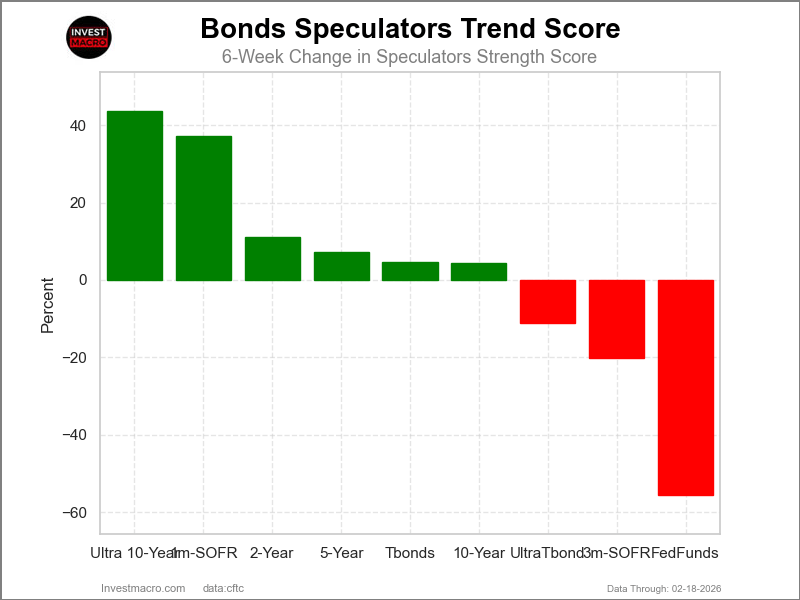
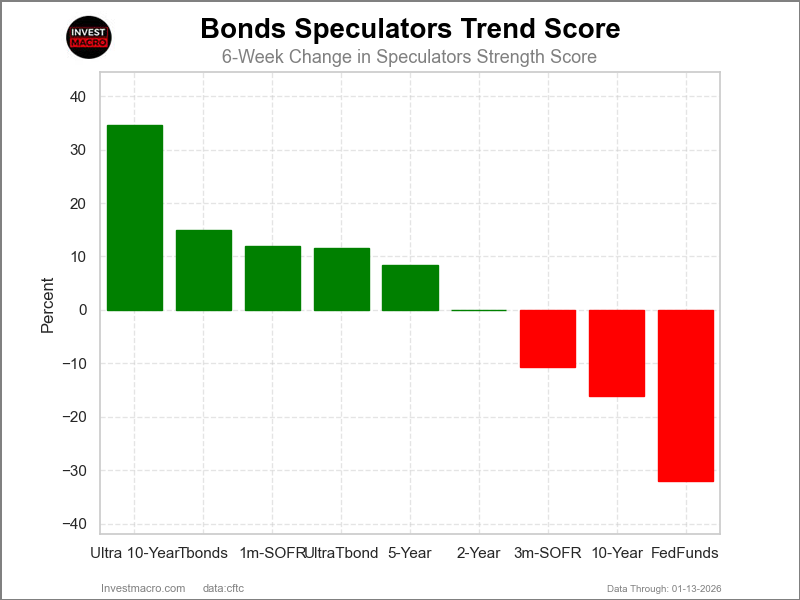
5-Year, 10-Year Bonds & Fed Funds top the 6-Week Strength Trends
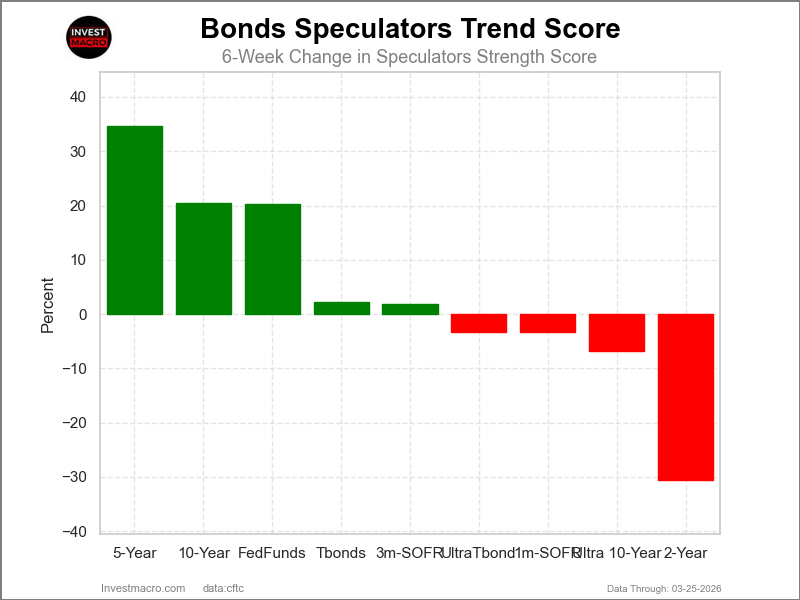
COT Strength Score Trends (or move index, calculates the 6-week changes in strength scores) showed that the 5-Year Bonds (35 percent), 10-Year Bonds (20 percent) and the Fed Funds (20 percent) lead the past six weeks trends for bonds.
The 2-Year Bond (-31 percent) leads the downside trend scores currently with the Ultra 10-Year Bonds (-7 percent) following next with lower trend scores.
Strength Trend Statistics:
Fed Funds (20.2 percent) vs Fed Funds previous week (24.3 percent)
2-Year Bond (-30.5 percent) vs 2-Year Bond previous week (-11.8 percent)
5-Year Bond (34.6 percent) vs 5-Year Bond previous week (20.0 percent)
10-Year Bond (20.5 percent) vs 10-Year Bond previous week (15.7 percent)
Ultra 10-Year Bond (-6.8 percent) vs Ultra 10-Year Bond previous week (-5.4 percent)
US Treasury Bond (2.3 percent) vs US Treasury Bond previous week (7.8 percent)
Ultra US Treasury Bond (-3.2 percent) vs Ultra US Treasury Bond previous week (-0.8 percent)
SOFR 1-Month (-3.3 percent) vs SOFR 1-Month previous week (-15.0 percent)
SOFR 3-Months (1.9 percent) vs SOFR 3-Months previous week (-0.7 percent)
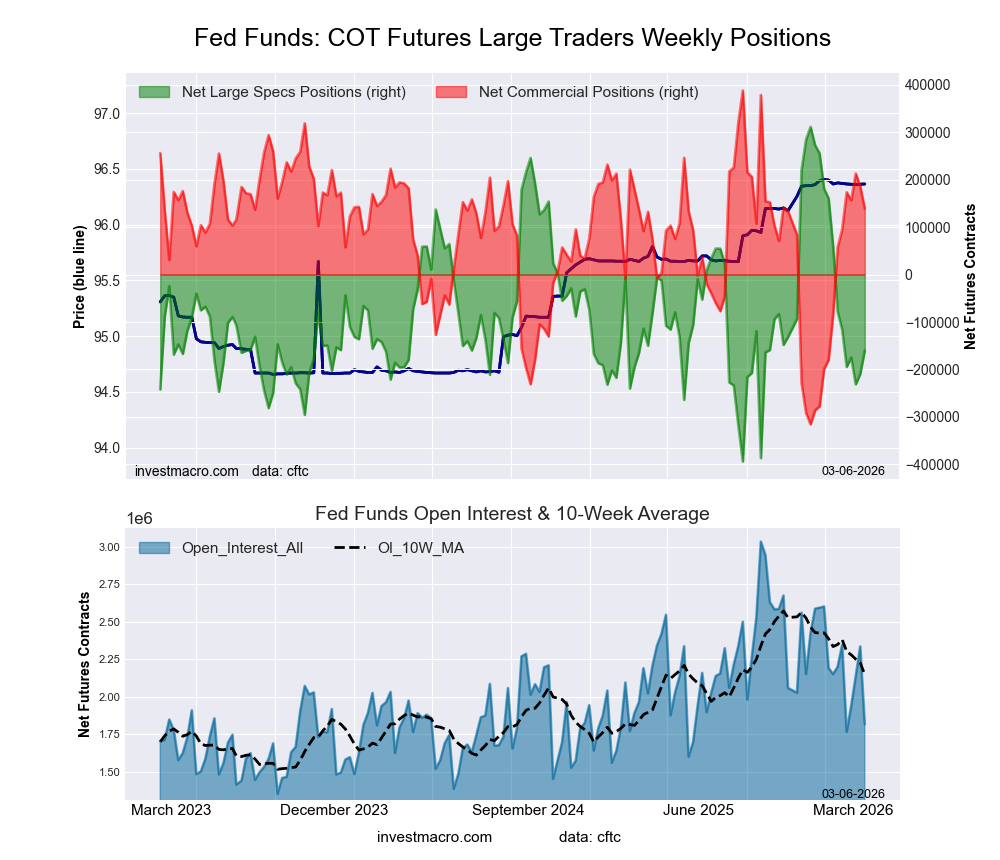
30-Day Federal Funds Futures:
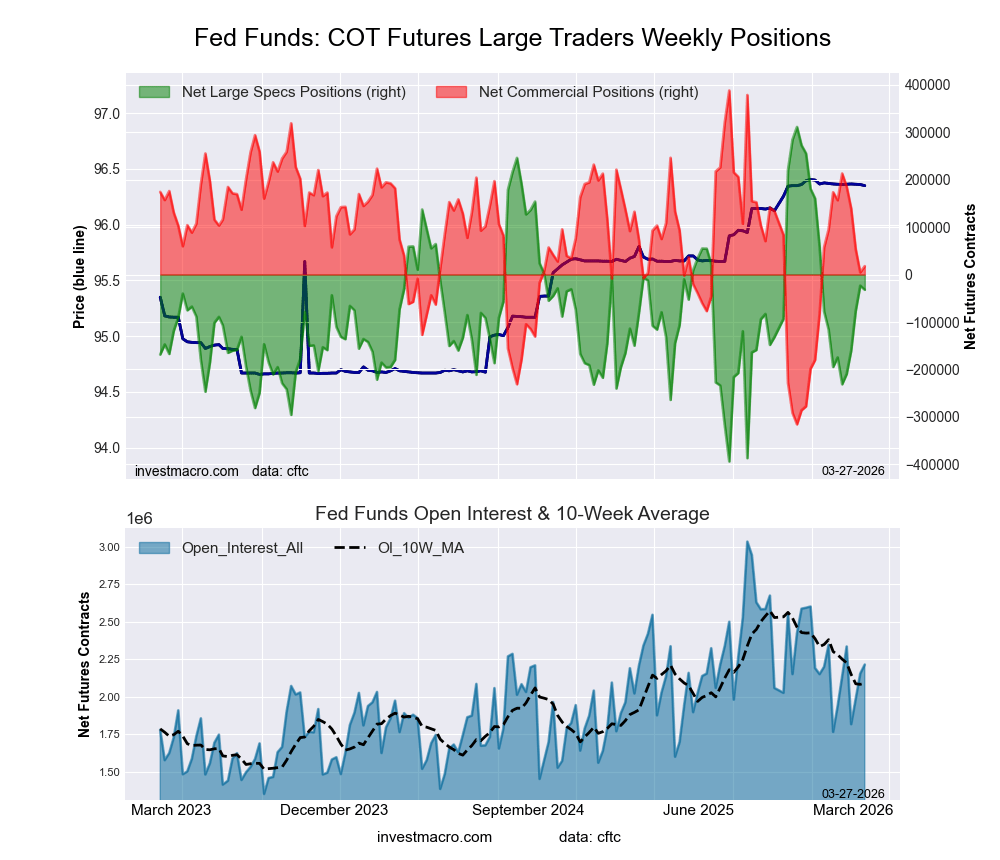 The 30-Day Federal Funds large speculator standing this week came in at a net position of -32,042 contracts in the data reported through Tuesday. This was a weekly reduction of -8,643 contracts from the previous week which had a total of -23,399 net contracts.
This week’s current strength score (the trader positioning range over the past three years, measured from 0 to 100) shows the speculators are currently Bullish with a score of 51.3 percent. The commercials are Bearish with a score of 47.4 percent and the small traders (not shown in chart) are Bullish with a score of 75.1 percent.
Price Trend-Following Model: Weak Uptrend
Our weekly trend-following model classifies the current market price position as: Weak Uptrend.
| 30-Day Federal Funds Statistics | SPECULATORS | COMMERCIALS | SMALL TRADERS |
| – Percent of Open Interest Longs: | 15.8 | 63.1 | 2.6 |
| – Percent of Open Interest Shorts: | 17.3 | 62.3 | 1.9 |
| – Net Position: | -32,042 | 17,698 | 14,344 |
| – Gross Longs: | 350,243 | 1,397,663 | 57,058 |
| – Gross Shorts: | 382,285 | 1,379,965 | 42,714 |
| – Long to Short Ratio: | 0.9 to 1 | 1.0 to 1 | 1.3 to 1 |
| NET POSITION TREND: | |||
| – Strength Index Score (3 Year Range Pct): | 51.3 | 47.4 | 75.1 |
| – Strength Index Reading (3 Year Range): | Bullish | Bearish | Bullish |
| NET POSITION MOVEMENT INDEX: | |||
| – 6-Week Change in Strength Index: | 20.2 | -19.7 | -6.6 |
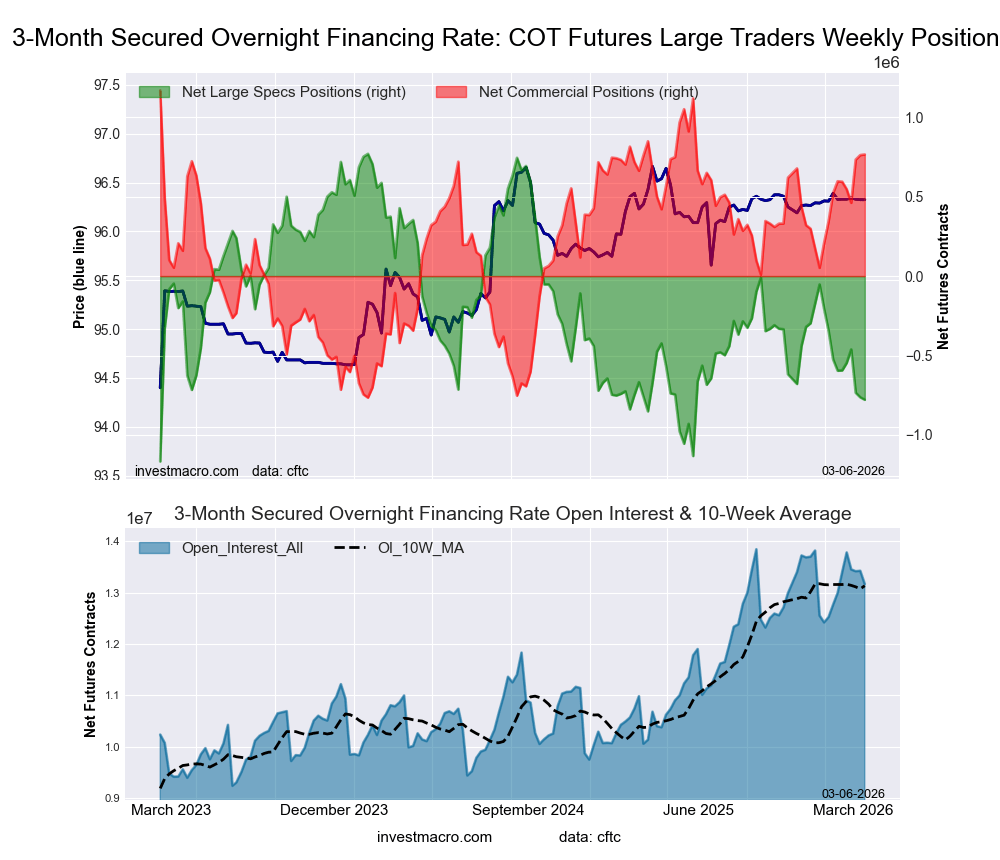
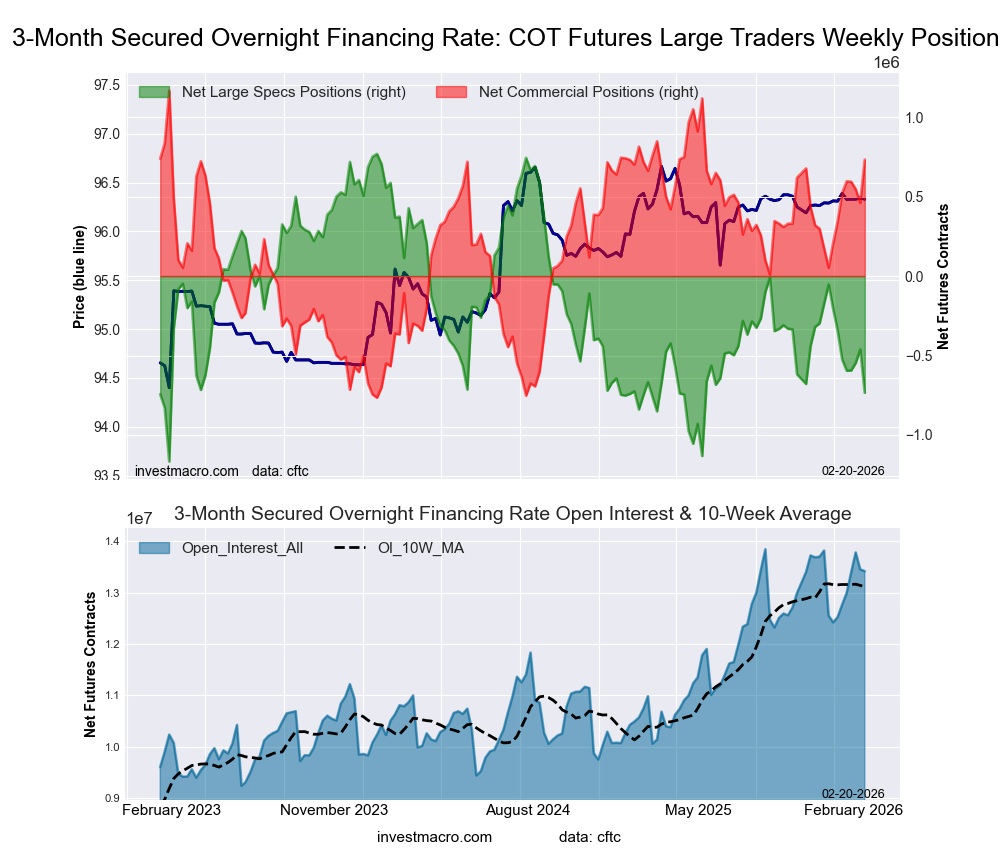
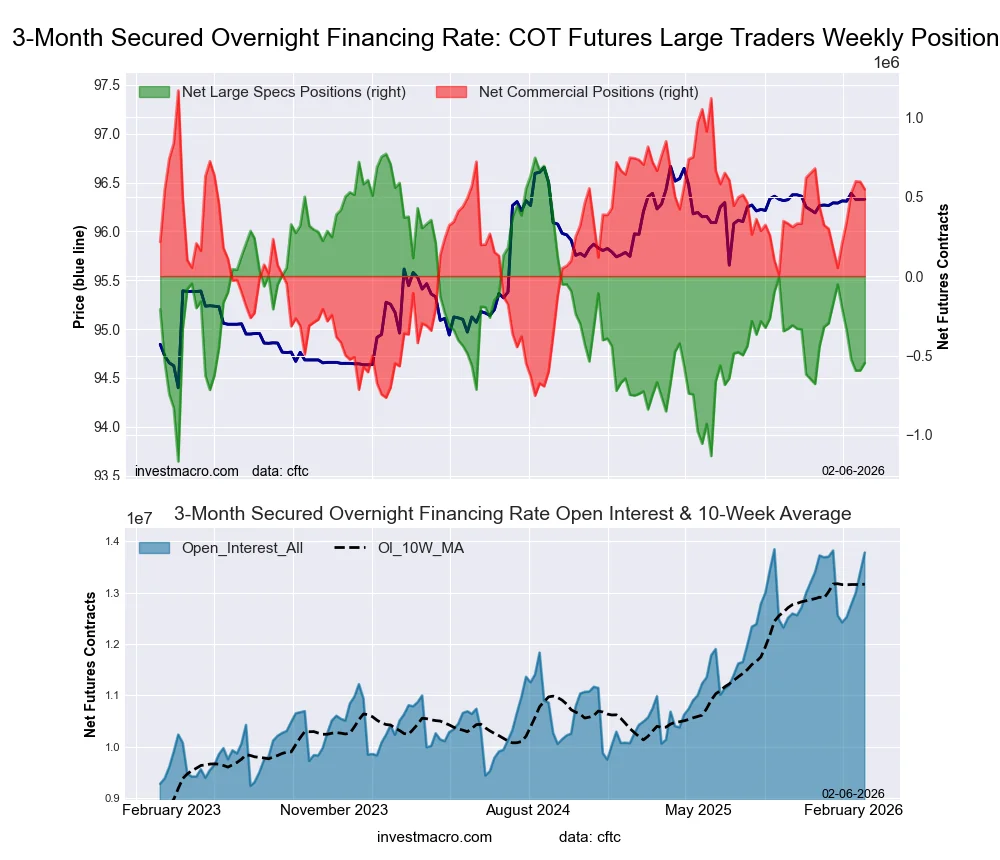
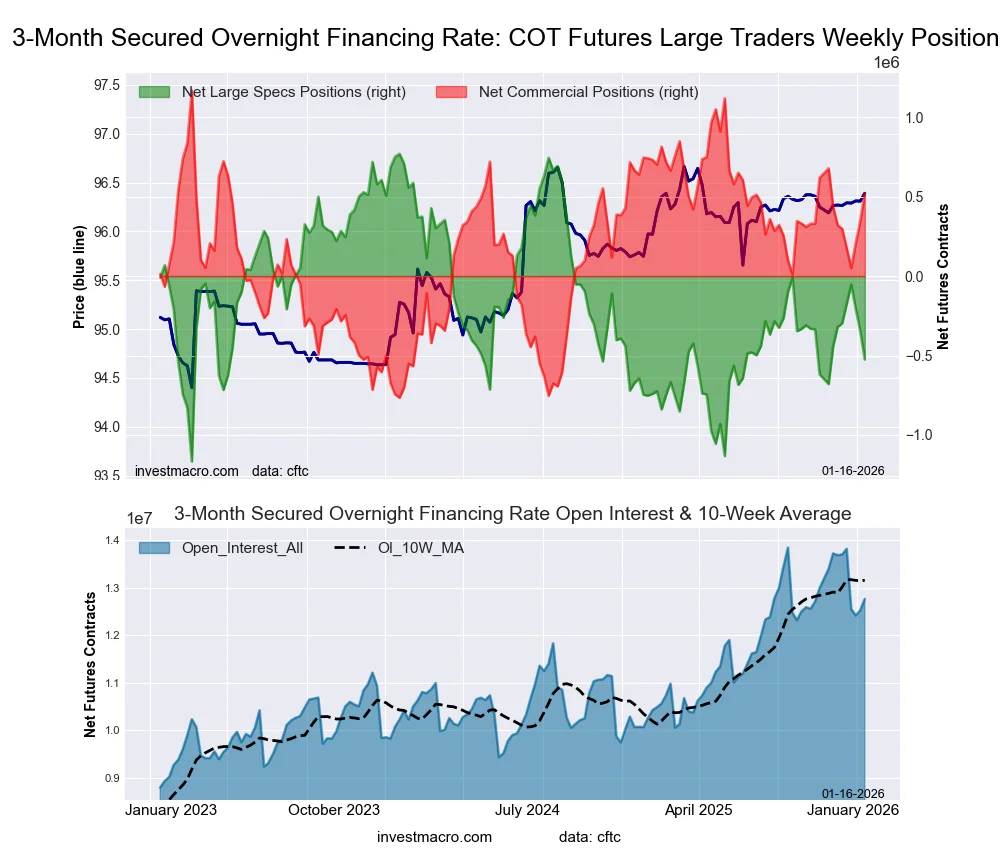
Secured Overnight Financing Rate (3-Month) Futures:
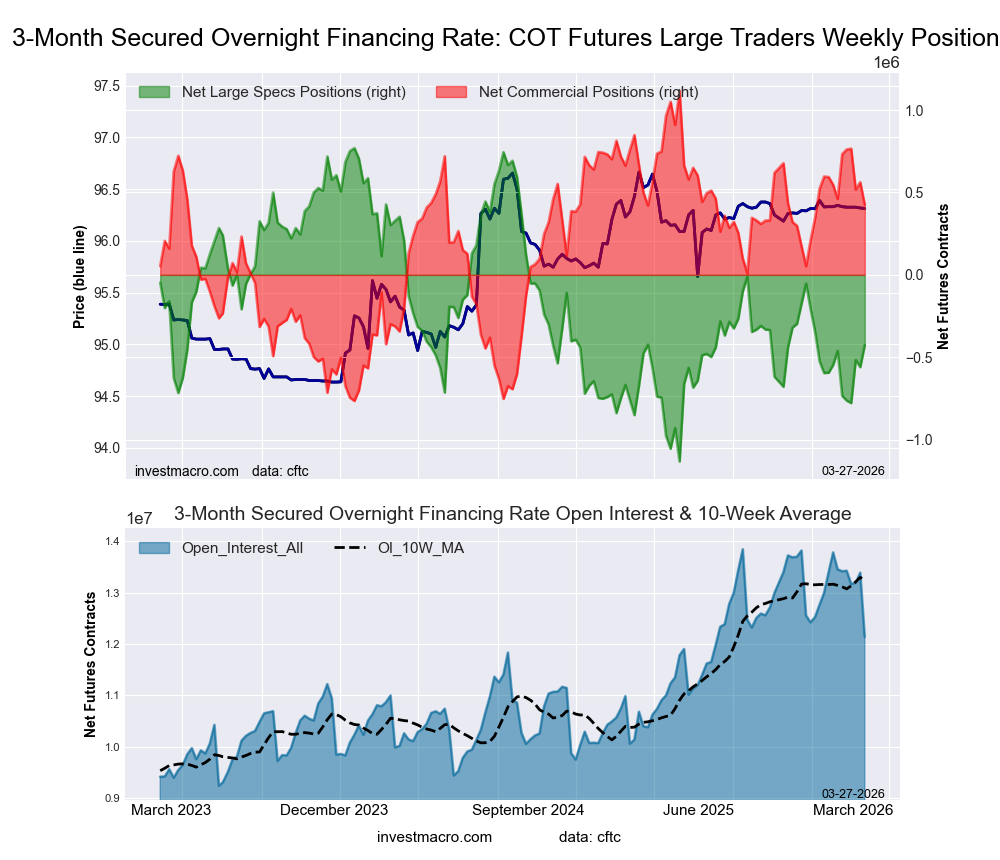 The Secured Overnight Financing Rate (3-Month) large speculator standing this week came in at a net position of -425,910 contracts in the data reported through Tuesday. This was a weekly rise of 134,015 contracts from the previous week which had a total of -559,925 net contracts.
This week’s current strength score (the trader positioning range over the past three years, measured from 0 to 100) shows the speculators are currently Bearish with a score of 37.2 percent. The commercials are Bullish with a score of 63.1 percent and the small traders (not shown in chart) are Bearish with a score of 42.3 percent.
Price Trend-Following Model: Weak Uptrend
Our weekly trend-following model classifies the current market price position as: Weak Uptrend.
| SOFR 3-Months Statistics | SPECULATORS | COMMERCIALS | SMALL TRADERS |
| – Percent of Open Interest Longs: | 15.4 | 57.4 | 0.2 |
| – Percent of Open Interest Shorts: | 18.9 | 53.9 | 0.1 |
| – Net Position: | -425,910 | 424,393 | 1,517 |
| – Gross Longs: | 1,864,974 | 6,971,504 | 19,178 |
| – Gross Shorts: | 2,290,884 | 6,547,111 | 17,661 |
| – Long to Short Ratio: | 0.8 to 1 | 1.1 to 1 | 1.1 to 1 |
| NET POSITION TREND: | |||
| – Strength Index Score (3 Year Range Pct): | 37.2 | 63.1 | 42.3 |
| – Strength Index Reading (3 Year Range): | Bearish | Bullish | Bearish |
| NET POSITION MOVEMENT INDEX: | |||
| – 6-Week Change in Strength Index: | 1.9 | -1.9 | 0.6 |
Individual Bond Markets:
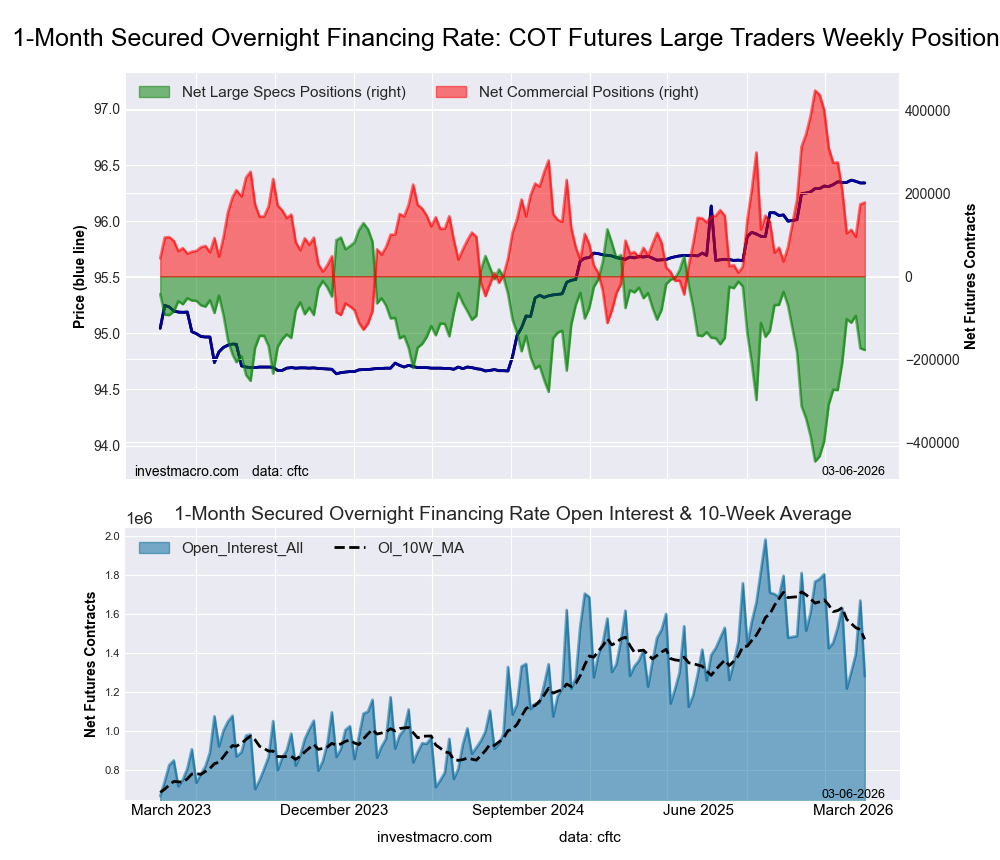
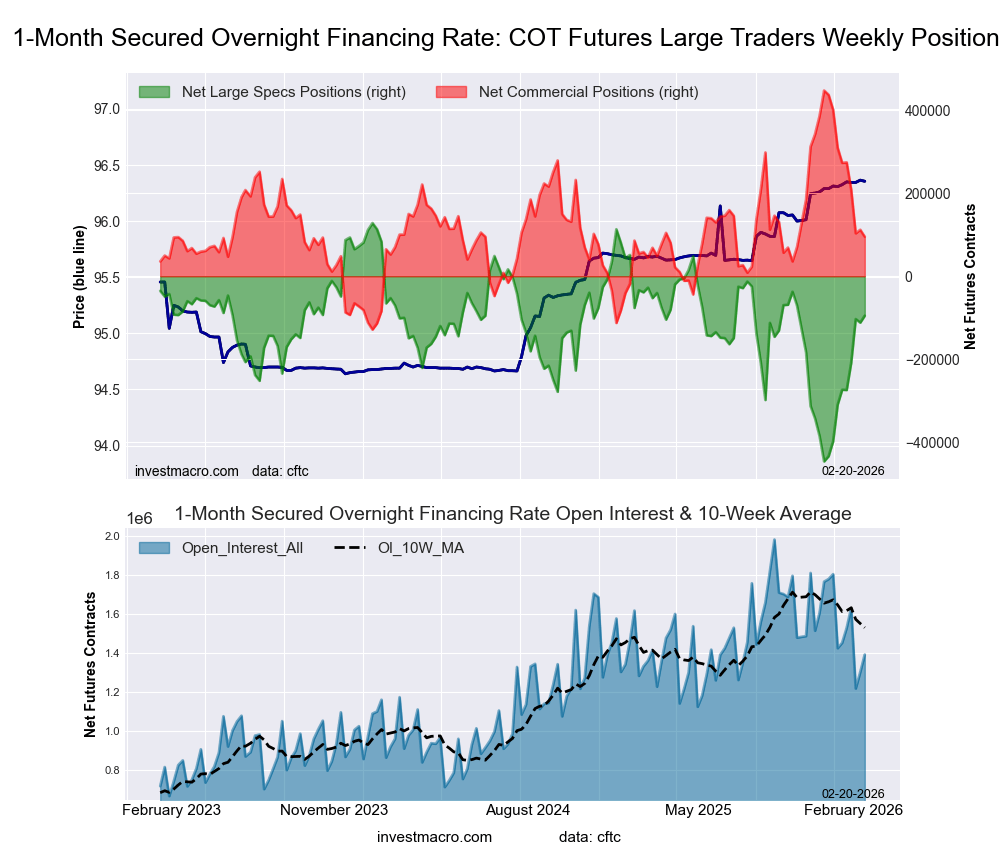
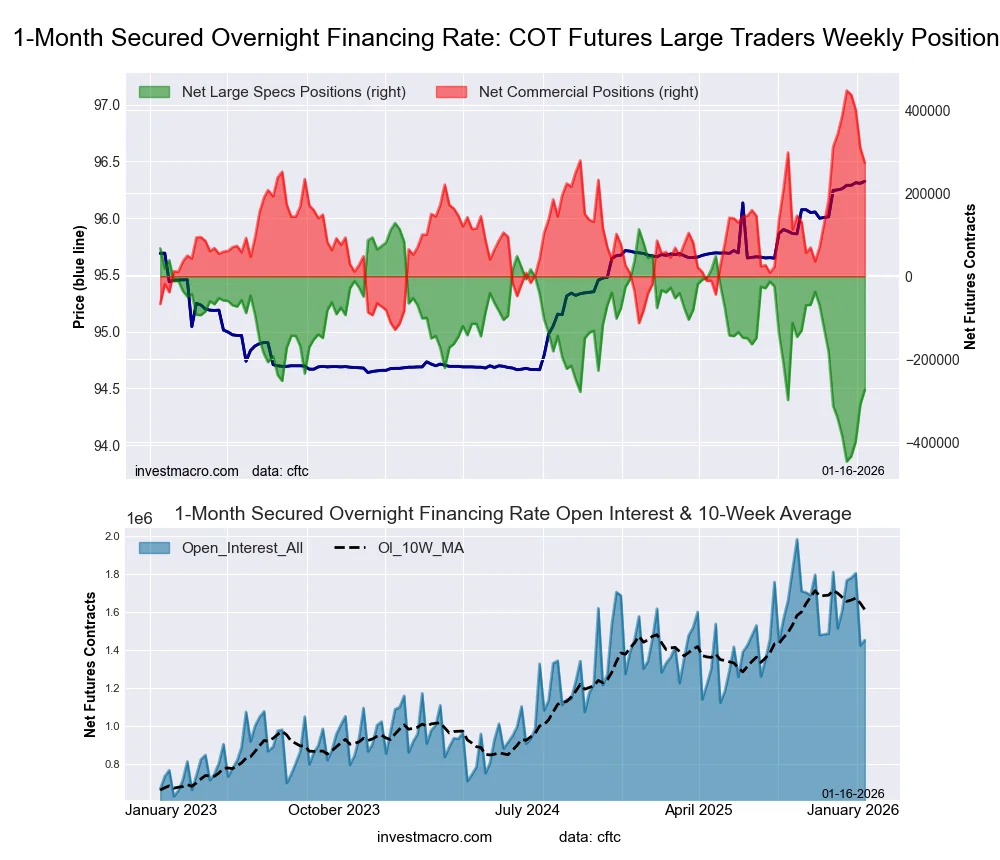
Secured Overnight Financing Rate (1-Month) Futures:
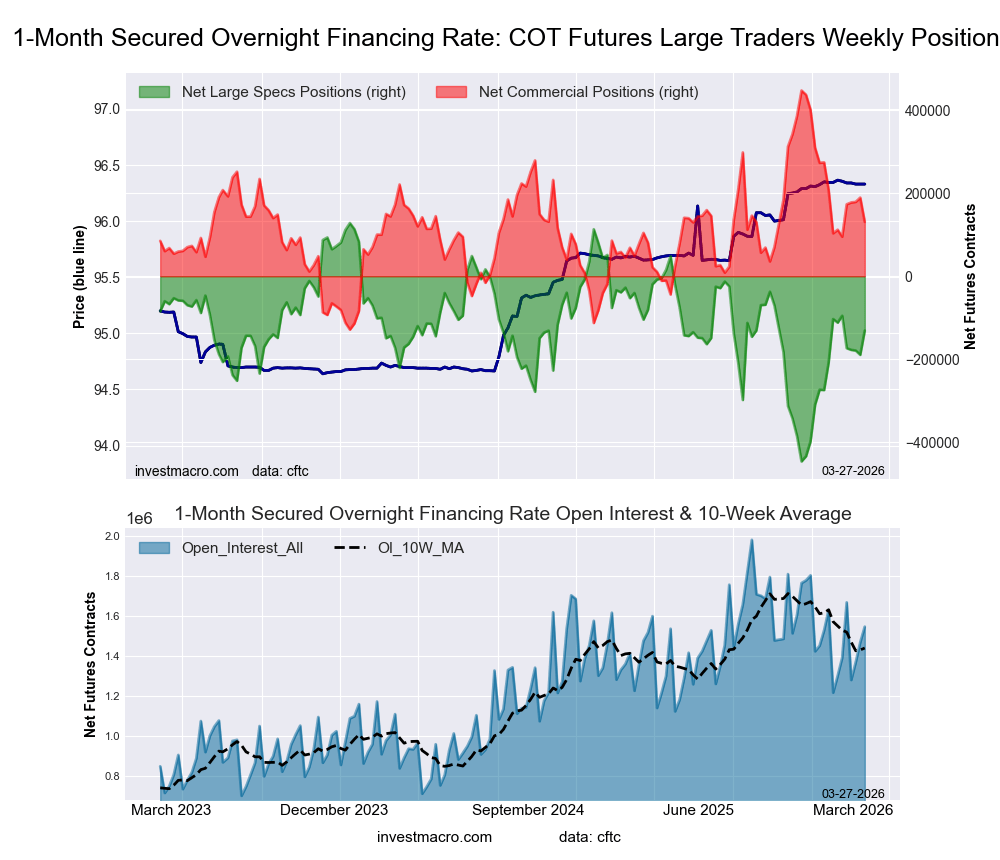 The Secured Overnight Financing Rate (1-Month) large speculator standing this week came in at a net position of -130,667 contracts in the data reported through Tuesday. This was a weekly boost of 58,570 contracts from the previous week which had a total of -189,237 net contracts.
This week’s current strength score (the trader positioning range over the past three years, measured from 0 to 100) shows the speculators are currently Bullish with a score of 54.9 percent. The commercials are Bearish with a score of 45.1 percent and the small traders (not shown in chart) are Bullish with a score of 66.7 percent.
Price Trend-Following Model: Weak Uptrend
Our weekly trend-following model classifies the current market price position as: Weak Uptrend.
| SOFR 1-Month Statistics | SPECULATORS | COMMERCIALS | SMALL TRADERS |
| – Percent of Open Interest Longs: | 21.2 | 58.8 | 1.2 |
| – Percent of Open Interest Shorts: | 29.7 | 50.3 | 1.2 |
| – Net Position: | -130,667 | 130,758 | -91 |
| – Gross Longs: | 327,967 | 909,195 | 18,922 |
| – Gross Shorts: | 458,634 | 778,437 | 19,013 |
| – Long to Short Ratio: | 0.7 to 1 | 1.2 to 1 | 1.0 to 1 |
| NET POSITION TREND: | |||
| – Strength Index Score (3 Year Range Pct): | 54.9 | 45.1 | 66.7 |
| – Strength Index Reading (3 Year Range): | Bullish | Bearish | Bullish |
| NET POSITION MOVEMENT INDEX: | |||
| – 6-Week Change in Strength Index: | -3.3 | 3.3 | -0.0 |
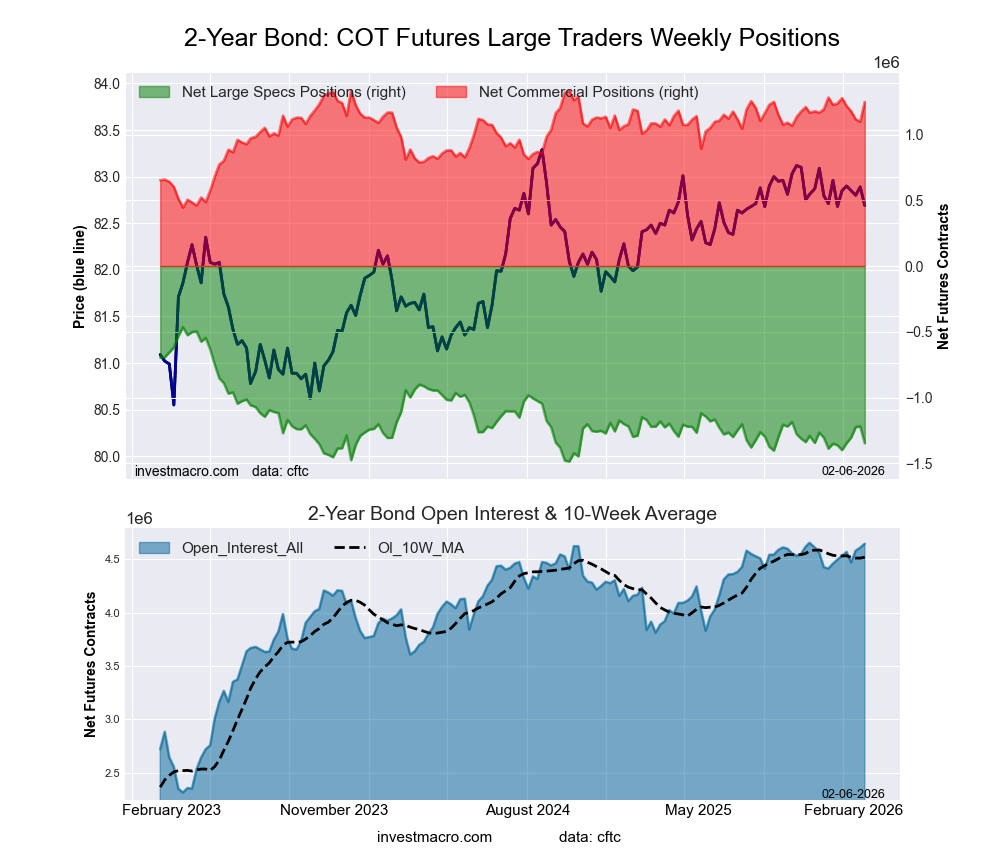
2-Year Treasury Note Futures:
 The 2-Year Treasury Note large speculator standing this week came in at a net position of -1,638,179 contracts in the data reported through Tuesday. This was a weekly decrease of -155,512 contracts from the previous week which had a total of -1,482,667 net contracts.
This week’s current strength score (the trader positioning range over the past three years, measured from 0 to 100) shows the speculators are currently Bearish-Extreme with a score of 0.0 percent. The commercials are Bullish-Extreme with a score of 100.0 percent and the small traders (not shown in chart) are Bearish with a score of 30.2 percent.
Price Trend-Following Model: Strong Downtrend
Our weekly trend-following model classifies the current market price position as: Strong Downtrend.
| 2-Year Treasury Note Statistics | SPECULATORS | COMMERCIALS | SMALL TRADERS |
| – Percent of Open Interest Longs: | 12.0 | 80.2 | 4.5 |
| – Percent of Open Interest Shorts: | 46.3 | 47.6 | 2.8 |
| – Net Position: | -1,638,179 | 1,555,767 | 82,412 |
| – Gross Longs: | 572,897 | 3,825,356 | 213,847 |
| – Gross Shorts: | 2,211,076 | 2,269,589 | 131,435 |
| – Long to Short Ratio: | 0.3 to 1 | 1.7 to 1 | 1.6 to 1 |
| NET POSITION TREND: | |||
| – Strength Index Score (3 Year Range Pct): | 0.0 | 100.0 | 30.2 |
| – Strength Index Reading (3 Year Range): | Bearish-Extreme | Bullish-Extreme | Bearish |
| NET POSITION MOVEMENT INDEX: | |||
| – 6-Week Change in Strength Index: | -30.5 | 34.5 | -13.9 |
5-Year Treasury Note Futures:
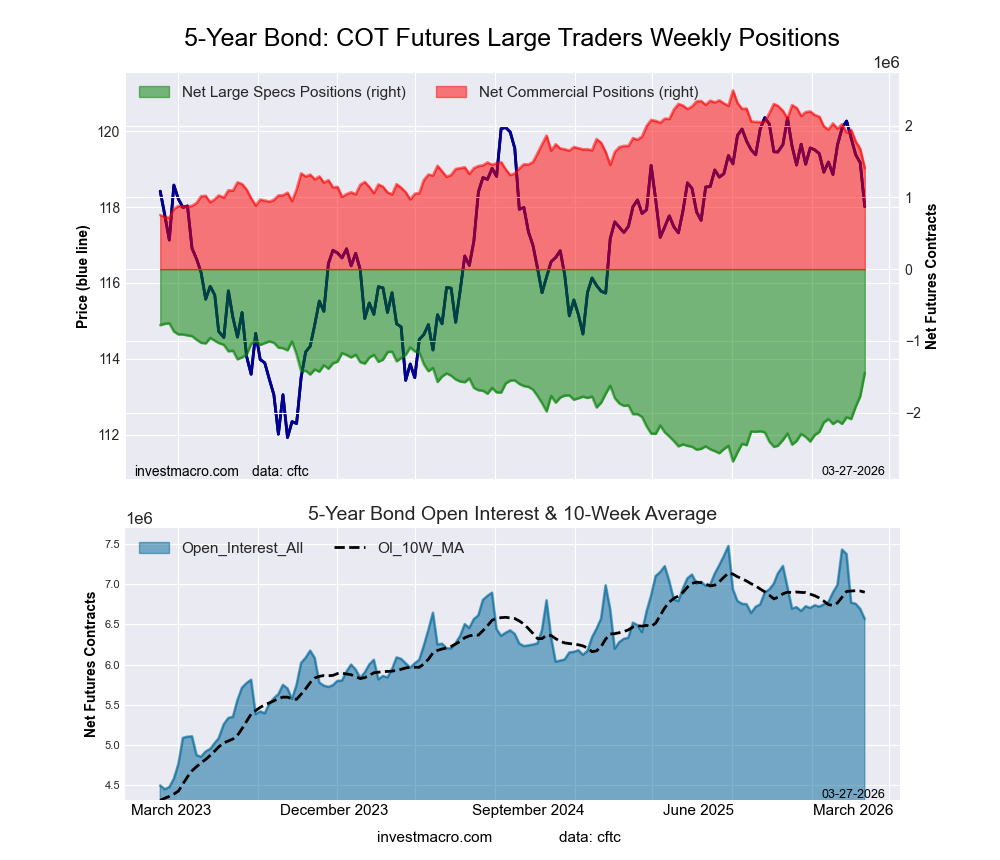 The 5-Year Treasury Note large speculator standing this week came in at a net position of -1,448,436 contracts in the data reported through Tuesday. This was a weekly boost of 325,016 contracts from the previous week which had a total of -1,773,452 net contracts.
This week’s current strength score (the trader positioning range over the past three years, measured from 0 to 100) shows the speculators are currently Bullish with a score of 64.0 percent. The commercials are Bearish with a score of 39.1 percent and the small traders (not shown in chart) are Bearish-Extreme with a score of 14.5 percent.
Price Trend-Following Model: Strong Downtrend
Our weekly trend-following model classifies the current market price position as: Strong Downtrend.
| 5-Year Treasury Note Statistics | SPECULATORS | COMMERCIALS | SMALL TRADERS |
| – Percent of Open Interest Longs: | 11.0 | 79.8 | 6.1 |
| – Percent of Open Interest Shorts: | 33.1 | 58.4 | 5.5 |
| – Net Position: | -1,448,436 | 1,409,435 | 39,001 |
| – Gross Longs: | 722,744 | 5,244,682 | 401,263 |
| – Gross Shorts: | 2,171,180 | 3,835,247 | 362,262 |
| – Long to Short Ratio: | 0.3 to 1 | 1.4 to 1 | 1.1 to 1 |
| NET POSITION TREND: | |||
| – Strength Index Score (3 Year Range Pct): | 64.0 | 39.1 | 14.5 |
| – Strength Index Reading (3 Year Range): | Bullish | Bearish | Bearish-Extreme |
| NET POSITION MOVEMENT INDEX: | |||
| – 6-Week Change in Strength Index: | 34.6 | -30.8 | -48.2 |
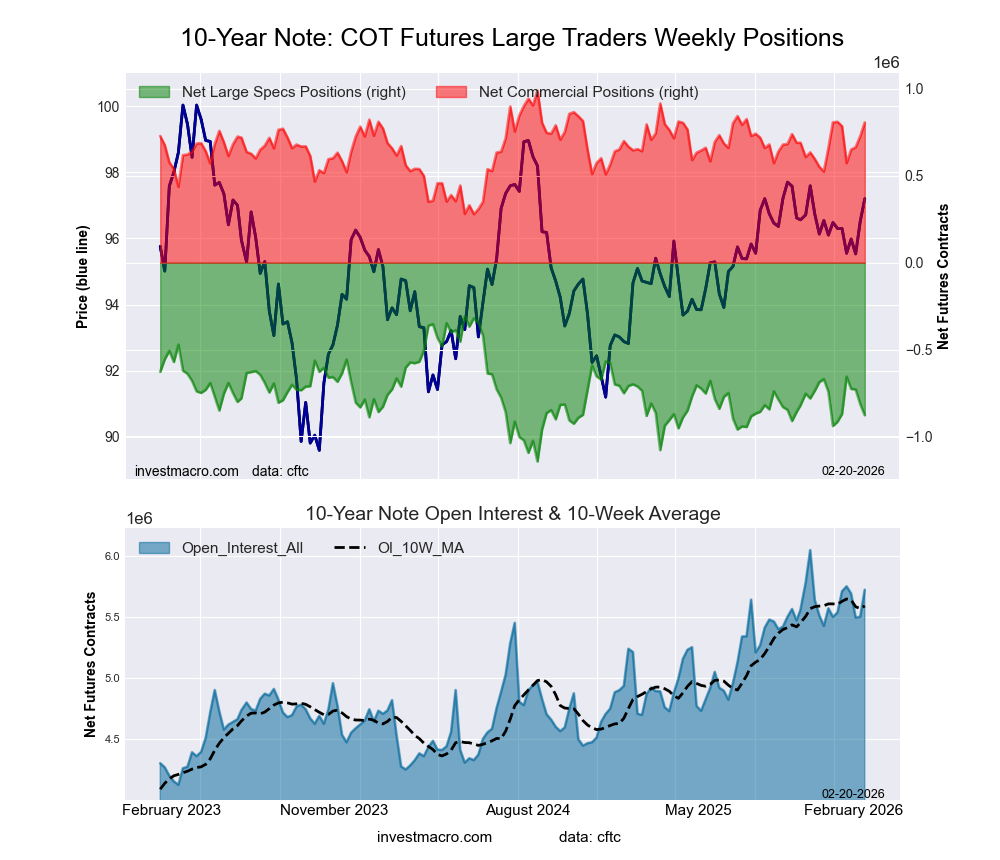
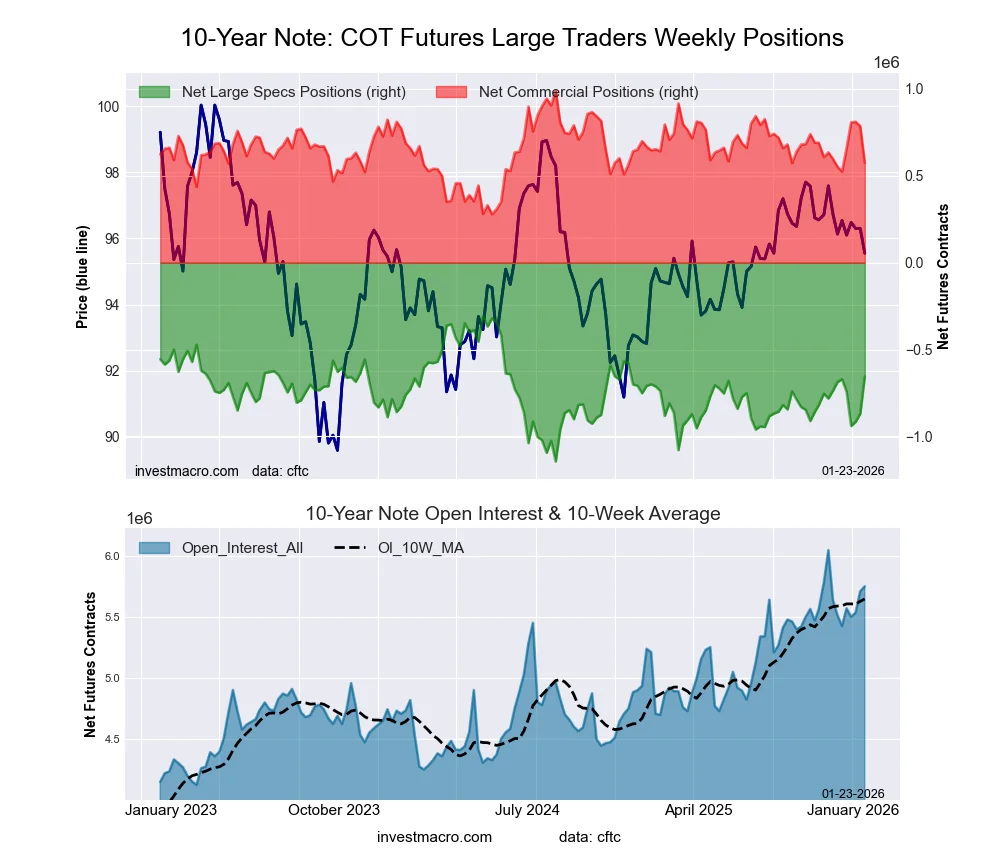
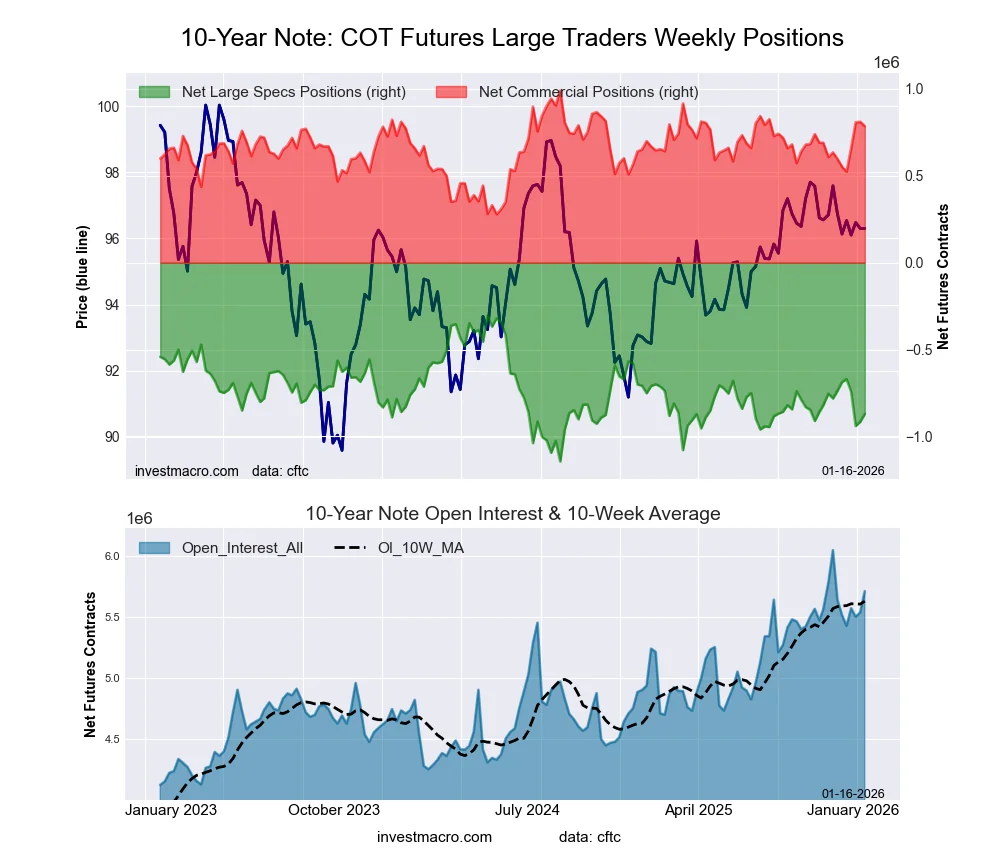
10-Year Treasury Note Futures:
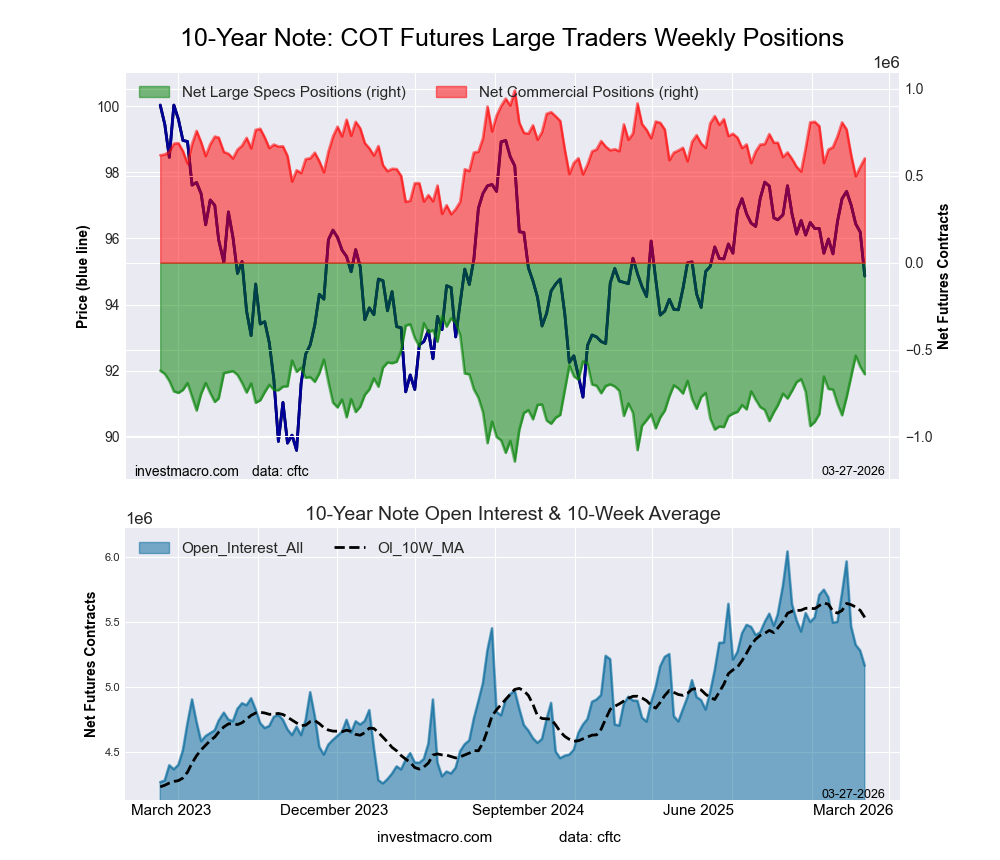 The 10-Year Treasury Note large speculator standing this week came in at a net position of -641,887 contracts in the data reported through Tuesday. This was a weekly fall of -44,009 contracts from the previous week which had a total of -597,878 net contracts.
This week’s current strength score (the trader positioning range over the past three years, measured from 0 to 100) shows the speculators are currently Bullish with a score of 60.0 percent. The commercials are Bearish with a score of 45.1 percent and the small traders (not shown in chart) are Bearish with a score of 32.4 percent.
Price Trend-Following Model: Strong Downtrend
Our weekly trend-following model classifies the current market price position as: Strong Downtrend.
| 10-Year Treasury Note Statistics | SPECULATORS | COMMERCIALS | SMALL TRADERS |
| – Percent of Open Interest Longs: | 14.6 | 74.8 | 7.8 |
| – Percent of Open Interest Shorts: | 27.1 | 63.2 | 7.0 |
| – Net Position: | -641,887 | 600,134 | 41,753 |
| – Gross Longs: | 755,844 | 3,863,211 | 404,699 |
| – Gross Shorts: | 1,397,731 | 3,263,077 | 362,946 |
| – Long to Short Ratio: | 0.5 to 1 | 1.2 to 1 | 1.1 to 1 |
| NET POSITION TREND: | |||
| – Strength Index Score (3 Year Range Pct): | 60.0 | 45.1 | 32.4 |
| – Strength Index Reading (3 Year Range): | Bullish | Bearish | Bearish |
| NET POSITION MOVEMENT INDEX: | |||
| – 6-Week Change in Strength Index: | 20.5 | -17.9 | -21.6 |
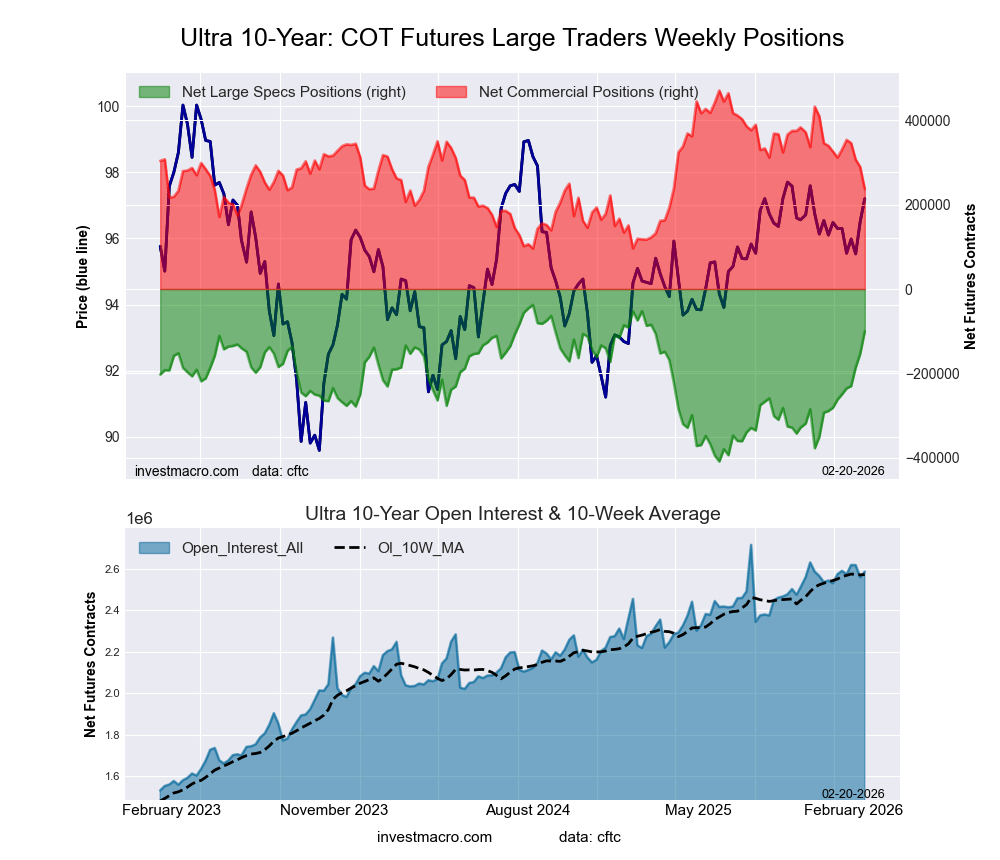
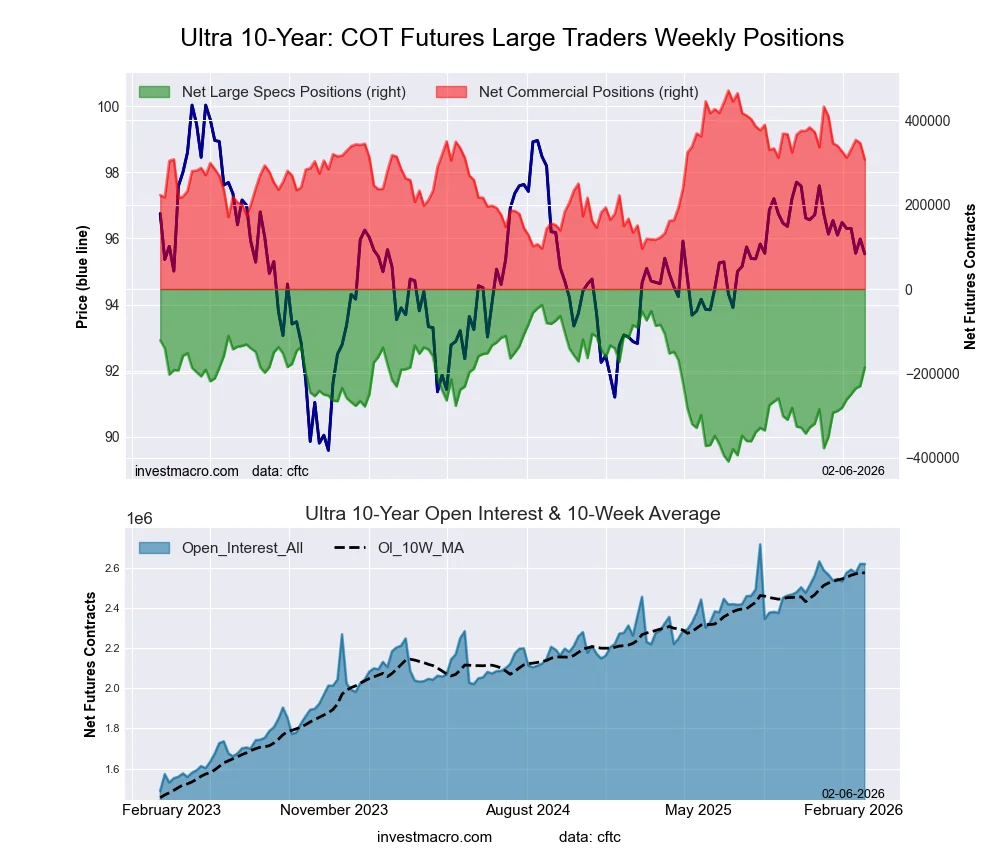
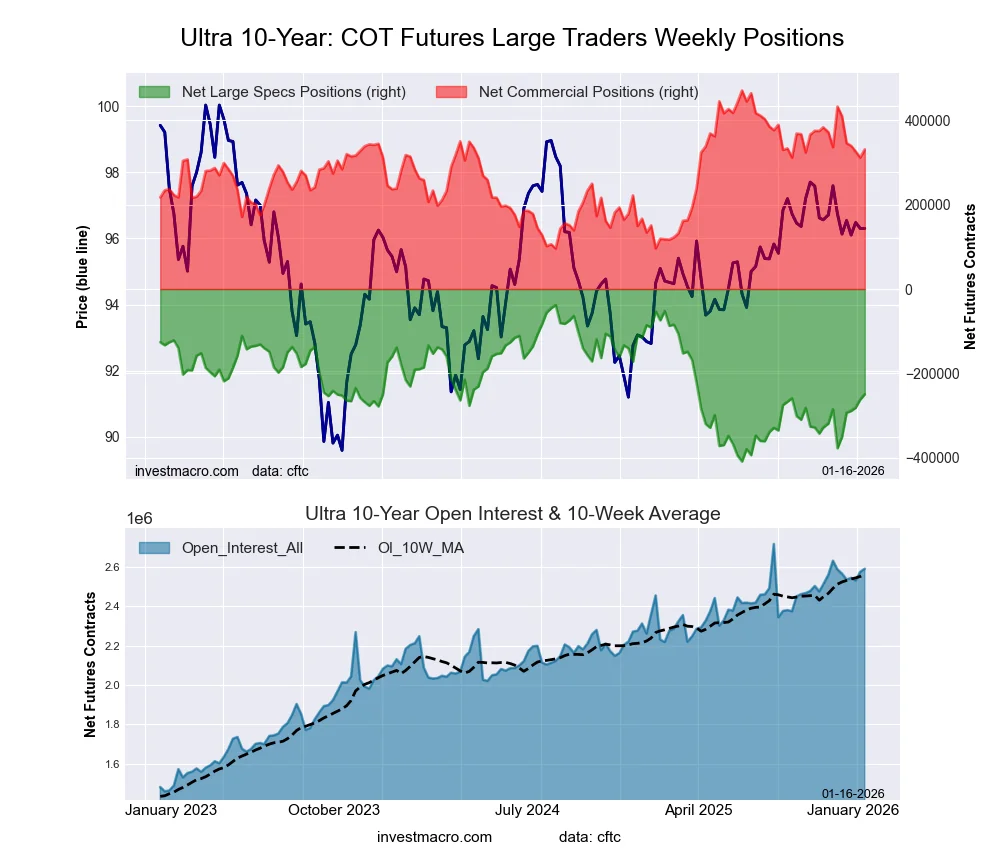
Ultra 10-Year Notes Futures:
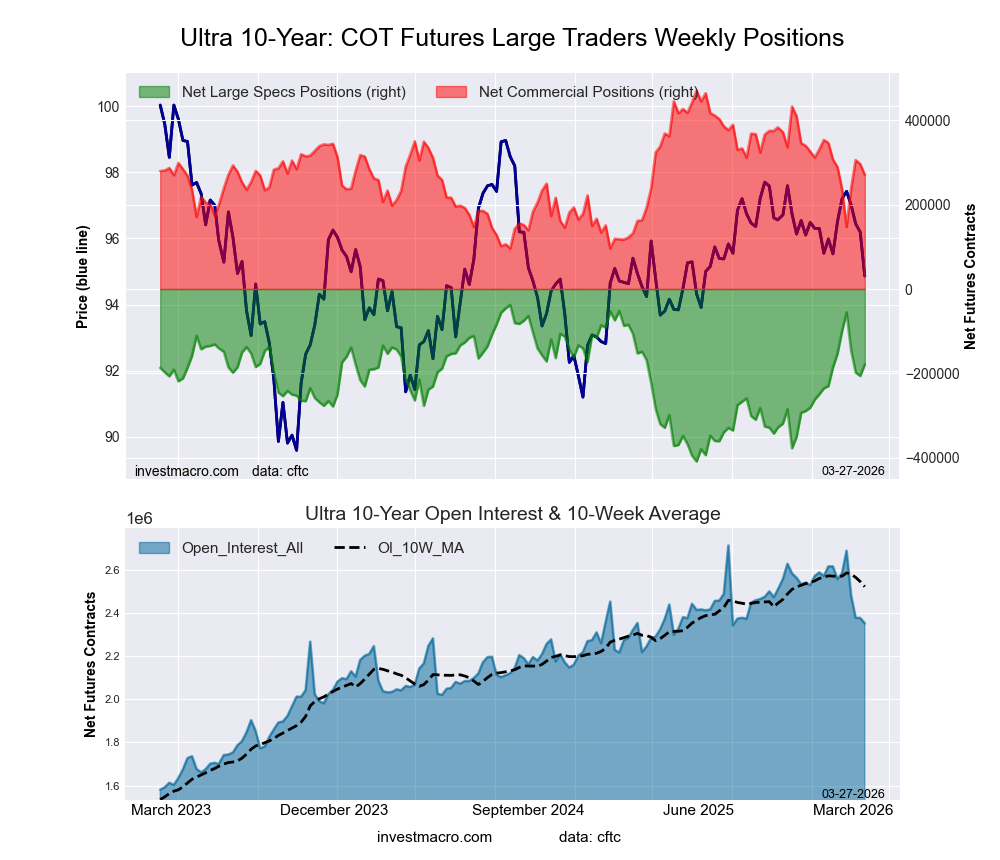 The Ultra 10-Year Notes large speculator standing this week came in at a net position of -178,553 contracts in the data reported through Tuesday. This was a weekly boost of 27,241 contracts from the previous week which had a total of -205,794 net contracts.
This week’s current strength score (the trader positioning range over the past three years, measured from 0 to 100) shows the speculators are currently Bullish with a score of 62.0 percent. The commercials are Bearish with a score of 46.7 percent and the small traders (not shown in chart) are Bearish with a score of 35.0 percent.
Price Trend-Following Model: Strong Downtrend
Our weekly trend-following model classifies the current market price position as: Strong Downtrend.
| Ultra 10-Year Notes Statistics | SPECULATORS | COMMERCIALS | SMALL TRADERS |
| – Percent of Open Interest Longs: | 8.9 | 81.5 | 8.8 |
| – Percent of Open Interest Shorts: | 16.4 | 70.0 | 12.7 |
| – Net Position: | -178,553 | 270,472 | -91,919 |
| – Gross Longs: | 208,377 | 1,917,811 | 207,204 |
| – Gross Shorts: | 386,930 | 1,647,339 | 299,123 |
| – Long to Short Ratio: | 0.5 to 1 | 1.2 to 1 | 0.7 to 1 |
| NET POSITION TREND: | |||
| – Strength Index Score (3 Year Range Pct): | 62.0 | 46.7 | 35.0 |
| – Strength Index Reading (3 Year Range): | Bullish | Bearish | Bearish |
| NET POSITION MOVEMENT INDEX: | |||
| – 6-Week Change in Strength Index: | -6.8 | -4.9 | 34.1 |
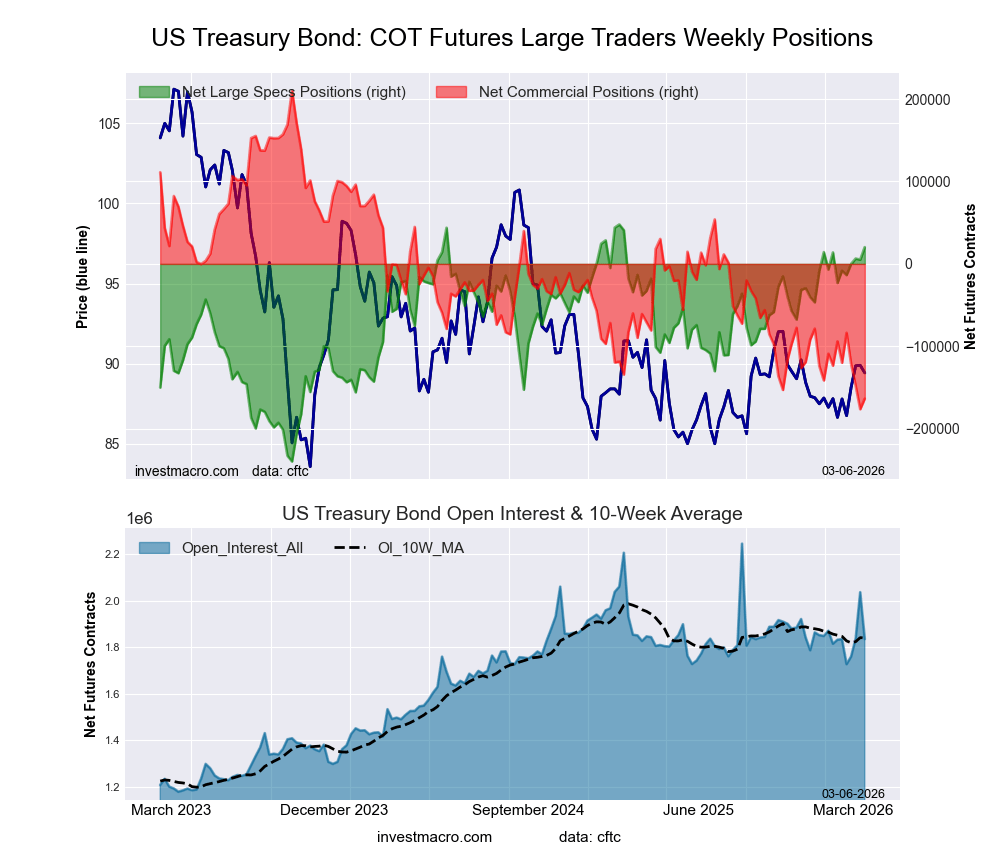
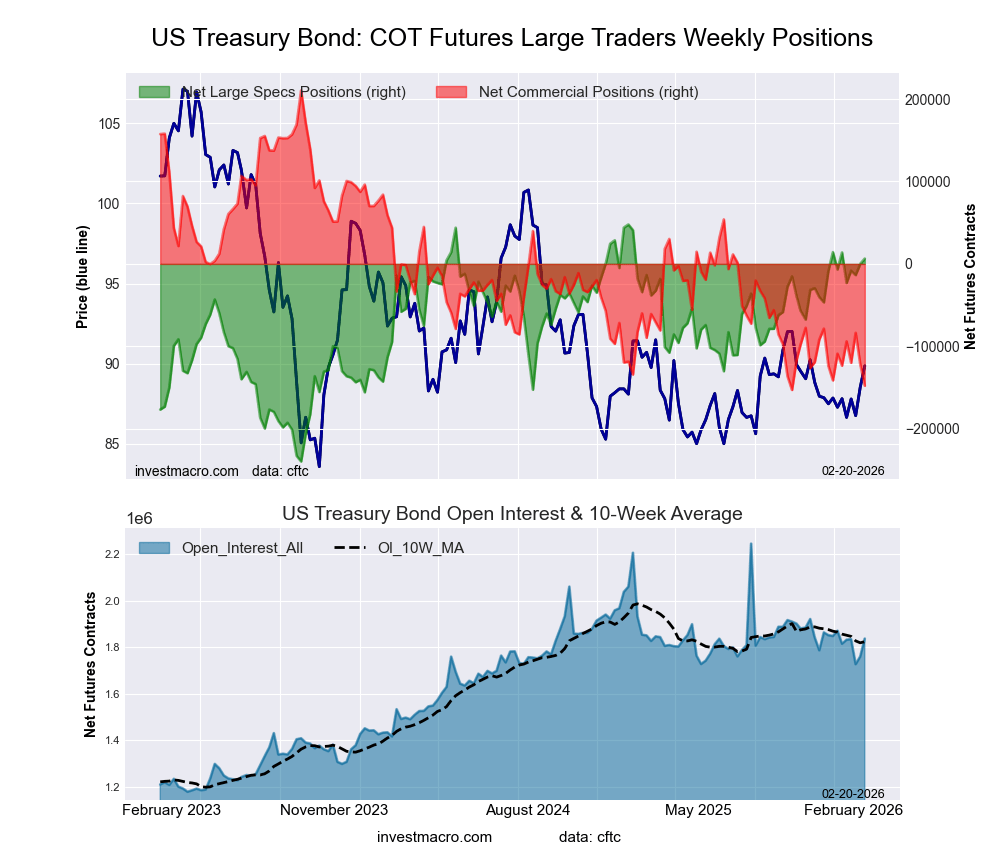
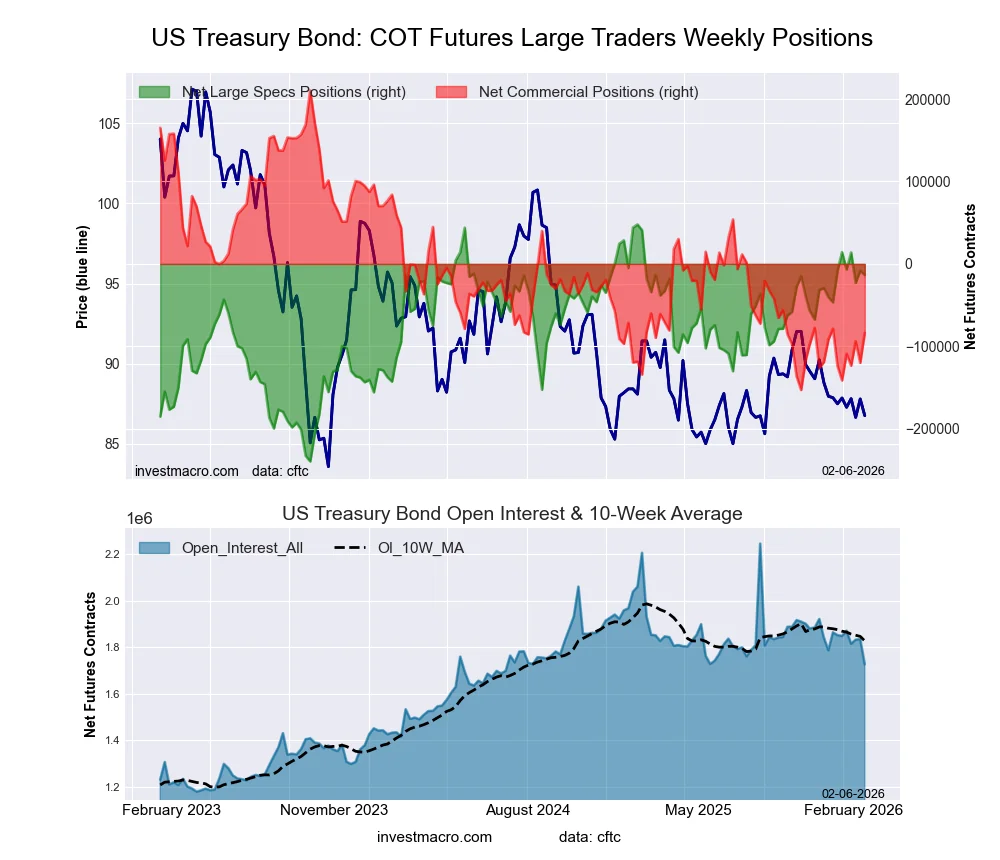
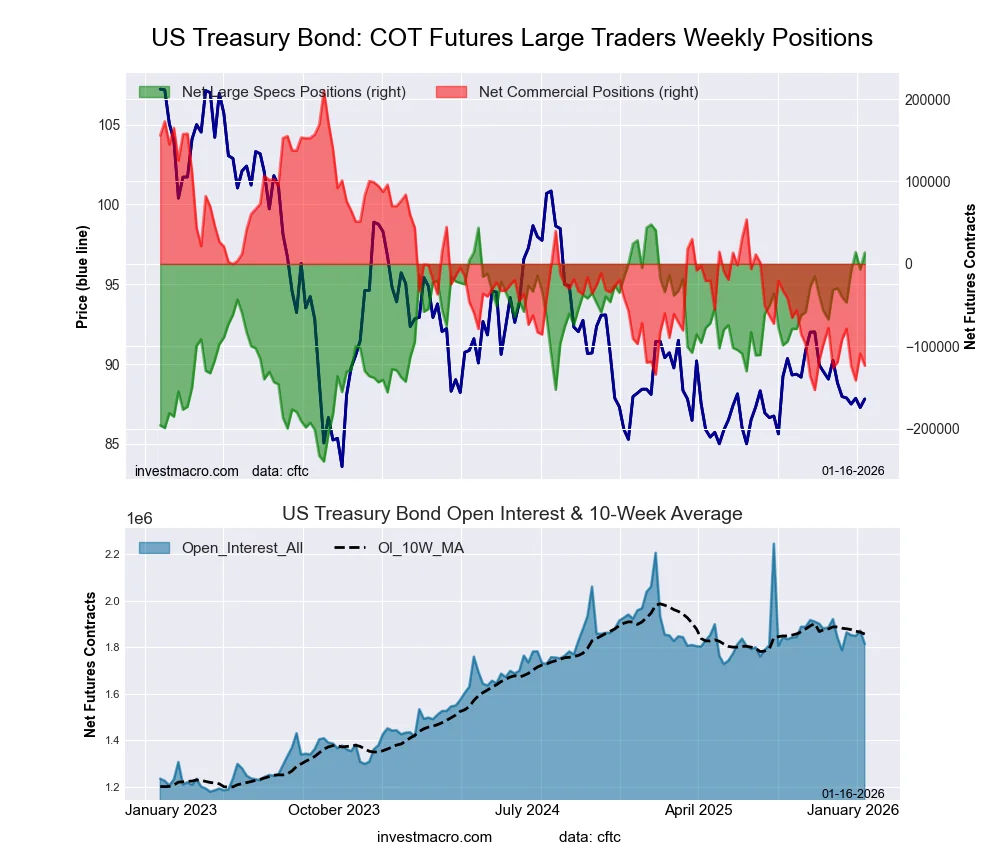
US Treasury Bonds Futures:
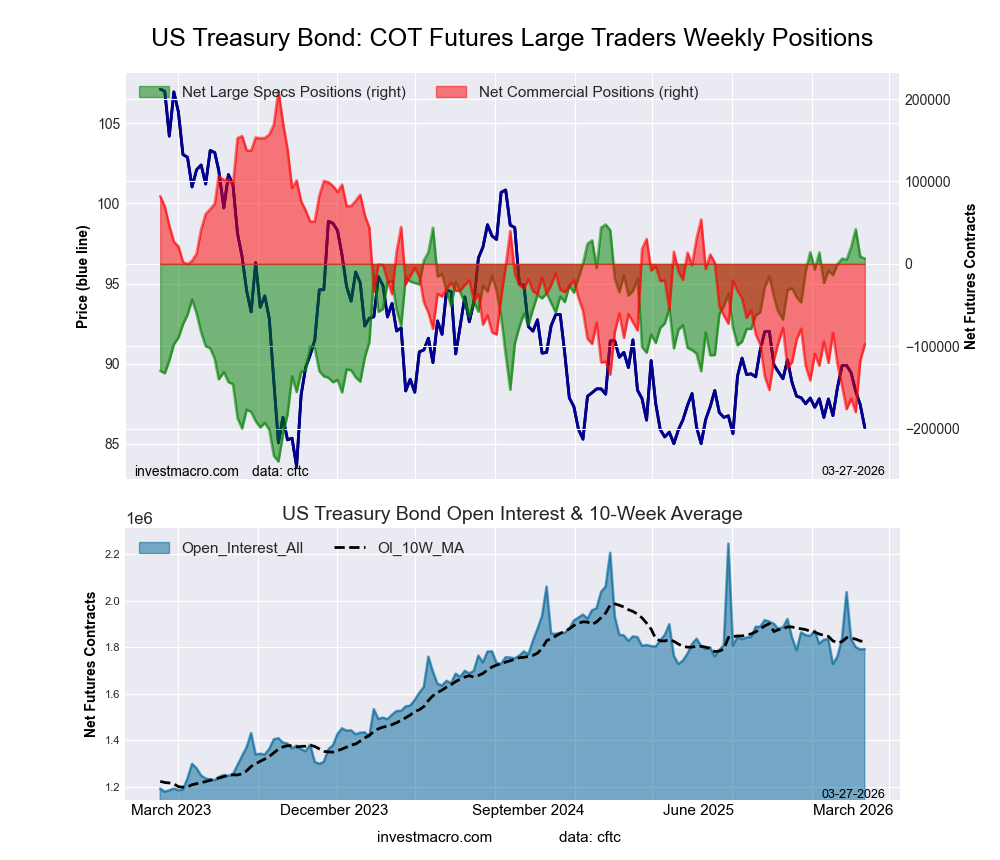 The US Treasury Bonds large speculator standing this week came in at a net position of 6,570 contracts in the data reported through Tuesday. This was a weekly reduction of -2,194 contracts from the previous week which had a total of 8,764 net contracts.
This week’s current strength score (the trader positioning range over the past three years, measured from 0 to 100) shows the speculators are currently Bullish-Extreme with a score of 85.7 percent. The commercials are Bearish with a score of 21.1 percent and the small traders (not shown in chart) are Bearish with a score of 44.1 percent.
Price Trend-Following Model: Strong Downtrend
Our weekly trend-following model classifies the current market price position as: Strong Downtrend.
| US Treasury Bonds Statistics | SPECULATORS | COMMERCIALS | SMALL TRADERS |
| – Percent of Open Interest Longs: | 13.2 | 72.7 | 12.9 |
| – Percent of Open Interest Shorts: | 12.8 | 78.1 | 7.8 |
| – Net Position: | 6,570 | -97,538 | 90,968 |
| – Gross Longs: | 236,195 | 1,302,472 | 231,398 |
| – Gross Shorts: | 229,625 | 1,400,010 | 140,430 |
| – Long to Short Ratio: | 1.0 to 1 | 0.9 to 1 | 1.6 to 1 |
| NET POSITION TREND: | |||
| – Strength Index Score (3 Year Range Pct): | 85.7 | 21.1 | 44.1 |
| – Strength Index Reading (3 Year Range): | Bullish-Extreme | Bearish | Bearish |
| NET POSITION MOVEMENT INDEX: | |||
| – 6-Week Change in Strength Index: | 2.3 | 6.1 | -21.3 |
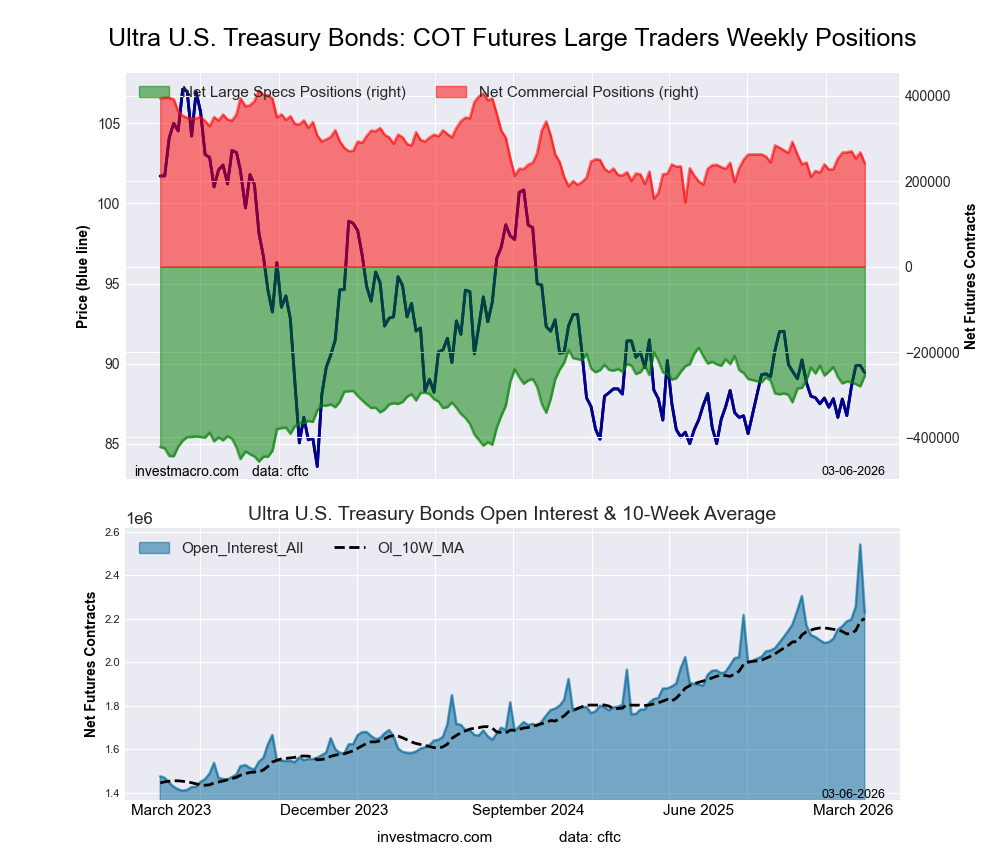
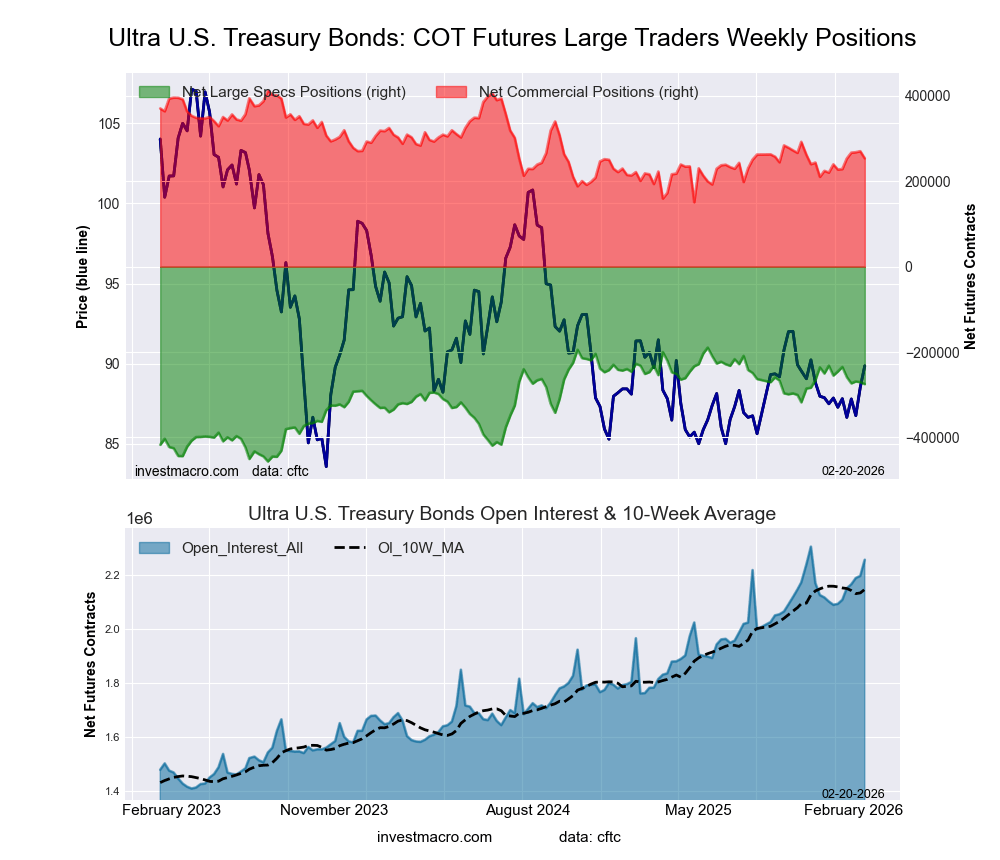
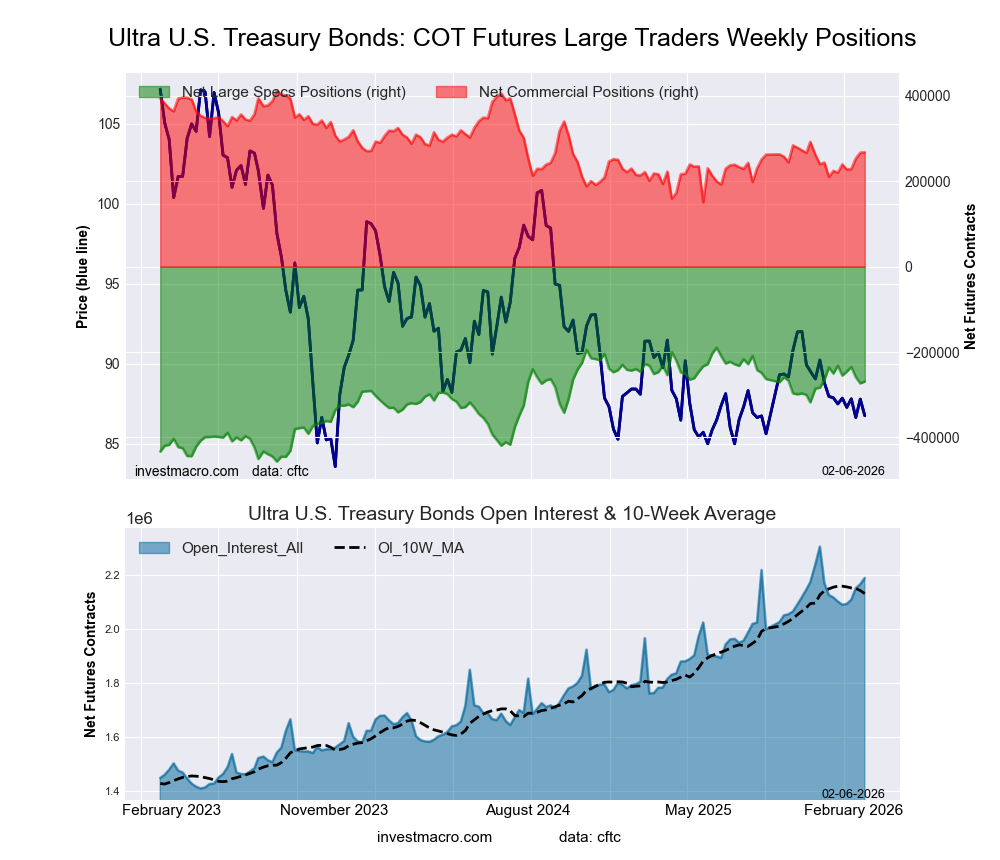
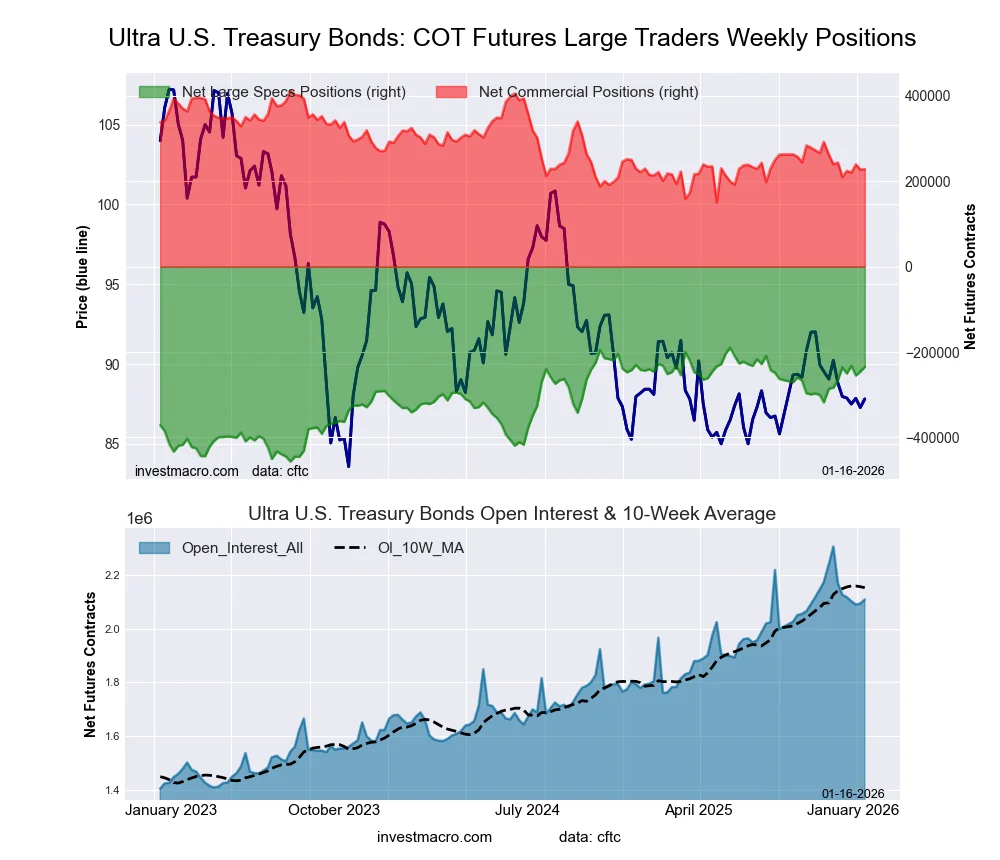
Ultra US Treasury Bonds Futures:
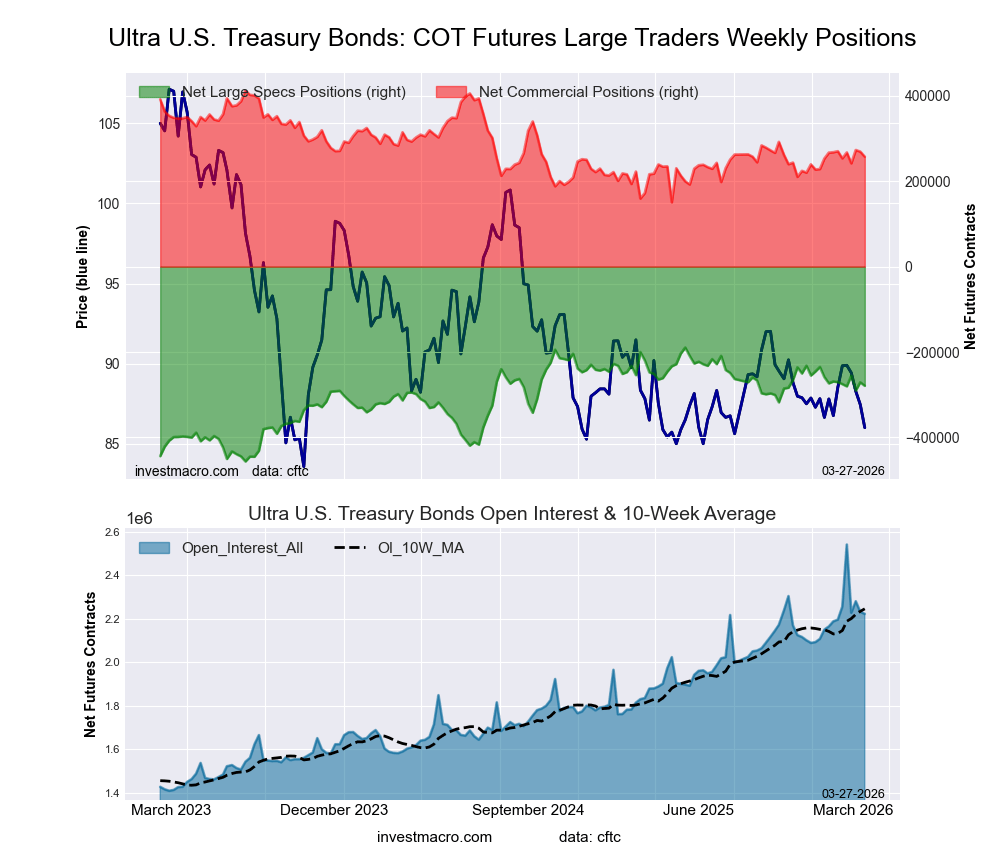 The Ultra US Treasury Bonds large speculator standing this week came in at a net position of -279,187 contracts in the data reported through Tuesday. This was a weekly lowering of -8,050 contracts from the previous week which had a total of -271,137 net contracts.
This week’s current strength score (the trader positioning range over the past three years, measured from 0 to 100) shows the speculators are currently Bullish with a score of 66.5 percent. The commercials are Bearish with a score of 40.8 percent and the small traders (not shown in chart) are Bearish with a score of 37.3 percent.
Price Trend-Following Model: Strong Downtrend
Our weekly trend-following model classifies the current market price position as: Strong Downtrend.
| Ultra US Treasury Bonds Statistics | SPECULATORS | COMMERCIALS | SMALL TRADERS |
| – Percent of Open Interest Longs: | 5.9 | 84.6 | 8.9 |
| – Percent of Open Interest Shorts: | 18.5 | 73.0 | 7.9 |
| – Net Position: | -279,187 | 257,620 | 21,567 |
| – Gross Longs: | 131,831 | 1,881,002 | 197,970 |
| – Gross Shorts: | 411,018 | 1,623,382 | 176,403 |
| – Long to Short Ratio: | 0.3 to 1 | 1.2 to 1 | 1.1 to 1 |
| NET POSITION TREND: | |||
| – Strength Index Score (3 Year Range Pct): | 66.5 | 40.8 | 37.3 |
| – Strength Index Reading (3 Year Range): | Bullish | Bearish | Bearish |
| NET POSITION MOVEMENT INDEX: | |||
| – 6-Week Change in Strength Index: | -3.2 | -4.9 | 22.0 |
Article By InvestMacro – Receive our weekly COT Newsletter
*COT Report: The COT data, released weekly to the public each Friday, is updated through the most recent Tuesday (data is 3 days old) and shows a quick view of how large speculators or non-commercials (for-profit traders) were positioned in the futures markets.
The CFTC categorizes trader positions according to commercial hedgers (traders who use futures contracts for hedging as part of the business), non-commercials (large traders who speculate to realize trading profits) and nonreportable traders (usually small traders/speculators) as well as their open interest (contracts open in the market at time of reporting). See CFTC criteria here.