
By InvestMacro | COT | Data Tables | COT Leaders | Downloads | COT Newsletter
Here are the latest charts and statistics for the Commitment of Traders (COT) data published by the Commodities Futures Trading Commission (CFTC) on Monday due to the Thanksgiving holiday last week.
The latest COT data is updated through Tuesday November 23 2021 and shows a quick view of how large traders (for-profit speculators and commercial entities) were positioned in the futures markets.
| Nov-23-2021 | OI | OI-Index | Spec-Net | Spec-Index | Com-Net | COM-Index | Smalls-Net | Smalls-Index |
|---|---|---|---|---|---|---|---|---|
| WTI Crude | 2,028,573 | 13 | 407,657 | 42 | -454,965 | 46 | 47,308 | 82 |
| Gold | 559,823 | 40 | 234,411 | 62 | -267,834 | 36 | 33,423 | 63 |
| Silver | 149,642 | 16 | 40,105 | 62 | -56,998 | 43 | 16,893 | 39 |
| Copper | 190,681 | 20 | 13,722 | 52 | -20,941 | 45 | 7,219 | 67 |
| Palladium | 10,078 | 16 | -1,766 | 9 | 1,913 | 91 | -147 | 36 |
| Platinum | 61,553 | 24 | 13,135 | 21 | -20,272 | 80 | 7,137 | 62 |
| Natural Gas | 1,280,907 | 38 | -137,255 | 37 | 97,333 | 62 | 39,922 | 80 |
| Brent | 206,668 | 45 | -14,522 | 95 | 7,811 | 1 | 6,711 | 100 |
| Heating Oil | 338,034 | 0 | 15,631 | 65 | -30,997 | 38 | 15,366 | 52 |
| Soybeans | 691,303 | 20 | 66,214 | 47 | -29,173 | 59 | -37,041 | 10 |
| Corn | 1,611,856 | 40 | 417,089 | 83 | -363,662 | 20 | -53,427 | 12 |
| Coffee | 272,527 | 38 | 67,904 | 98 | -71,494 | 4 | 3,590 | 13 |
| Sugar | 920,493 | 24 | 249,626 | 88 | -296,922 | 12 | 47,296 | 66 |
| Wheat | 425,301 | 47 | 41,489 | 82 | -32,939 | 9 | -8,550 | 61 |
Gold Comex Futures:
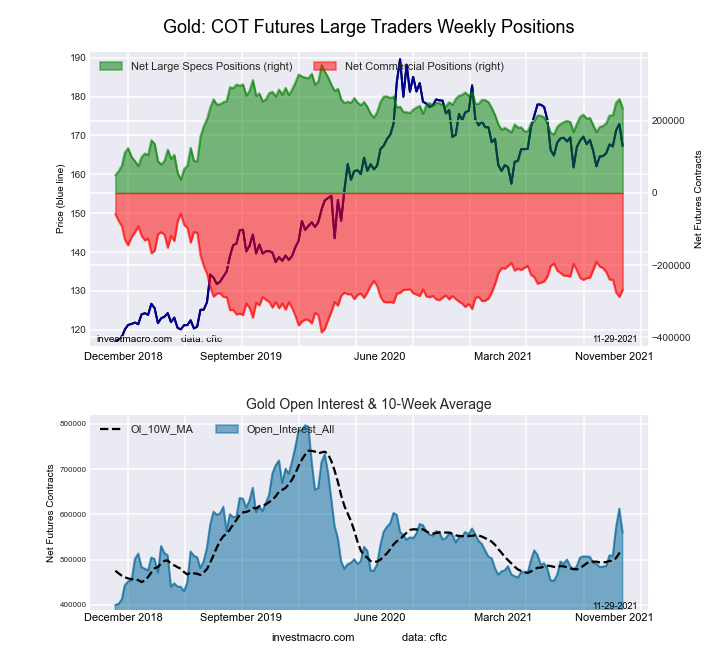 The Gold Comex Futures large speculator standing this week totaled a net position of 234,411 contracts in the data reported through Tuesday. This was a weekly reduction of -25,369 contracts from the previous week which had a total of 259,780 net contracts.
This week’s current strength score (the trader positioning range over the past three years, measured from 0 to 100) shows the speculators are currently Bullish with a score of 62.3 percent. The commercials are Bearish with a score of 35.9 percent and the small traders (not shown in chart) are Bullish with a score of 62.7 percent.
Free Reports:
 Download Our Metatrader 4 Indicators – Put Our Free MetaTrader 4 Custom Indicators on your charts when you join our Weekly Newsletter
 Get our Weekly Commitment of Traders Reports - See where the biggest traders (Hedge Funds and Commercial Hedgers) are positioned in the futures markets on a weekly basis.
| Gold Futures Statistics | SPECULATORS | COMMERCIALS | SMALL TRADERS |
| – Percent of Open Interest Longs: | 58.3 | 21.6 | 9.9 |
| – Percent of Open Interest Shorts: | 16.4 | 69.5 | 3.9 |
| – Net Position: | 234,411 | -267,834 | 33,423 |
| – Gross Longs: | 326,409 | 121,027 | 55,380 |
| – Gross Shorts: | 91,998 | 388,861 | 21,957 |
| – Long to Short Ratio: | 3.5 to 1 | 0.3 to 1 | 2.5 to 1 |
| NET POSITION TREND: | |||
| – COT Index Score (3 Year Range Pct): | 62.3 | 35.9 | 62.7 |
| – COT Index Reading (3 Year Range): | Bullish | Bearish | Bullish |
| NET POSITION MOVEMENT INDEX: | |||
| – 6-Week Change in Strength Index: | 15.5 | -18.3 | 29.4 |
Silver Comex Futures:
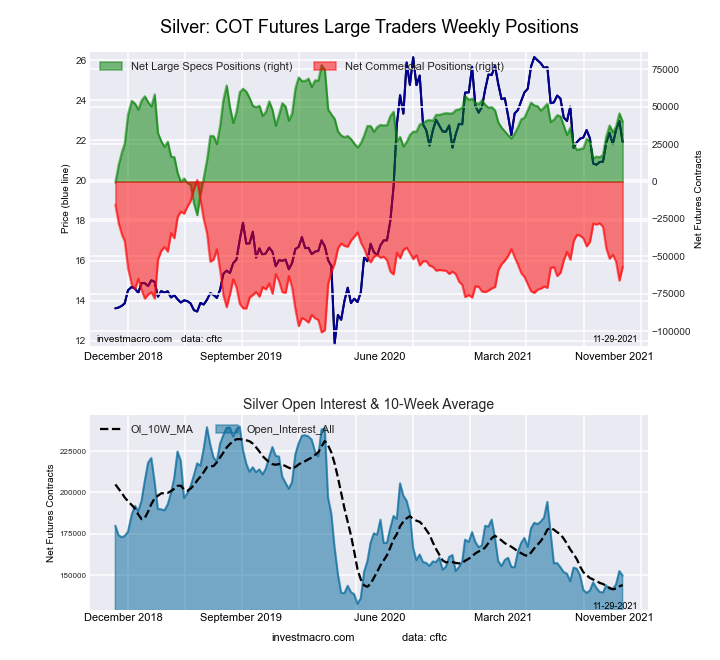 The Silver Comex Futures large speculator standing this week totaled a net position of 40,105 contracts in the data reported through Tuesday. This was a weekly decline of -5,520 contracts from the previous week which had a total of 45,625 net contracts.
This week’s current strength score (the trader positioning range over the past three years, measured from 0 to 100) shows the speculators are currently Bullish with a score of 62.3 percent. The commercials are Bearish with a score of 43.0 percent and the small traders (not shown in chart) are Bearish with a score of 39.1 percent.
| Silver Futures Statistics | SPECULATORS | COMMERCIALS | SMALL TRADERS |
| – Percent of Open Interest Longs: | 45.8 | 27.5 | 19.9 |
| – Percent of Open Interest Shorts: | 19.0 | 65.6 | 8.6 |
| – Net Position: | 40,105 | -56,998 | 16,893 |
| – Gross Longs: | 68,478 | 41,120 | 29,715 |
| – Gross Shorts: | 28,373 | 98,118 | 12,822 |
| – Long to Short Ratio: | 2.4 to 1 | 0.4 to 1 | 2.3 to 1 |
| NET POSITION TREND: | |||
| – COT Index Score (3 Year Range Pct): | 62.3 | 43.0 | 39.1 |
| – COT Index Reading (3 Year Range): | Bullish | Bearish | Bearish |
| NET POSITION MOVEMENT INDEX: | |||
| – 6-Week Change in Strength Index: | 22.1 | -26.2 | 27.7 |
Copper Grade #1 Futures:
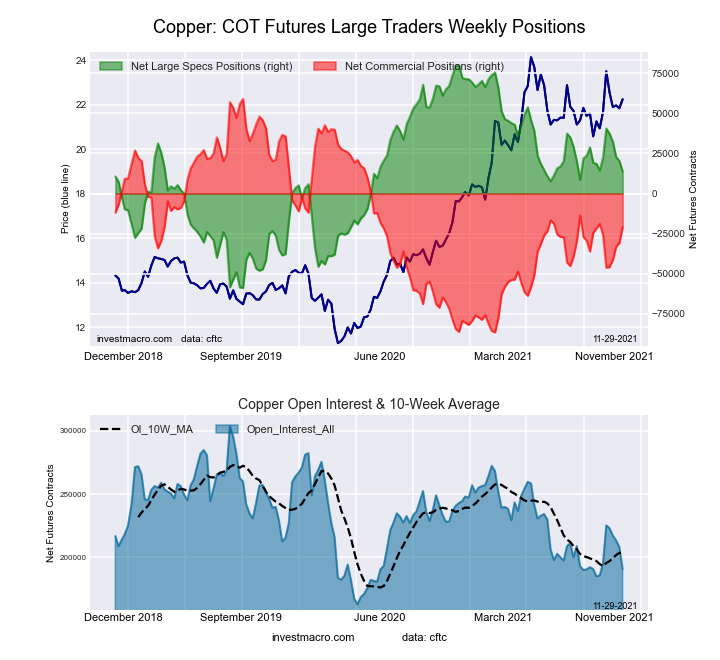 The Copper Grade #1 Futures large speculator standing this week totaled a net position of 13,722 contracts in the data reported through Tuesday. This was a weekly fall of -6,615 contracts from the previous week which had a total of 20,337 net contracts.
This week’s current strength score (the trader positioning range over the past three years, measured from 0 to 100) shows the speculators are currently Bullish with a score of 52.2 percent. The commercials are Bearish with a score of 45.1 percent and the small traders (not shown in chart) are Bullish with a score of 67.0 percent.
| Copper Futures Statistics | SPECULATORS | COMMERCIALS | SMALL TRADERS |
| – Percent of Open Interest Longs: | 37.6 | 40.7 | 9.5 |
| – Percent of Open Interest Shorts: | 30.4 | 51.7 | 5.7 |
| – Net Position: | 13,722 | -20,941 | 7,219 |
| – Gross Longs: | 71,699 | 77,592 | 18,094 |
| – Gross Shorts: | 57,977 | 98,533 | 10,875 |
| – Long to Short Ratio: | 1.2 to 1 | 0.8 to 1 | 1.7 to 1 |
| NET POSITION TREND: | |||
| – COT Index Score (3 Year Range Pct): | 52.2 | 45.1 | 67.0 |
| – COT Index Reading (3 Year Range): | Bullish | Bearish | Bullish |
| NET POSITION MOVEMENT INDEX: | |||
| – 6-Week Change in Strength Index: | -6.3 | 3.4 | 22.2 |
Platinum Futures:
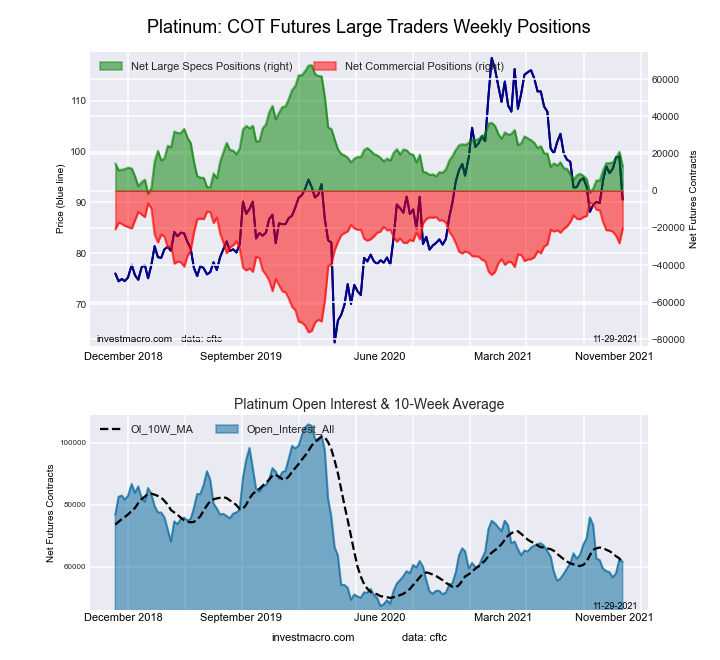 The Platinum Futures large speculator standing this week totaled a net position of 13,135 contracts in the data reported through Tuesday. This was a weekly decrease of -7,878 contracts from the previous week which had a total of 21,013 net contracts.
This week’s current strength score (the trader positioning range over the past three years, measured from 0 to 100) shows the speculators are currently Bearish with a score of 21.3 percent. The commercials are Bullish-Extreme with a score of 80.0 percent and the small traders (not shown in chart) are Bullish with a score of 61.6 percent.
| Platinum Futures Statistics | SPECULATORS | COMMERCIALS | SMALL TRADERS |
| – Percent of Open Interest Longs: | 49.5 | 27.8 | 16.4 |
| – Percent of Open Interest Shorts: | 28.1 | 60.8 | 4.8 |
| – Net Position: | 13,135 | -20,272 | 7,137 |
| – Gross Longs: | 30,454 | 17,139 | 10,078 |
| – Gross Shorts: | 17,319 | 37,411 | 2,941 |
| – Long to Short Ratio: | 1.8 to 1 | 0.5 to 1 | 3.4 to 1 |
| NET POSITION TREND: | |||
| – COT Index Score (3 Year Range Pct): | 21.3 | 80.0 | 61.6 |
| – COT Index Reading (3 Year Range): | Bearish | Bullish-Extreme | Bullish |
| NET POSITION MOVEMENT INDEX: | |||
| – 6-Week Change in Strength Index: | 3.2 | -5.0 | 18.2 |
Palladium Futures:
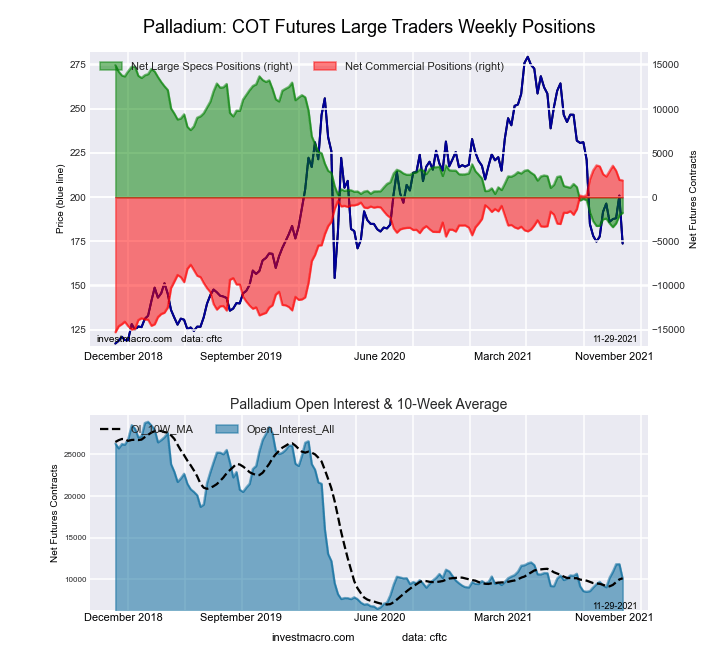 The Palladium Futures large speculator standing this week totaled a net position of -1,766 contracts in the data reported through Tuesday. This was a weekly advance of 272 contracts from the previous week which had a total of -2,038 net contracts.
This week’s current strength score (the trader positioning range over the past three years, measured from 0 to 100) shows the speculators are currently Bearish-Extreme with a score of 8.8 percent. The commercials are Bullish-Extreme with a score of 91.0 percent and the small traders (not shown in chart) are Bearish with a score of 36.0 percent.
| Palladium Futures Statistics | SPECULATORS | COMMERCIALS | SMALL TRADERS |
| – Percent of Open Interest Longs: | 29.7 | 52.9 | 15.6 |
| – Percent of Open Interest Shorts: | 47.2 | 33.9 | 17.0 |
| – Net Position: | -1,766 | 1,913 | -147 |
| – Gross Longs: | 2,992 | 5,329 | 1,571 |
| – Gross Shorts: | 4,758 | 3,416 | 1,718 |
| – Long to Short Ratio: | 0.6 to 1 | 1.6 to 1 | 0.9 to 1 |
| NET POSITION TREND: | |||
| – COT Index Score (3 Year Range Pct): | 8.8 | 91.0 | 36.0 |
| – COT Index Reading (3 Year Range): | Bearish-Extreme | Bullish-Extreme | Bearish |
| NET POSITION MOVEMENT INDEX: | |||
| – 6-Week Change in Strength Index: | 4.0 | -3.8 | -1.1 |
Article By InvestMacro – Receive our weekly COT Reports by Email
*COT Report: The COT data, released weekly to the public each Friday, is updated through the most recent Tuesday (data is 3 days old) and shows a quick view of how large speculators or non-commercials (for-profit traders) were positioned in the futures markets.
The CFTC categorizes trader positions according to commercial hedgers (traders who use futures contracts for hedging as part of the business), non-commercials (large traders who speculate to realize trading profits) and nonreportable traders (usually small traders/speculators) as well as their open interest (contracts open in the market at time of reporting).See CFTC criteria here.

- Oil prices fall back to pre‑war levels. Silver drops to a 7‑month low Jun 25, 2026
- Gold Falls to an Eight-Month Low: This May Not Be the Bottom Jun 25, 2026
- Stock indices came under heavy selling pressure amid growing skepticism about AI investments Jun 24, 2026
- The Pound Is Pressured Not by Politics, but by a Strong US Dollar Jun 24, 2026
- Global crude oil prices continued to decline. The AUD/USD exchange rate hit an 11‑week low Jun 23, 2026
- EUR/USD Remains Under Sellers’ Control as the Dollar Stays Strong Jun 23, 2026
- Gold Falls for the Third Consecutive Week: Is There Still Upside Potential? Jun 22, 2026
- Bank Indonesia raised its interest rate. Norges Bank and the SNB left rates unchanged Jun 19, 2026
- EUR/USD Loses Ground as Market Sentiment Favours the US Dollar Jun 19, 2026
- GBPUSD Awaits Bank of England Meeting Near April Lows Jun 18, 2026