
By RoboForex Analytical Department
Gold starts the week near 4,150 USD per troy ounce, its lowest level since 11 June. The precious metal has recorded a third consecutive weekly decline amid a stronger US dollar and growing expectations that the Federal Reserve may continue tightening monetary policy.
The US currency refreshed its yearly high after the Federal Reserve’s June meeting. Although the regulator left the interest rate unchanged, the updated forecasts proved much more hawkish. Nine out of nineteen FOMC members now allow for a rate hike before the end of the year. The market itself is already pricing in the probability of such a move by September at around 70%.
Persistently high interest rates usually weigh on gold. This is because the appeal of dollar-denominated assets increases, as do the opportunity costs of holding the metal. The key point is that gold does not generate coupon income.
Investors are also monitoring the geopolitical situation. Additional uncertainty was triggered by reports that the planned talks between the US and Iran on a final settlement of the Middle East conflict had been postponed.
Another negative factor for the gold market was Goldman Sachs’ decision to lower its year-end forecast for the metal from 5,400 to 4,900 USD per ounce. This added further pressure to quotes.
Free Reports:
 Download Our Metatrader 4 Indicators – Put Our Free MetaTrader 4 Custom Indicators on your charts when you join our Weekly Newsletter
 Get our Weekly Commitment of Traders Reports - See where the biggest traders (Hedge Funds and Commercial Hedgers) are positioned in the futures markets on a weekly basis.
XAU/USD Technical Analysis
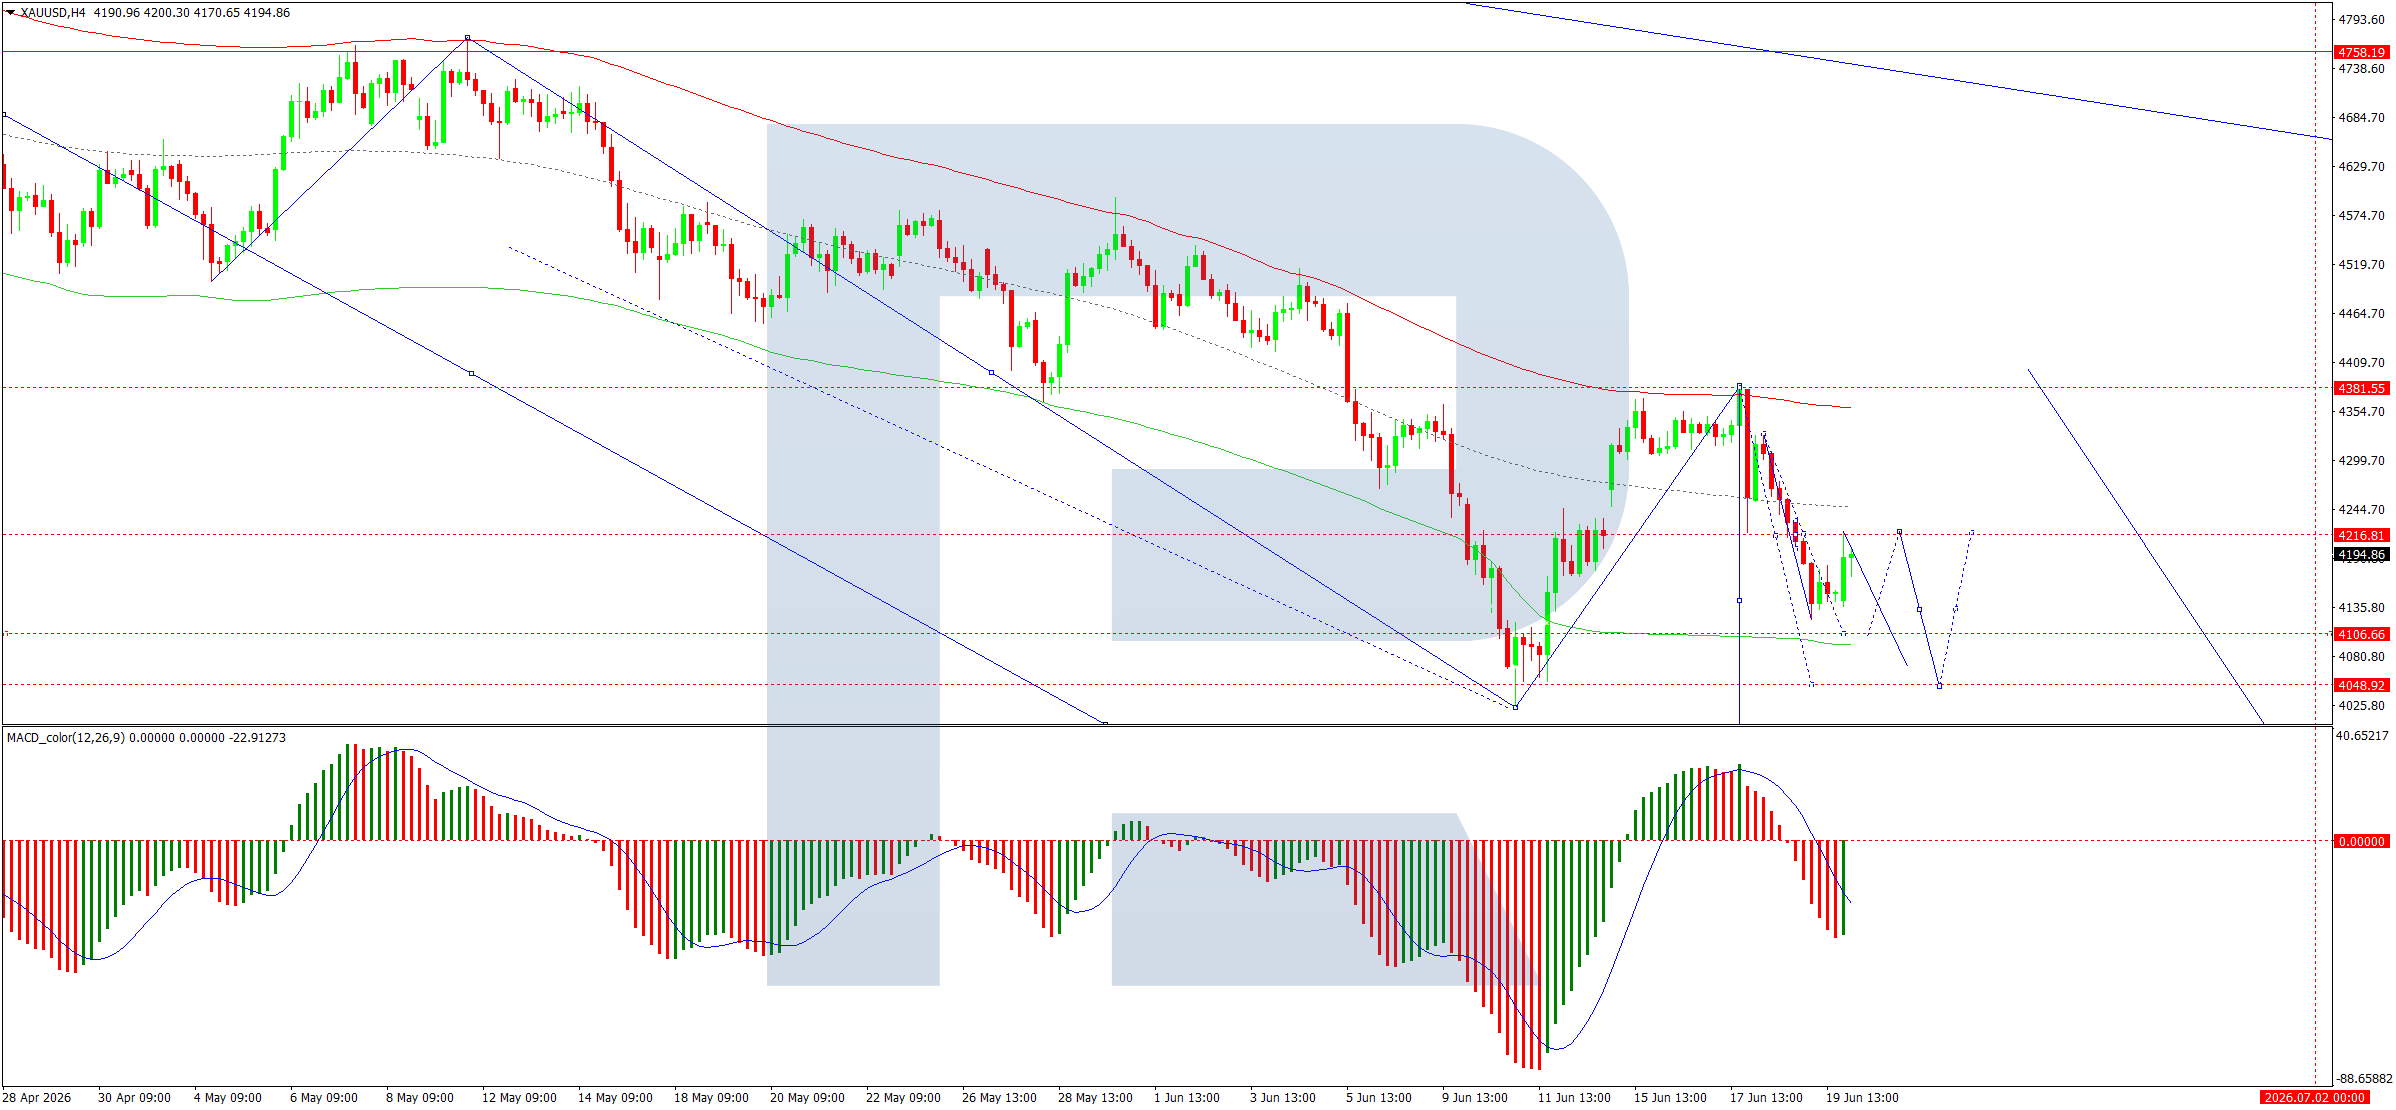
On the H4 chart of XAU/USD, the market formed a consolidation range around 4,216 and completed a downward wave to 4,121. We expect a corrective move towards 4,216. After that, the probability of a new decline towards 4,100 may be considered, with the potential for the wave to extend to 4,040.
The MACD indicator confirms the current downward impulse. The signal line is below the central line and is pointing firmly downwards.
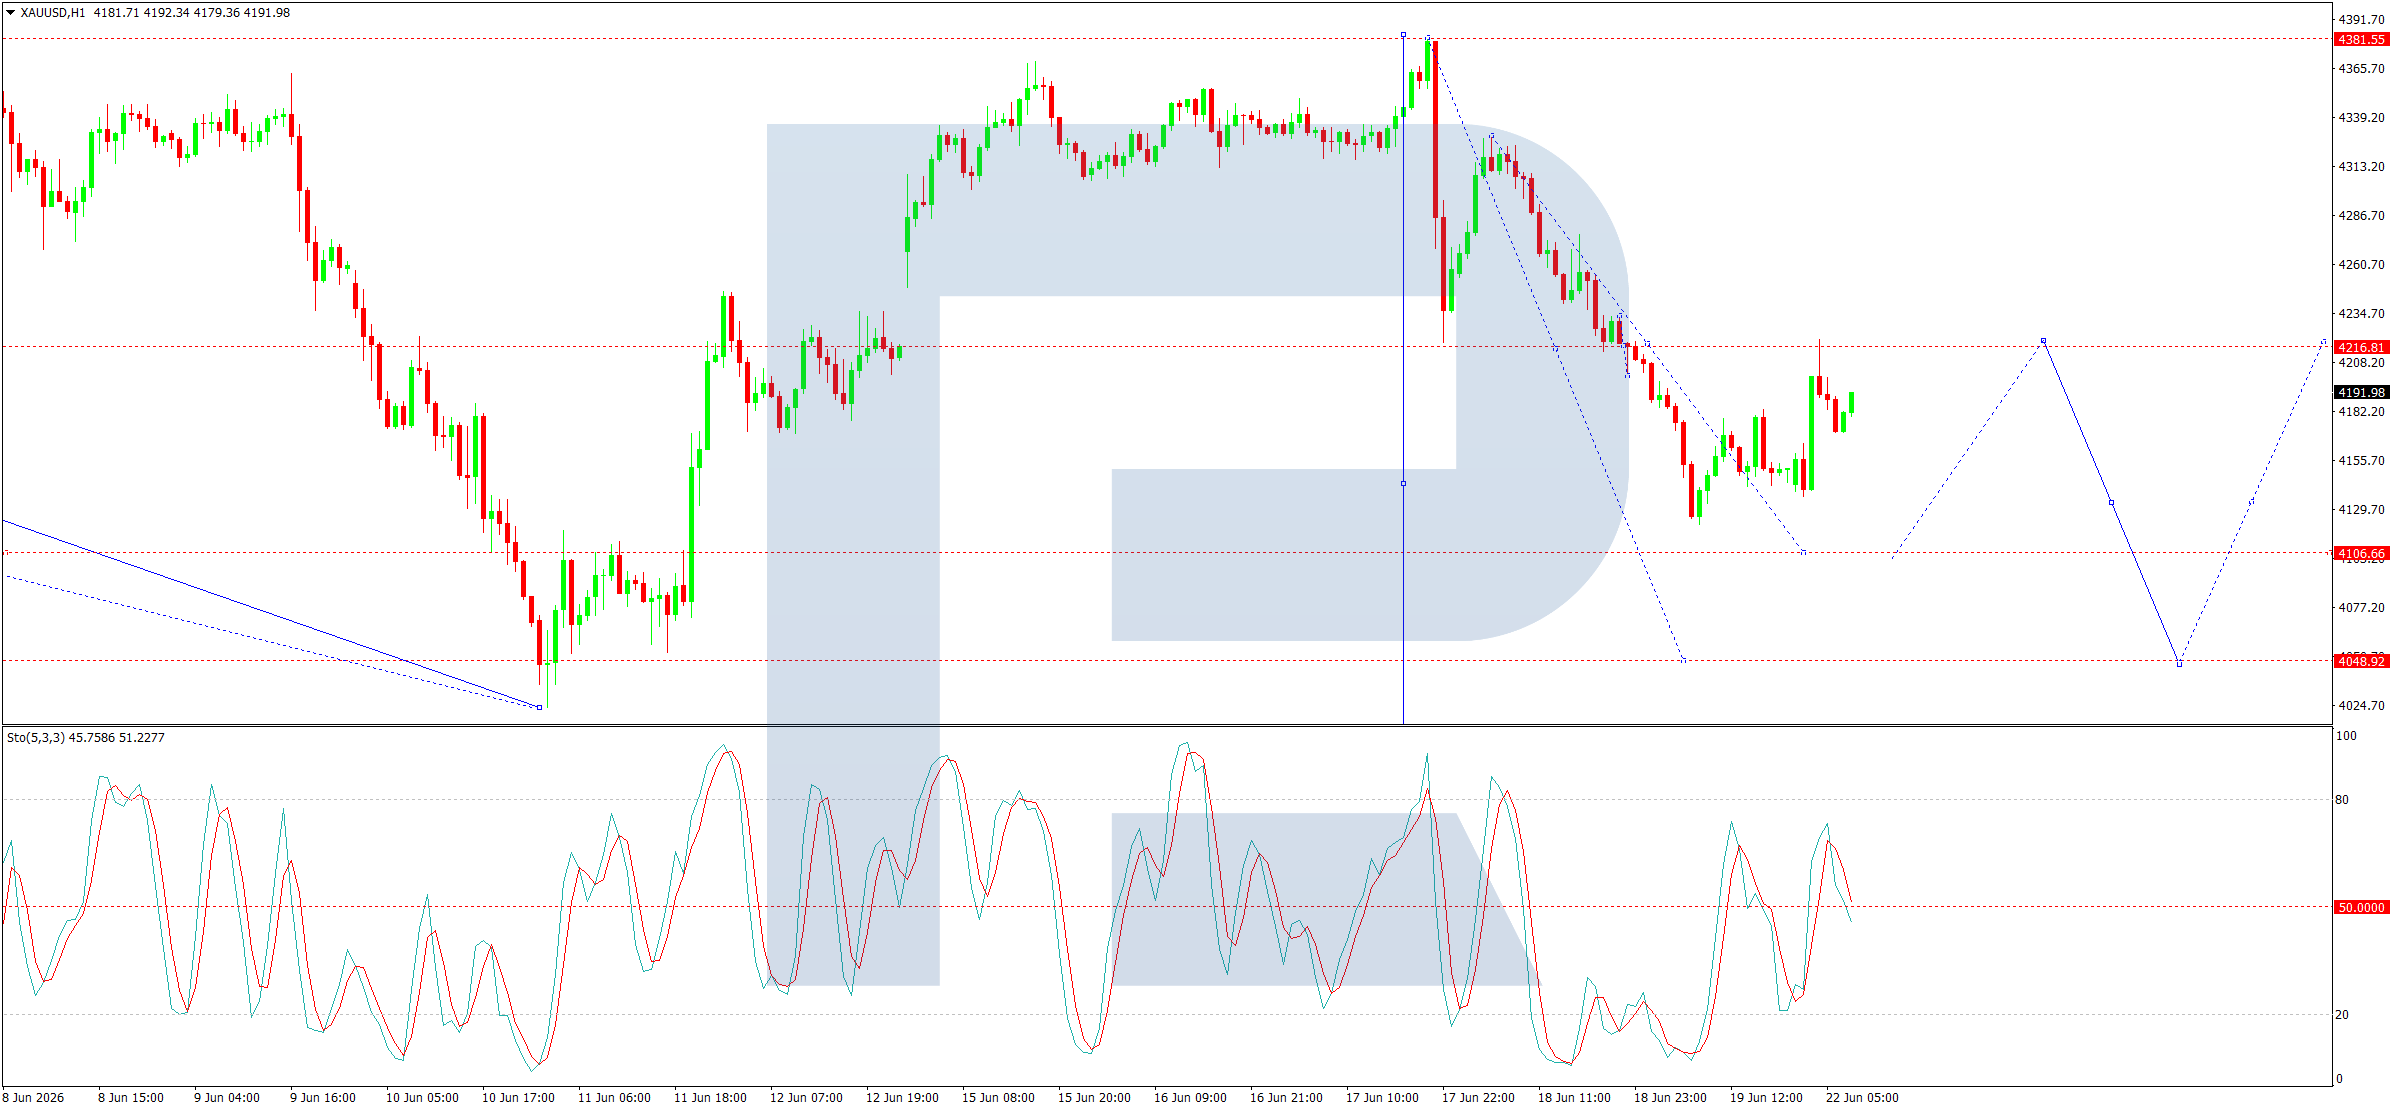
On the H1 chart, the market broke below 4,200 and completed a downward wave towards 4,168. Going forward, we consider the possibility of a correction towards 4,200, testing this level from below. After that, a decline towards 4,100 is expected, followed by a rebound towards 4,200.
The Stochastic oscillator confirms this scenario: the signal line remains below 50 and is under pressure to decline towards 20.
Disclaimer
Any forecasts contained herein are based on the author’s particular opinion. This analysis may not be treated as trading advice. RoboForex bears no responsibility for trading results based on trading recommendations and reviews contained herein.

- The Tech‑heavy NASDAQ Index jumped by more than 3.3%. The offshore yuan is trading at its highest level since 2023 Jul 31, 2026
- USD/JPY After Volatility: Multiple Events in One Day Jul 31, 2026
- The US indices sell off amid renewed US-Iran clashes. Oil jumps by 7% Jul 30, 2026
- USD/JPY Temporary in Equilibrium: Multiple Factors in Focus Jul 30, 2026
- GBP/USD at Month’s Lows: The Outlook Remains Weak Jul 29, 2026
- Crude oil falls below $80 per barrel. Australia sees inflation slowdown Jul 29, 2026
- The US Tech sector hit by sell‑off. Oil prices decline on renewed negotiations Jul 28, 2026
- Gold Declines, Focus on Fed and Falling Oil Prices Jul 28, 2026
- This week will be one of the most crowded for central‑bank meetings Jul 27, 2026
- EUR/USD Ahead of a Key Week: Holding Near Lows Jul 27, 2026
