By InvestMacro
Here are the latest charts and statistics for the Commitment of Traders (COT) data published by the Commodities Futures Trading Commission (CFTC).
The latest COT data is updated through Tuesday May 5th and shows a quick view of how large traders (for-profit speculators and commercial entities) were positioned in the futures markets.
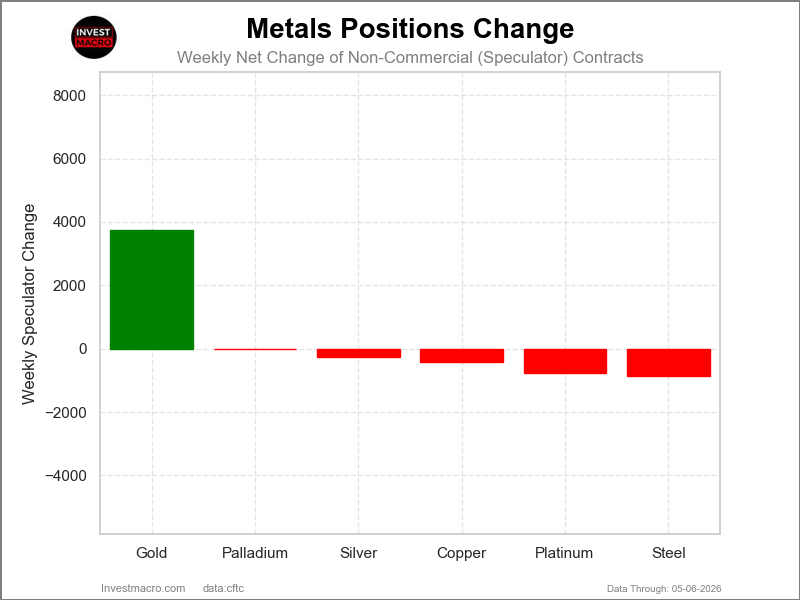
The COT metals markets speculator bets were overall lower this week as just one out of the six metals markets we cover had higher positioning while the other five markets had lower speculator contracts.
Leading the gains for the metals was Gold with a gain of 3,732 contracts on the week.
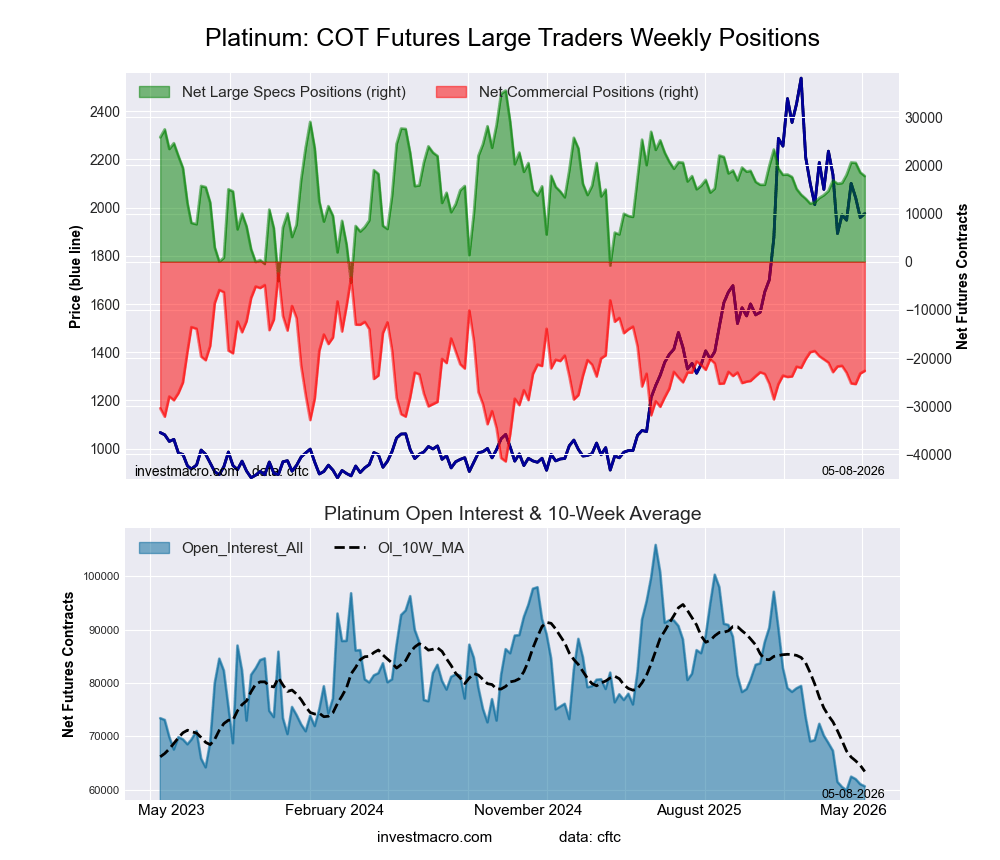
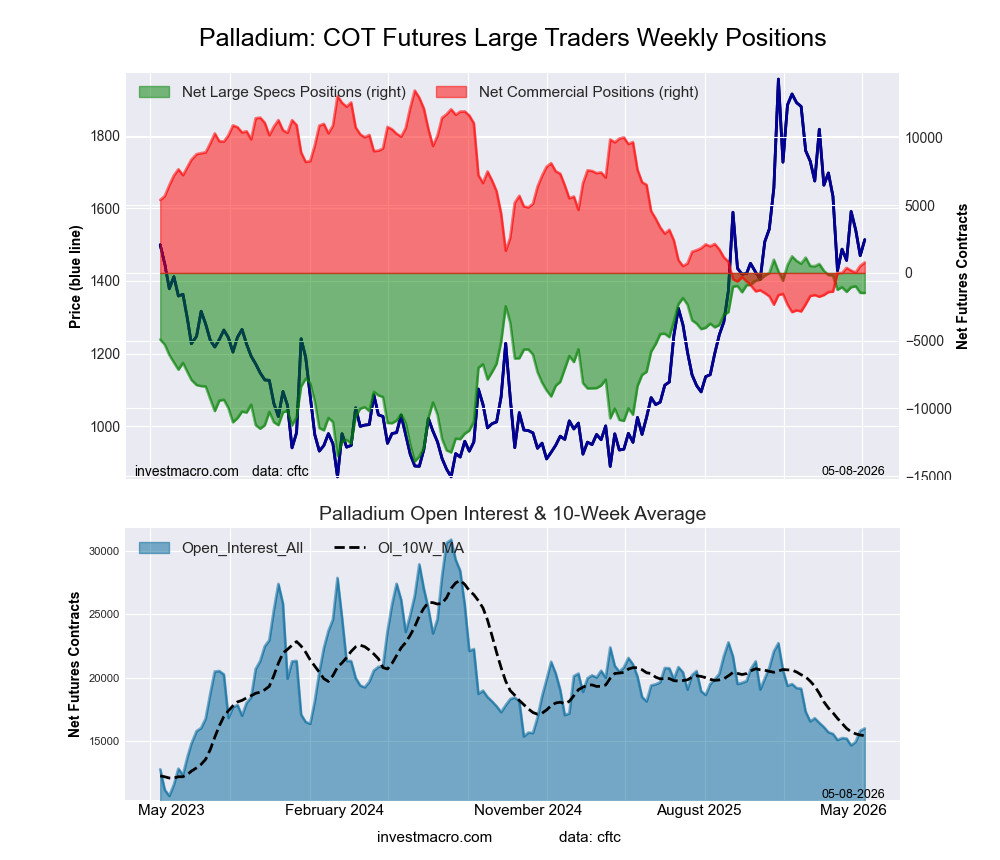
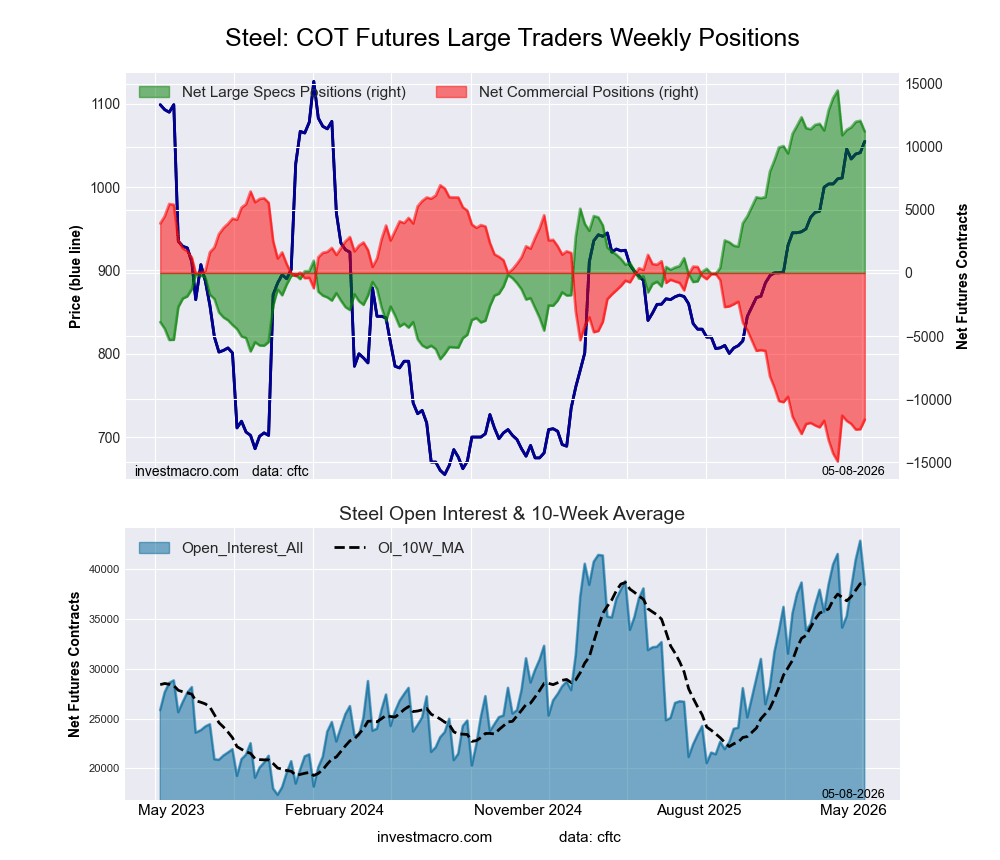
The markets with declines in speculator bets for the week were Steel (-849 contracts), Platinum (-765 contracts), Copper (-432 contracts), Silver (-268 contracts) and with Palladium (-12 contracts) also registering lower bets on the week.
Free Reports:
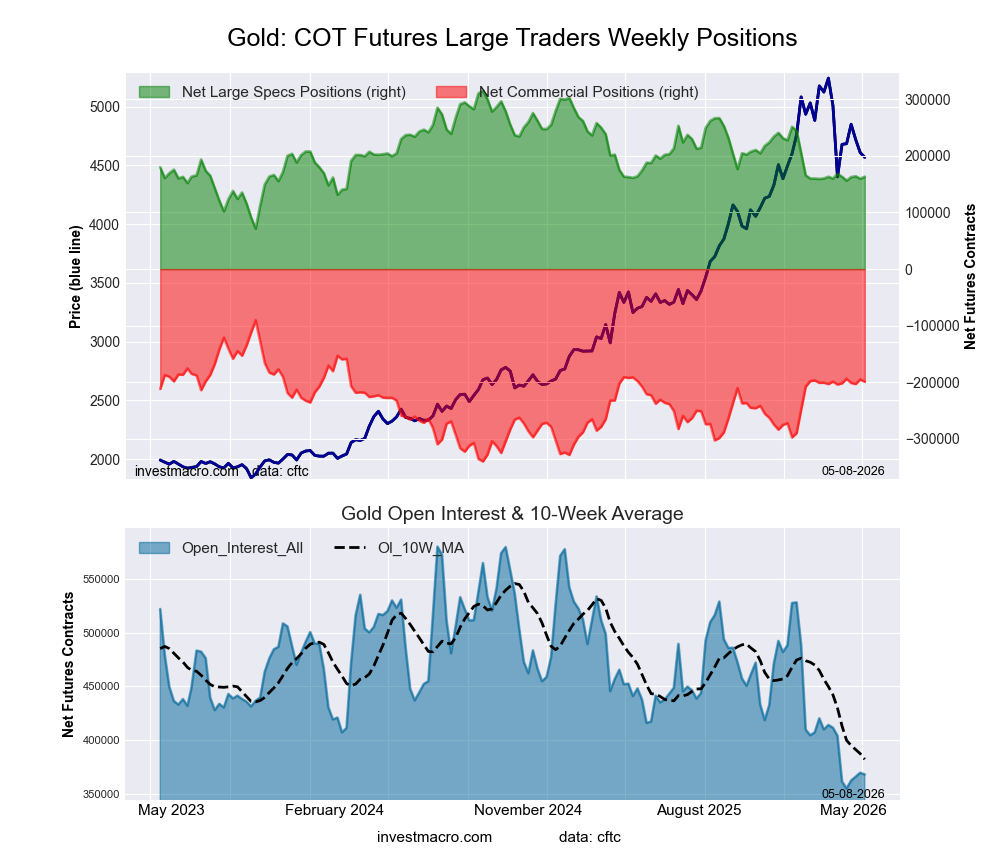
Highlighting the Metals markets today: This week saw speculator bets in Gold rise very modestly by a little under +4,000 net contracts. Gold positioning has stabilized right around the +160,000 to +165,000 net contract standing over the past 15 or so weeks. Previously, Gold bullish contracts had been over 200,000 net contracts week in and week out before falling lower in late January.
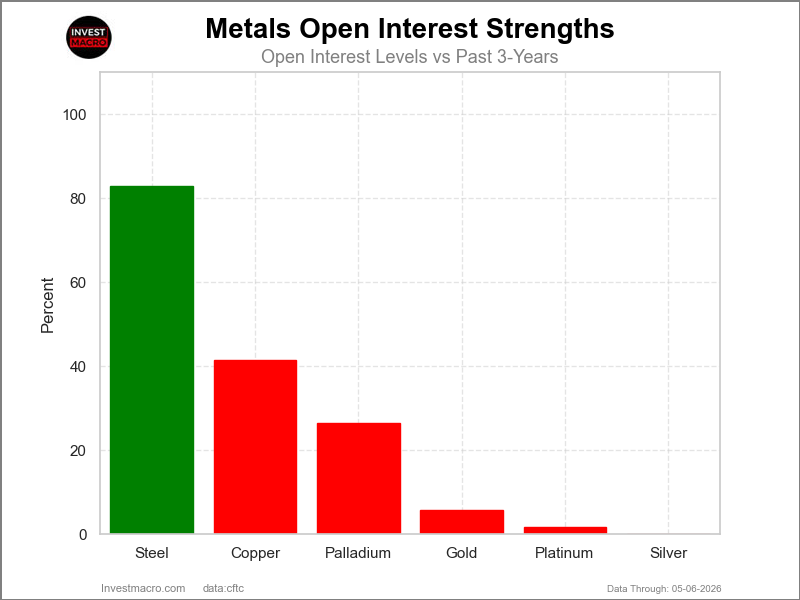
Open interest levels for Gold have fallen off dramatically and are around 360,000 contracts this week. The average open interest contracts since the beginning of 2025 have been around 460,000 contracts, illustrating that the market interest has cooled off in these past few months.
The Gold’s futures price closed this week around the $4,730 level and is still in a long-term strong uptrend. It has bounced back by almost 15% from the recent fall in March to the $4,100 level.
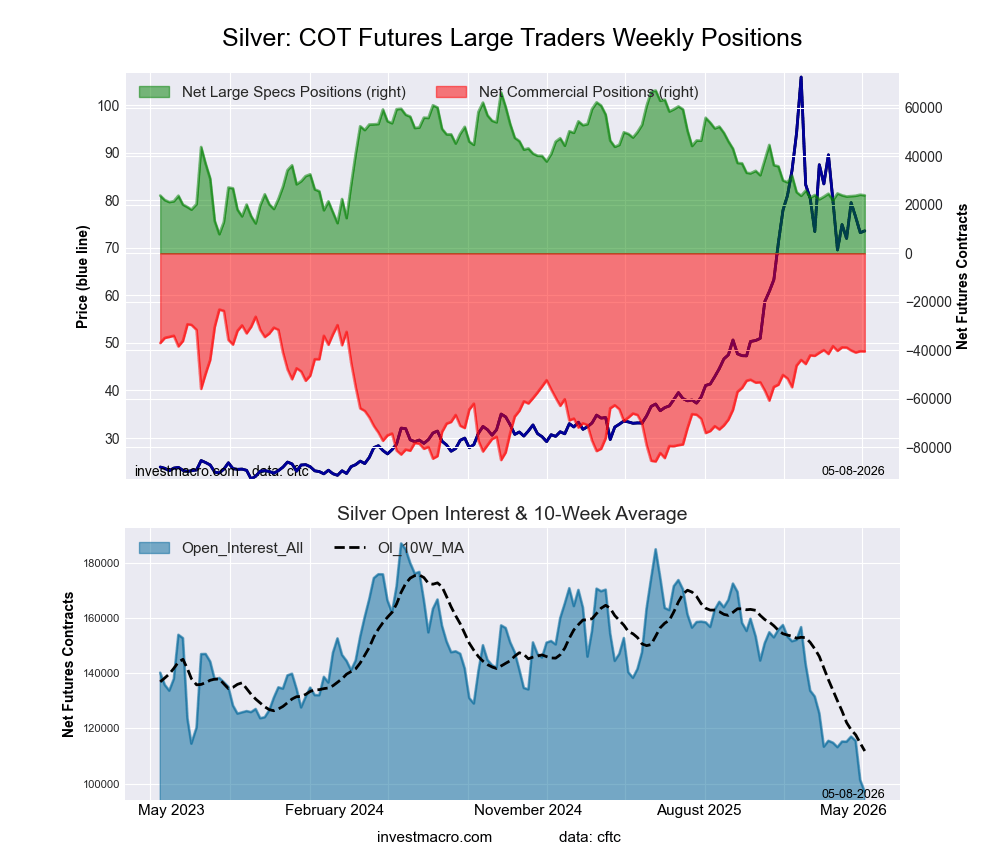
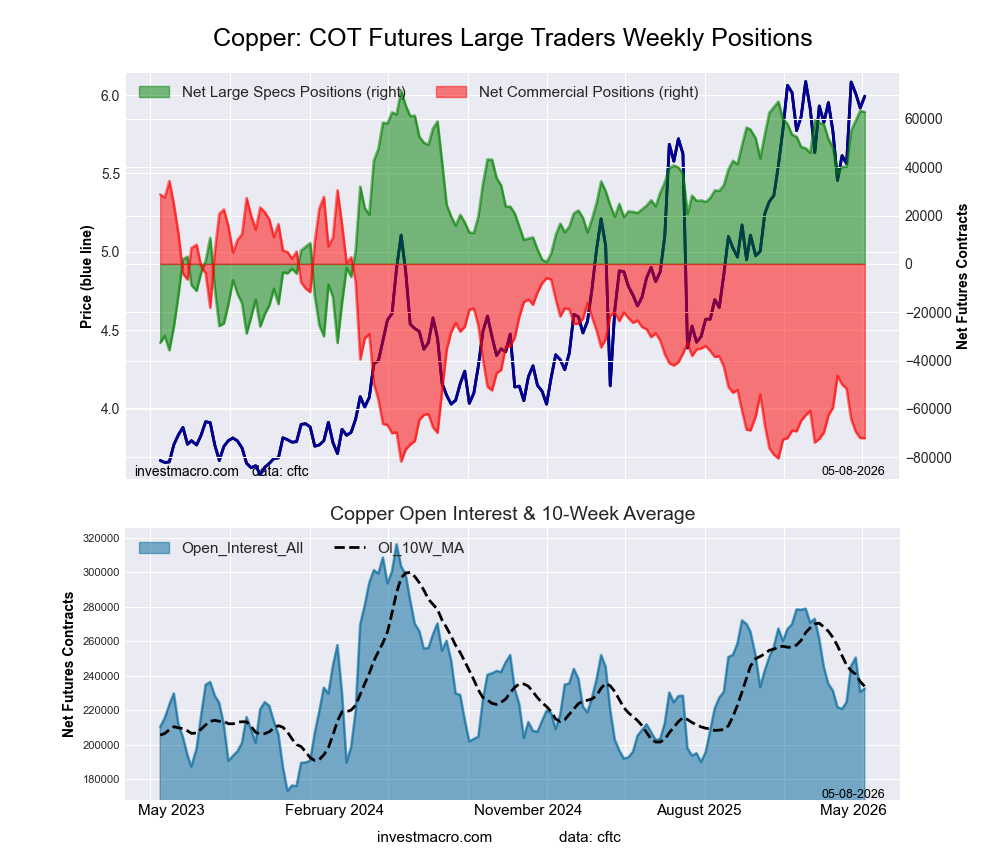
The last five days saw Silver come in with the biggest return in price performance for the overall Metals market. Silver rose by 6.08% for the week and has now notched a 10.86% increase over the past 30 days. Copper came in second with a 4.95% rise on the week and has been higher by 12.77% over the past 30 days.
Gold comes in third with a 2.38% gain on the week and has been just a bit higher at a 1.09% return over the past 30 days.
Platinum followed with a 1.96% gain this week, and Steel rounded out the weekly gainers with a 1.74% rise.
On the downside, Palladium dipped by -3.55%. Palladium is now also down by -0.24% over the past 30 days and has fallen by -26.62% in the past 90 days.
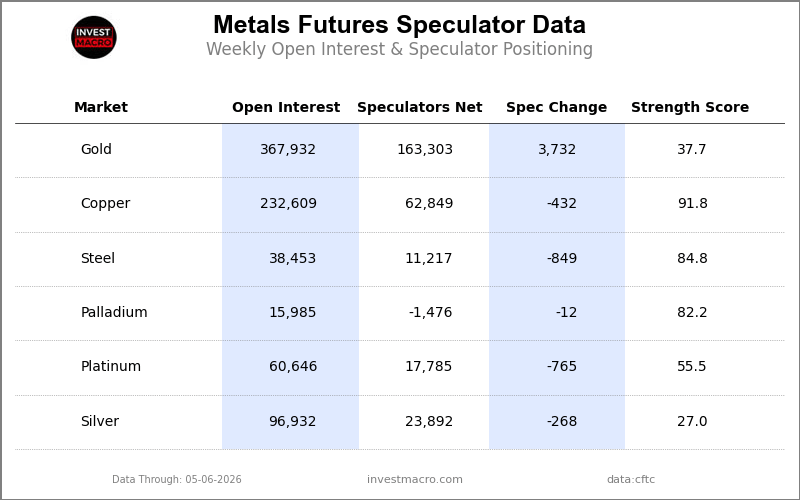
Legend: Weekly Speculators Change | Speculators Current Net Position | Speculators Strength Score compared to last 3-Years (0-100 range)
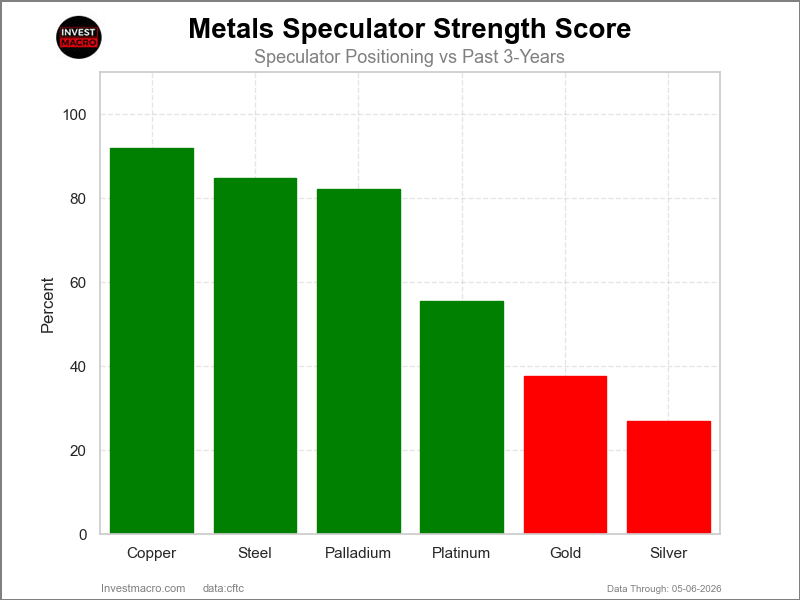
COT Strength Scores (a normalized measure of Speculator positions over a 3-Year range, from 0 to 100 where above 80 is Extreme-Bullish and below 20 is Extreme-Bearish) showed that Copper (92 percent) and Steel (85 percent) lead the metals markets this week. Palladium (82.2 percent) comes in as the next highest in the weekly strength scores.
On the downside, Silver (27 percent) and Gold (38 percent) come in at the lowest strength level currently.
Strength Statistics:
Gold (37.7 percent) vs Gold previous week (36.1 percent)
Silver (27.0 percent) vs Silver previous week (27.5 percent)
Copper (91.8 percent) vs Copper previous week (92.2 percent)
Platinum (55.5 percent) vs Platinum previous week (57.4 percent)
Palladium (82.2 percent) vs Palladium previous week (82.2 percent)
Steel (84.8 percent) vs Steel previous week (88.7 percent)
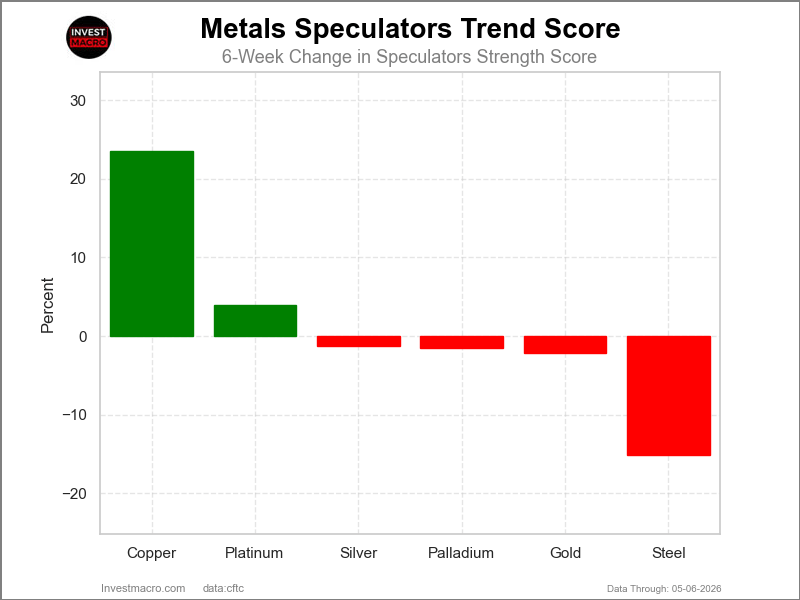
COT Strength Score Trends (or move index, calculates the 6-week changes in strength scores) showed that Copper (24 percent) and Platinum (4 percent) lead the past six weeks trends for metals.
Steel (-15 percent) leads the downside trend scores currently with Gold (-2.1 percent) as the next market with lower trend scores.
Move Statistics:
Gold (-2.1 percent) vs Gold previous week (-0.1 percent)
Silver (-1.3 percent) vs Silver previous week (3.8 percent)
Copper (23.6 percent) vs Copper previous week (14.2 percent)
Platinum (4.0 percent) vs Platinum previous week (4.1 percent)
Palladium (-1.5 percent) vs Palladium previous week (-8.4 percent)
Steel (-15.2 percent) vs Steel previous week (-8.5 percent)
Our weekly trend-following model classifies the current market price position as: Weak Uptrend.
| Gold Futures Statistics | SPECULATORS | COMMERCIALS | SMALL TRADERS |
| – Percent of Open Interest Longs: | 57.6 | 15.8 | 13.4 |
| – Percent of Open Interest Shorts: | 13.2 | 69.9 | 3.7 |
| – Net Position: | 163,303 | -198,935 | 35,632 |
| – Gross Longs: | 211,814 | 58,230 | 49,252 |
| – Gross Shorts: | 48,511 | 257,165 | 13,620 |
| – Long to Short Ratio: | 4.4 to 1 | 0.2 to 1 | 3.6 to 1 |
| NET POSITION TREND: | |||
| – Strength Index Score (3 Year Range Pct): | 37.7 | 56.5 | 70.1 |
| – Strength Index Reading (3 Year Range): | Bearish | Bullish | Bullish |
| NET POSITION MOVEMENT INDEX: | |||
| – 6-Week Change in Strength Index: | -2.1 | 2.0 | 0.4 |
Our weekly trend-following model classifies the current market price position as: Weak Downtrend.
| Silver Futures Statistics | SPECULATORS | COMMERCIALS | SMALL TRADERS |
| – Percent of Open Interest Longs: | 34.0 | 26.9 | 26.6 |
| – Percent of Open Interest Shorts: | 9.4 | 68.7 | 9.5 |
| – Net Position: | 23,892 | -40,535 | 16,643 |
| – Gross Longs: | 32,965 | 26,094 | 25,811 |
| – Gross Shorts: | 9,073 | 66,629 | 9,168 |
| – Long to Short Ratio: | 3.6 to 1 | 0.4 to 1 | 2.8 to 1 |
| NET POSITION TREND: | |||
| – Strength Index Score (3 Year Range Pct): | 27.0 | 72.4 | 44.3 |
| – Strength Index Reading (3 Year Range): | Bearish | Bullish | Bearish |
| NET POSITION MOVEMENT INDEX: | |||
| – 6-Week Change in Strength Index: | -1.3 | -0.4 | 5.7 |
Our weekly trend-following model classifies the current market price position as: Strong Uptrend.
| Copper Futures Statistics | SPECULATORS | COMMERCIALS | SMALL TRADERS |
| – Percent of Open Interest Longs: | 41.4 | 35.6 | 7.7 |
| – Percent of Open Interest Shorts: | 14.4 | 66.6 | 3.7 |
| – Net Position: | 62,849 | -72,017 | 9,168 |
| – Gross Longs: | 96,261 | 82,829 | 17,854 |
| – Gross Shorts: | 33,412 | 154,846 | 8,686 |
| – Long to Short Ratio: | 2.9 to 1 | 0.5 to 1 | 2.1 to 1 |
| NET POSITION TREND: | |||
| – Strength Index Score (3 Year Range Pct): | 91.8 | 8.4 | 61.7 |
| – Strength Index Reading (3 Year Range): | Bullish-Extreme | Bearish-Extreme | Bullish |
| NET POSITION MOVEMENT INDEX: | |||
| – 6-Week Change in Strength Index: | 23.6 | -22.2 | 2.1 |
Our weekly trend-following model classifies the current market price position as: Downtrend.
| Platinum Futures Statistics | SPECULATORS | COMMERCIALS | SMALL TRADERS |
| – Percent of Open Interest Longs: | 44.0 | 29.1 | 13.4 |
| – Percent of Open Interest Shorts: | 14.6 | 66.5 | 5.4 |
| – Net Position: | 17,785 | -22,651 | 4,866 |
| – Gross Longs: | 26,668 | 17,659 | 8,130 |
| – Gross Shorts: | 8,883 | 40,310 | 3,264 |
| – Long to Short Ratio: | 3.0 to 1 | 0.4 to 1 | 2.5 to 1 |
| NET POSITION TREND: | |||
| – Strength Index Score (3 Year Range Pct): | 55.5 | 48.1 | 54.6 |
| – Strength Index Reading (3 Year Range): | Bullish | Bearish | Bullish |
| NET POSITION MOVEMENT INDEX: | |||
| – 6-Week Change in Strength Index: | 4.0 | -2.3 | -7.9 |
Our weekly trend-following model classifies the current market price position as: Downtrend.
| Palladium Futures Statistics | SPECULATORS | COMMERCIALS | SMALL TRADERS |
| – Percent of Open Interest Longs: | 40.0 | 39.3 | 14.4 |
| – Percent of Open Interest Shorts: | 49.3 | 34.5 | 10.0 |
| – Net Position: | -1,476 | 775 | 701 |
| – Gross Longs: | 6,402 | 6,289 | 2,307 |
| – Gross Shorts: | 7,878 | 5,514 | 1,606 |
| – Long to Short Ratio: | 0.8 to 1 | 1.1 to 1 | 1.4 to 1 |
| NET POSITION TREND: | |||
| – Strength Index Score (3 Year Range Pct): | 82.2 | 22.4 | 44.4 |
| – Strength Index Reading (3 Year Range): | Bullish-Extreme | Bearish | Bearish |
| NET POSITION MOVEMENT INDEX: | |||
| – 6-Week Change in Strength Index: | -1.5 | 4.8 | -19.1 |
Our weekly trend-following model classifies the current market price position as: Uptrend.
| Steel Futures Statistics | SPECULATORS | COMMERCIALS | SMALL TRADERS |
| – Percent of Open Interest Longs: | 32.5 | 64.3 | 1.3 |
| – Percent of Open Interest Shorts: | 3.4 | 94.6 | 0.2 |
| – Net Position: | 11,217 | -11,631 | 414 |
| – Gross Longs: | 12,516 | 24,734 | 483 |
| – Gross Shorts: | 1,299 | 36,365 | 69 |
| – Long to Short Ratio: | 9.6 to 1 | 0.7 to 1 | 7.0 to 1 |
| NET POSITION TREND: | |||
| – Strength Index Score (3 Year Range Pct): | 84.8 | 15.1 | 89.9 |
| – Strength Index Reading (3 Year Range): | Bullish-Extreme | Bearish-Extreme | Bullish-Extreme |
| NET POSITION MOVEMENT INDEX: | |||
| – 6-Week Change in Strength Index: | -15.2 | 15.1 | -8.9 |
Article By InvestMacro – Receive our weekly COT Newsletter
*COT Report: The COT data, released weekly to the public each Friday, is updated through the most recent Tuesday (data is 3 days old) and shows a quick view of how large speculators or non-commercials (for-profit traders) were positioned in the futures markets.
The CFTC categorizes trader positions according to commercial hedgers (traders who use futures contracts for hedging as part of the business), non-commercials (large traders who speculate to realize trading profits) and nonreportable traders (usually small traders/speculators) as well as their open interest (contracts open in the market at time of reporting). See CFTC criteria here.
By JustMarkets On Thursday, the US stock indices posted strong gains, fully recovering from the…
By Analytical Department RoboForex USD/JPY recovered to 160.60 on Friday following a sharp drop the…
By Patrick J. Schena, Tufts University Creating a government fund to own AI stock and…
By JustMarkets The US equity indices ended Wednesday’s session with notable declines as geopolitical risks…
By Analytical Department RoboForex USD/JPY held near 163.50 on Thursday, with the yen retreating slightly…
By Analytical Department RoboForex GBP/USD continued to consolidate at 1.3283 on Wednesday. The British pound…
This website uses cookies.