
By InvestMacro
Here are the latest charts and statistics for the Commitment of Traders (COT) reports data published by the Commodities Futures Trading Commission (CFTC).
The latest COT data is updated through Tuesday May 5th and shows a quick view of how large traders (for-profit speculators and commercial hedgers) were positioned in the futures markets.
Weekly Speculator Changes led by 5-Year Bonds & Fed Funds
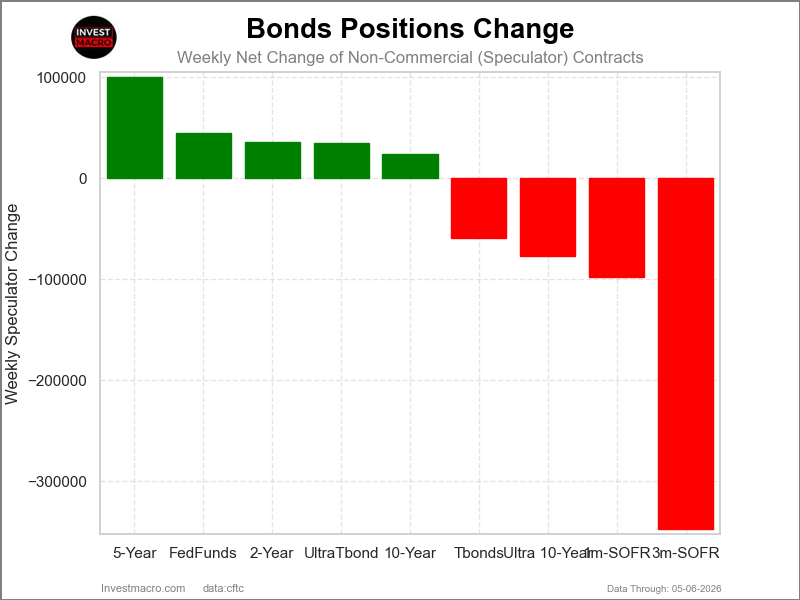
The COT bond market speculator bets were slightly higher this week as five out of the nine bond markets we cover had higher positioning while the other four markets had lower speculator contracts.
Leading the gains for the bond markets was the 5-Year Bonds (100,106 contracts) with the Fed Funds (45,127 contracts), the 2-Year Bonds (35,934 contracts), the Ultra Treasury Bonds (34,850 contracts) and the 10-Year Bonds (23,868 contracts) also showing positive weeks.
The bond markets with declines in speculator bets for the week were the SOFR 3-Months (-347,436 contracts), the SOFR 1-Month (-97,991 contracts), the Ultra 10-Year Bonds (-77,320 contracts) and the US Treasury Bonds (-59,287 contracts) also registering lower bets on the week.
Free Reports:
 Sign Up for Our Stock Market Newsletter – Get updated on News, Charts & Rankings of Public Companies when you join our Stocks Newsletter
 Get our Weekly Commitment of Traders Reports - See where the biggest traders (Hedge Funds and Commercial Hedgers) are positioned in the futures markets on a weekly basis.
The US Treasury Bond leads Bond market price performances this week.
In the major Bond markets for the US, the US Treasury Bond saw the biggest uptick this week with a 0.53% increase. The 10-Year Note came in second with a 0.17% edge higher, followed by the Five-Year Bond, which notched up by 0.06%. The One-Month SOFR and the Three-Month SOFR markets were both virtually unchanged but edged up by 0.01%.
The Fed Funds were a minuscule tick lower with a -0.01% decline.
Bonds Data:
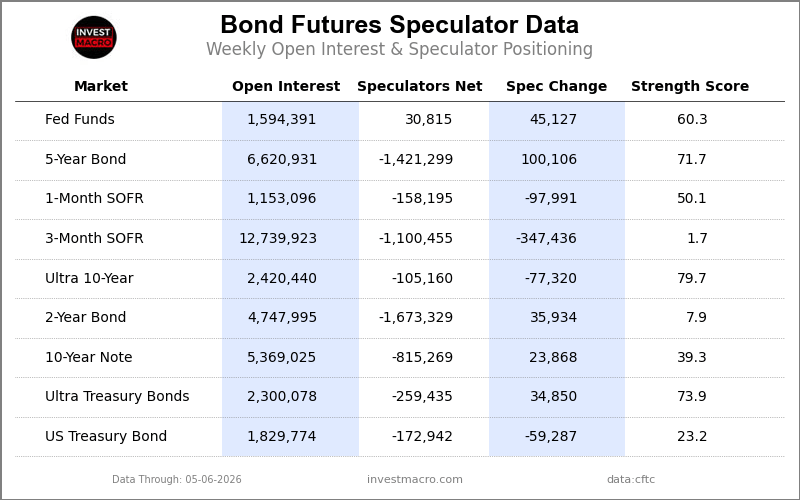
Legend: Open Interest | Speculators Current Net Position | Weekly Specs Change | Specs Strength Score compared to last 3-Years (0-100 range)
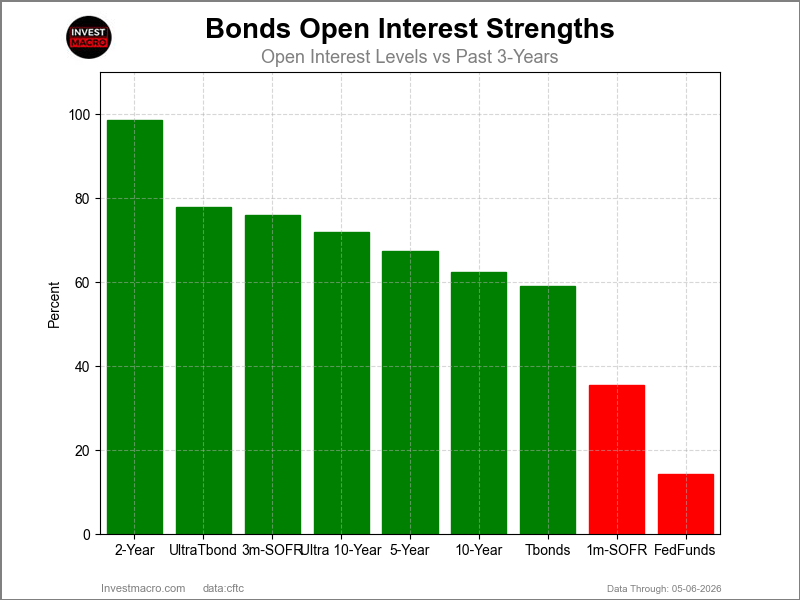
Strength Scores led by Ultra 10-Year Bonds & Ultra Treasury Bonds
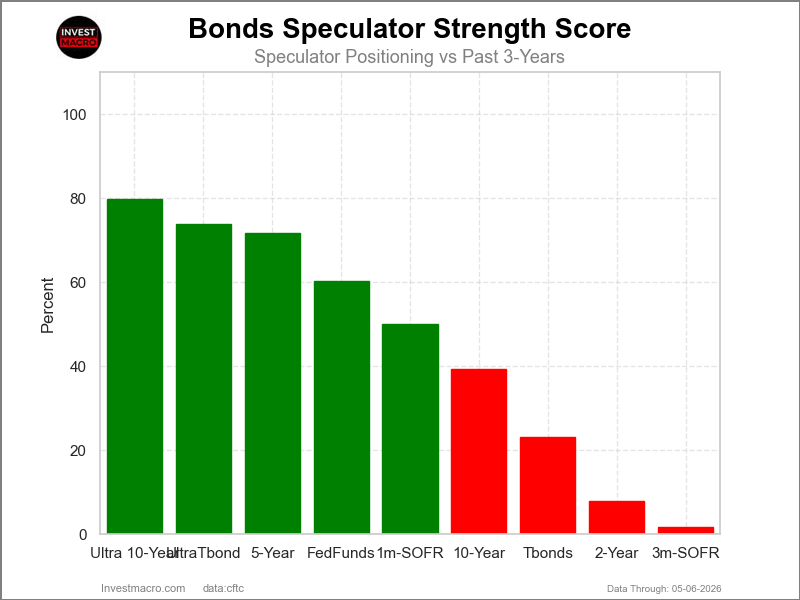
COT Strength Scores (a normalized measure of Speculator positions over a 3-Year range, from 0 to 100 where above 80 is Extreme-Bullish and below 20 is Extreme-Bearish) showed that the Ultra 10-Year Bonds (80 percent) and the Ultra Treasury Bonds (74 percent) lead the bond markets this week. The 5-Year Bonds (72 percent) comes in as the next highest in the weekly strength scores.
On the downside, the SOFR 3-Months (1.7 percent) and the 2-Year Bonds (8 percent) come in at the lowest strength level currently and are in Extreme-Bearish territory (below 20 percent). The next lowest strength scores were the US Treasury Bonds (23 percent), the 10-Year Bonds (39 percent) and the SOFR 1-Month (50 percent).
Strength Statistics:
Fed Funds (60.3 percent) vs Fed Funds previous week (53.8 percent)
2-Year Bond (7.9 percent) vs 2-Year Bond previous week (3.8 percent)
5-Year Bond (71.7 percent) vs 5-Year Bond previous week (66.0 percent)
10-Year Bond (39.3 percent) vs 10-Year Bond previous week (36.4 percent)
Ultra 10-Year Bond (79.7 percent) vs Ultra 10-Year Bond previous week (100.0 percent)
US Treasury Bond (23.2 percent) vs US Treasury Bond previous week (43.8 percent)
Ultra US Treasury Bond (73.9 percent) vs Ultra US Treasury Bond previous week (60.8 percent)
SOFR 1-Month (50.1 percent) vs SOFR 1-Month previous week (67.2 percent)
SOFR 3-Months (1.7 percent) vs SOFR 3-Months previous week (20.0 percent)
Ultra 10-Year Bonds & Fed Funds top the 6-Week Strength Trends
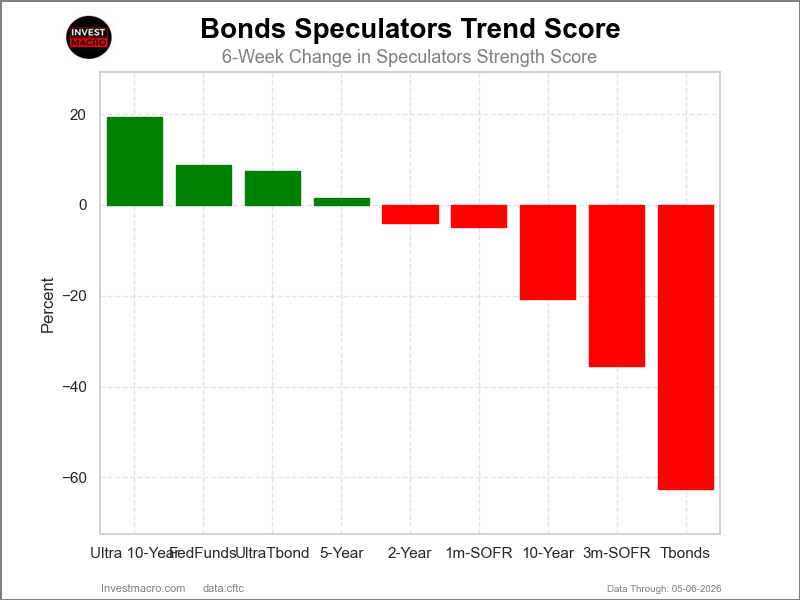
COT Strength Score Trends (or move index, calculates the 6-week changes in strength scores) showed that the Ultra 10-Year Bonds (19 percent) and the Fed Funds (9 percent) lead the past six weeks trends for bonds. The Ultra Treasury Bonds (7 percent) are the next highest positive movers in the latest trends data.
The US Treasury Bond (-62.5 percent) leads the downside trend scores currently with the SOFR 3-Months (-35 percent) following next with lower trend scores.
Strength Trend Statistics:
Fed Funds (8.9 percent) vs Fed Funds previous week (1.3 percent)
2-Year Bond (-4.0 percent) vs 2-Year Bond previous week (-25.5 percent)
5-Year Bond (1.5 percent) vs 5-Year Bond previous week (14.3 percent)
10-Year Bond (-20.7 percent) vs 10-Year Bond previous week (-28.9 percent)
Ultra 10-Year Bond (19.3 percent) vs Ultra 10-Year Bond previous week (46.8 percent)
US Treasury Bond (-62.5 percent) vs US Treasury Bond previous week (-42.6 percent)
Ultra US Treasury Bond (7.4 percent) vs Ultra US Treasury Bond previous week (-8.7 percent)
SOFR 1-Month (-4.8 percent) vs SOFR 1-Month previous week (22.5 percent)
SOFR 3-Months (-35.5 percent) vs SOFR 3-Months previous week (-10.2 percent)
30-Day Federal Funds Futures:
 Positioning Notes:
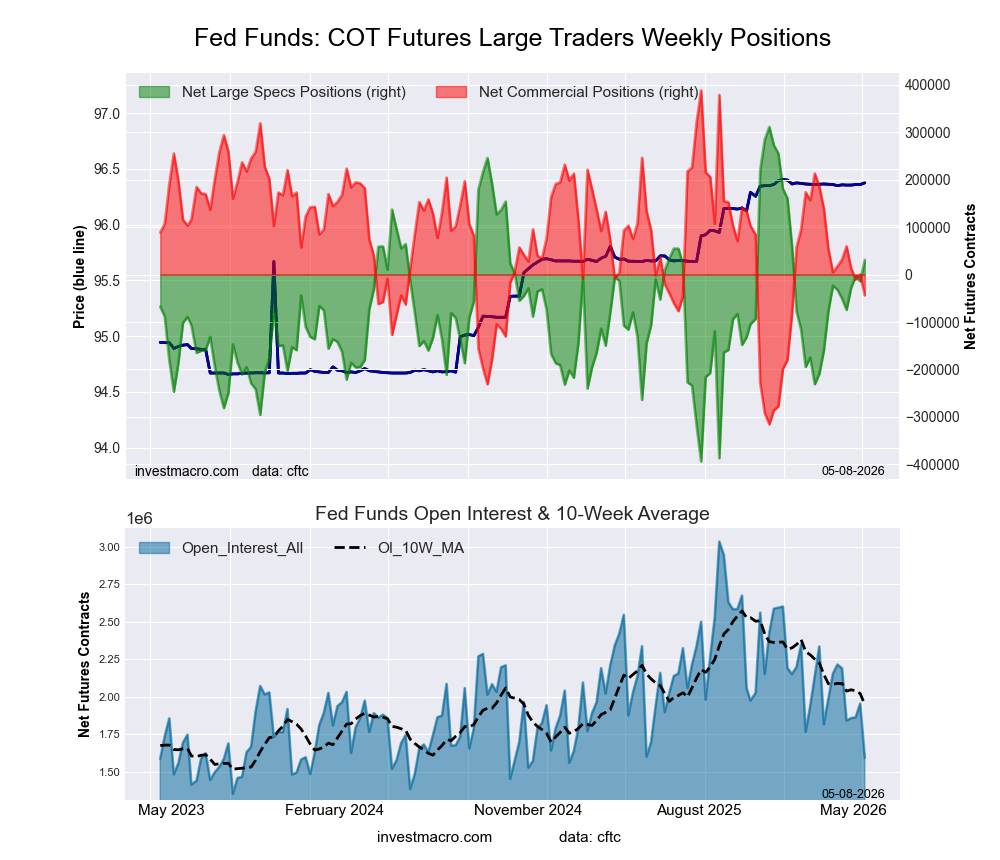
- 30-Day Federal Funds large speculator standing this week was a net position of 30,815 contracts in the data reported through Tuesday.
- Weekly Speculator position boost of 45,127 contracts from the previous week which had a total of -14,312 net contracts.
- This week’s current strength score (range over the past 3 years, measured from 0 to 100) shows the speculators are currently Bullish with a score of 60.3 percent.
- The Commercials are Bearish with a score of 38.6 percent.
- The Small Traders (not shown in chart) are Bullish with a score of 71.3 percent.
Price Trend-Following Model: Weak Uptrend
Our weekly trend-following model classifies the current market price position as: Weak Uptrend.
| 30-Day Federal Funds Statistics | SPECULATORS | COMMERCIALS | SMALL TRADERS |
| – Percent of Open Interest Longs: | 14.6 | 63.9 | 2.5 |
| – Percent of Open Interest Shorts: | 12.6 | 66.7 | 1.7 |
| – Net Position: | 30,815 | -43,823 | 13,008 |
| – Gross Longs: | 232,066 | 1,019,087 | 40,483 |
| – Gross Shorts: | 201,251 | 1,062,910 | 27,475 |
| – Long to Short Ratio: | 1.2 to 1 | 1.0 to 1 | 1.5 to 1 |
| NET POSITION TREND: | |||
| – Strength Index Score (3 Year Range Pct): | 60.3 | 38.6 | 71.3 |
| – Strength Index Reading (3 Year Range): | Bullish | Bearish | Bullish |
| NET POSITION MOVEMENT INDEX: | |||
| – 6-Week Change in Strength Index: | 8.9 | -8.7 | -2.5 |
Secured Overnight Financing Rate (3-Month) Futures:
 Positioning Notes:
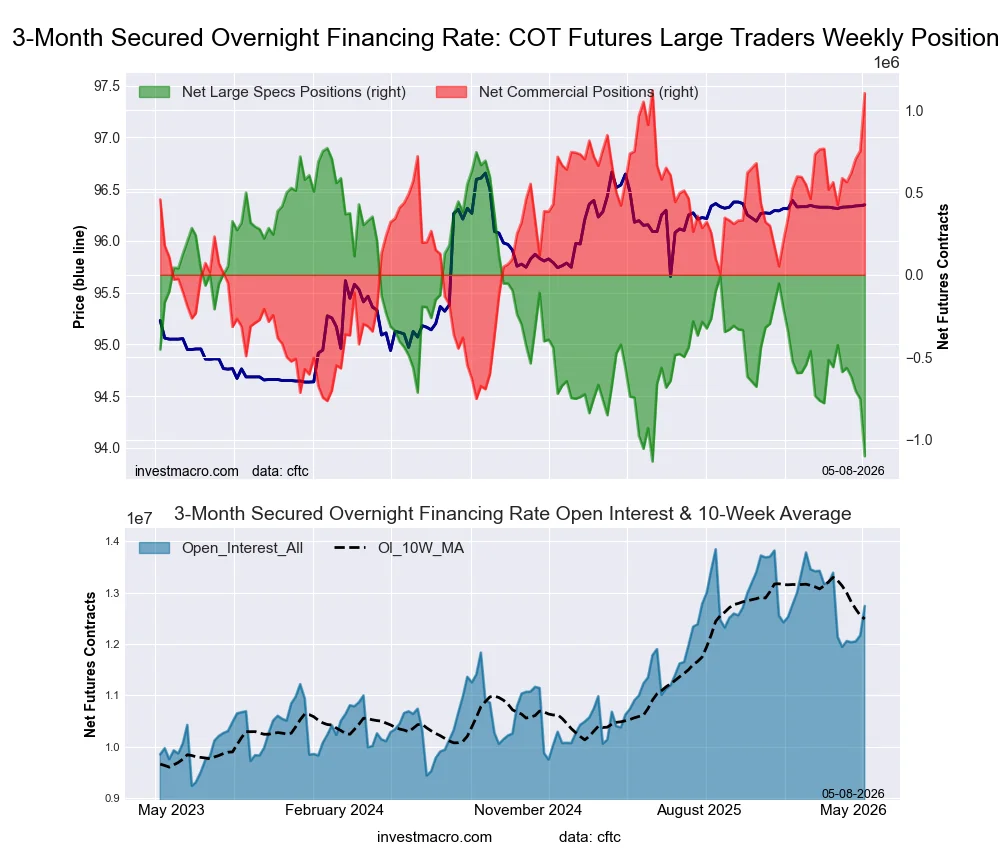
- Secured Overnight Financing Rate (3-Month) large speculator standing this week was a net position of -1,100,455 contracts in the data reported through Tuesday.
- Weekly Speculator position lowering of -347,436 contracts from the previous week which had a total of -753,019 net contracts.
- This week’s current strength score (range over the past 3 years, measured from 0 to 100) shows the speculators are currently Bearish-Extreme with a score of 1.7 percent.
- The Commercials are Bullish-Extreme with a score of 99.2 percent.
- The Small Traders (not shown in chart) are Bearish with a score of 37.0 percent.
Price Trend-Following Model: Weak Uptrend
Our weekly trend-following model classifies the current market price position as: Weak Uptrend.
| SOFR 3-Months Statistics | SPECULATORS | COMMERCIALS | SMALL TRADERS |
| – Percent of Open Interest Longs: | 14.2 | 62.1 | 0.4 |
| – Percent of Open Interest Shorts: | 22.9 | 53.5 | 0.4 |
| – Net Position: | -1,100,455 | 1,102,960 | -2,505 |
| – Gross Longs: | 1,813,618 | 7,914,410 | 46,774 |
| – Gross Shorts: | 2,914,073 | 6,811,450 | 49,279 |
| – Long to Short Ratio: | 0.6 to 1 | 1.2 to 1 | 0.9 to 1 |
| NET POSITION TREND: | |||
| – Strength Index Score (3 Year Range Pct): | 1.7 | 99.2 | 37.0 |
| – Strength Index Reading (3 Year Range): | Bearish-Extreme | Bullish-Extreme | Bearish |
| NET POSITION MOVEMENT INDEX: | |||
| – 6-Week Change in Strength Index: | -35.5 | 36.0 | -5.4 |
Secured Overnight Financing Rate (1-Month) Futures:
 Positioning Notes:
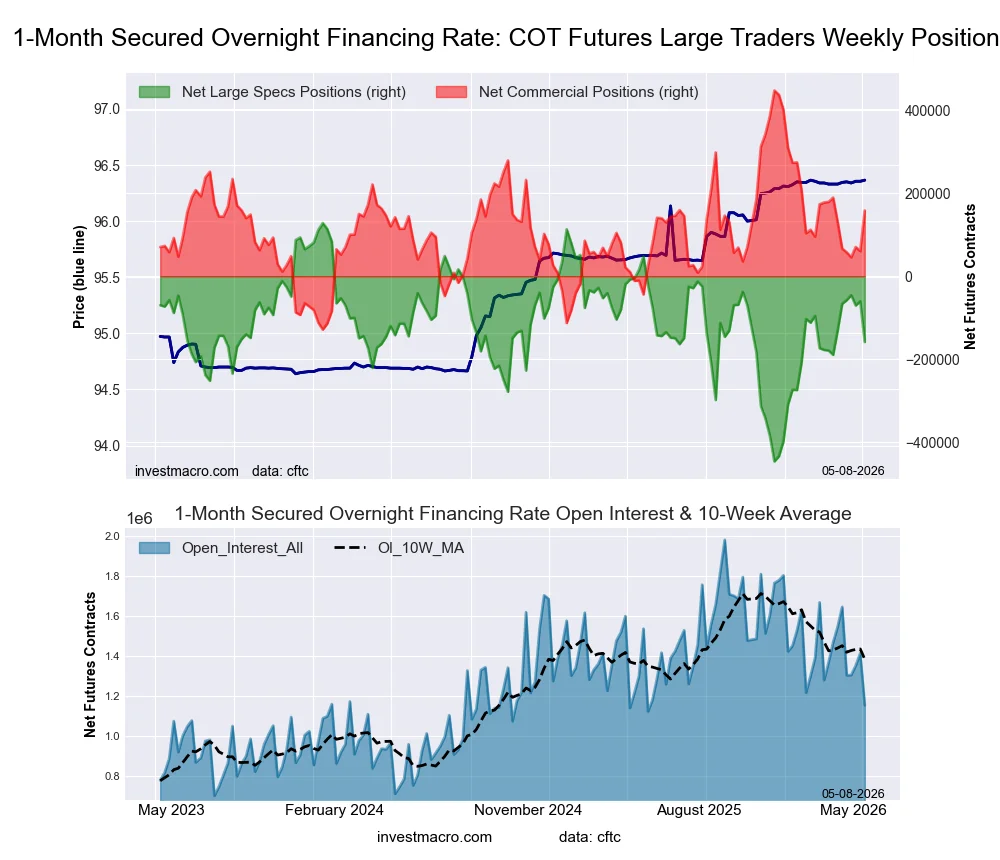
- Secured Overnight Financing Rate (1-Month) large speculator standing this week was a net position of -158,195 contracts in the data reported through Tuesday.
- Weekly Speculator position fall of -97,991 contracts from the previous week which had a total of -60,204 net contracts.
- This week’s current strength score (range over the past 3 years, measured from 0 to 100) shows the speculators are currently Bullish with a score of 50.1 percent.
- The Commercials are Bearish with a score of 49.8 percent.
- The Small Traders (not shown in chart) are Bullish with a score of 66.9 percent.
Price Trend-Following Model: Uptrend
Our weekly trend-following model classifies the current market price position as: Uptrend.
| SOFR 1-Month Statistics | SPECULATORS | COMMERCIALS | SMALL TRADERS |
| – Percent of Open Interest Longs: | 15.8 | 67.8 | 0.1 |
| – Percent of Open Interest Shorts: | 29.5 | 54.1 | 0.1 |
| – Net Position: | -158,195 | 158,160 | 35 |
| – Gross Longs: | 182,424 | 781,598 | 1,383 |
| – Gross Shorts: | 340,619 | 623,438 | 1,348 |
| – Long to Short Ratio: | 0.5 to 1 | 1.3 to 1 | 1.0 to 1 |
| NET POSITION TREND: | |||
| – Strength Index Score (3 Year Range Pct): | 50.1 | 49.8 | 66.9 |
| – Strength Index Reading (3 Year Range): | Bullish | Bearish | Bullish |
| NET POSITION MOVEMENT INDEX: | |||
| – 6-Week Change in Strength Index: | -4.8 | 4.8 | 0.3 |
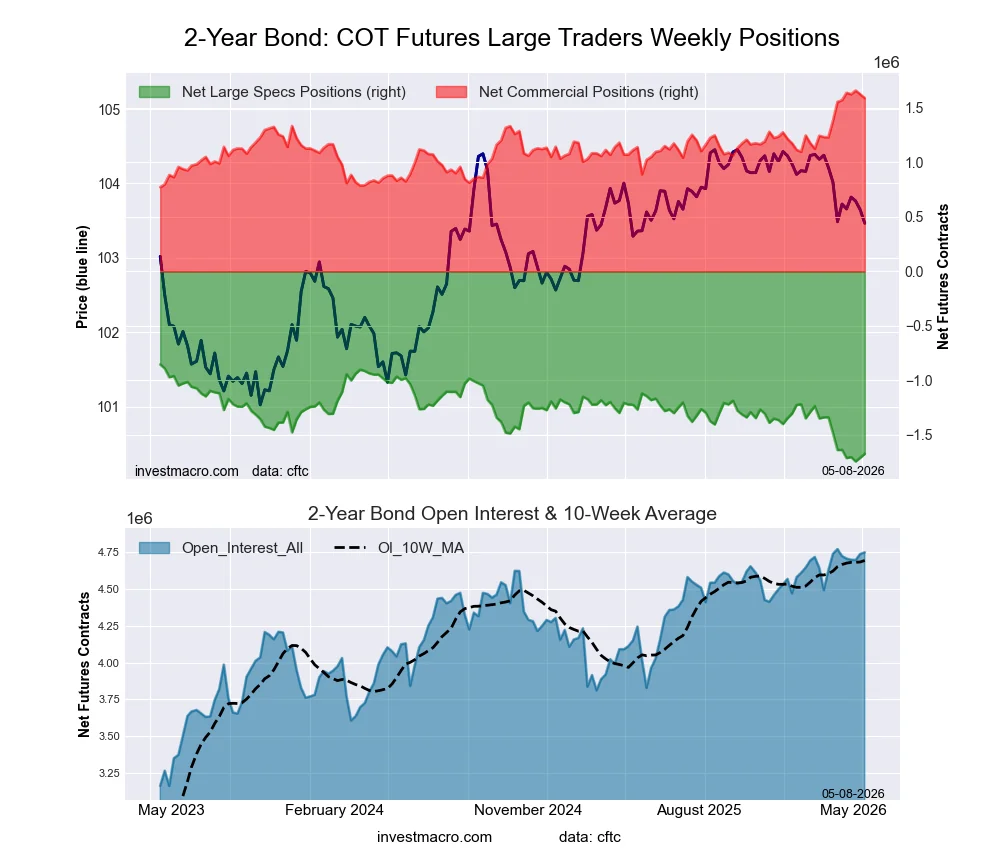
2-Year Treasury Note Futures:
 Positioning Notes:
- 2-Year Treasury Note large speculator standing this week was a net position of -1,673,329 contracts in the data reported through Tuesday.
- Weekly Speculator position advance of 35,934 contracts from the previous week which had a total of -1,709,263 net contracts.
- This week’s current strength score (range over the past 3 years, measured from 0 to 100) shows the speculators are currently Bearish-Extreme with a score of 7.9 percent.
- The Commercials are Bullish-Extreme with a score of 92.1 percent.
- The Small Traders (not shown in chart) are Bearish-Extreme with a score of 10.9 percent.
Price Trend-Following Model: Strong Downtrend
Our weekly trend-following model classifies the current market price position as: Strong Downtrend.
| 2-Year Treasury Note Statistics | SPECULATORS | COMMERCIALS | SMALL TRADERS |
| – Percent of Open Interest Longs: | 10.5 | 80.5 | 4.8 |
| – Percent of Open Interest Shorts: | 45.7 | 47.0 | 3.1 |
| – Net Position: | -1,673,329 | 1,590,309 | 83,020 |
| – Gross Longs: | 497,399 | 3,820,890 | 228,341 |
| – Gross Shorts: | 2,170,728 | 2,230,581 | 145,321 |
| – Long to Short Ratio: | 0.2 to 1 | 1.7 to 1 | 1.6 to 1 |
| NET POSITION TREND: | |||
| – Strength Index Score (3 Year Range Pct): | 7.9 | 92.1 | 10.9 |
| – Strength Index Reading (3 Year Range): | Bearish-Extreme | Bullish-Extreme | Bearish-Extreme |
| NET POSITION MOVEMENT INDEX: | |||
| – 6-Week Change in Strength Index: | -4.0 | 3.9 | 0.4 |
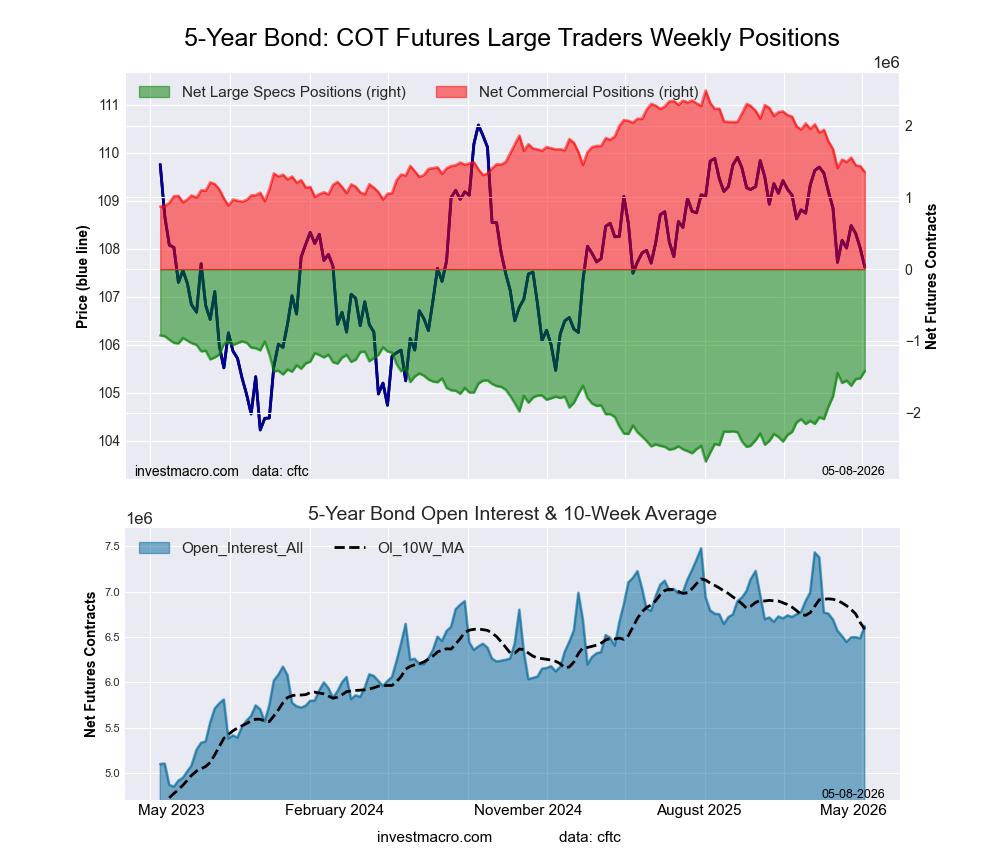
5-Year Treasury Note Futures:
 Positioning Notes:
- 5-Year Treasury Note large speculator standing this week was a net position of -1,421,299 contracts in the data reported through Tuesday.
- Weekly Speculator position rise of 100,106 contracts from the previous week which had a total of -1,521,405 net contracts.
- This week’s current strength score (range over the past 3 years, measured from 0 to 100) shows the speculators are currently Bullish with a score of 71.7 percent.
- The Commercials are Bearish with a score of 29.7 percent.
- The Small Traders (not shown in chart) are Bearish with a score of 26.6 percent.
Price Trend-Following Model: Strong Downtrend
Our weekly trend-following model classifies the current market price position as: Strong Downtrend.
| 5-Year Treasury Note Statistics | SPECULATORS | COMMERCIALS | SMALL TRADERS |
| – Percent of Open Interest Longs: | 9.6 | 80.5 | 6.3 |
| – Percent of Open Interest Shorts: | 31.1 | 60.1 | 5.3 |
| – Net Position: | -1,421,299 | 1,352,390 | 68,909 |
| – Gross Longs: | 636,574 | 5,331,093 | 419,738 |
| – Gross Shorts: | 2,057,873 | 3,978,703 | 350,829 |
| – Long to Short Ratio: | 0.3 to 1 | 1.3 to 1 | 1.2 to 1 |
| NET POSITION TREND: | |||
| – Strength Index Score (3 Year Range Pct): | 71.7 | 29.7 | 26.6 |
| – Strength Index Reading (3 Year Range): | Bullish | Bearish | Bearish |
| NET POSITION MOVEMENT INDEX: | |||
| – 6-Week Change in Strength Index: | 1.5 | -3.5 | 12.1 |
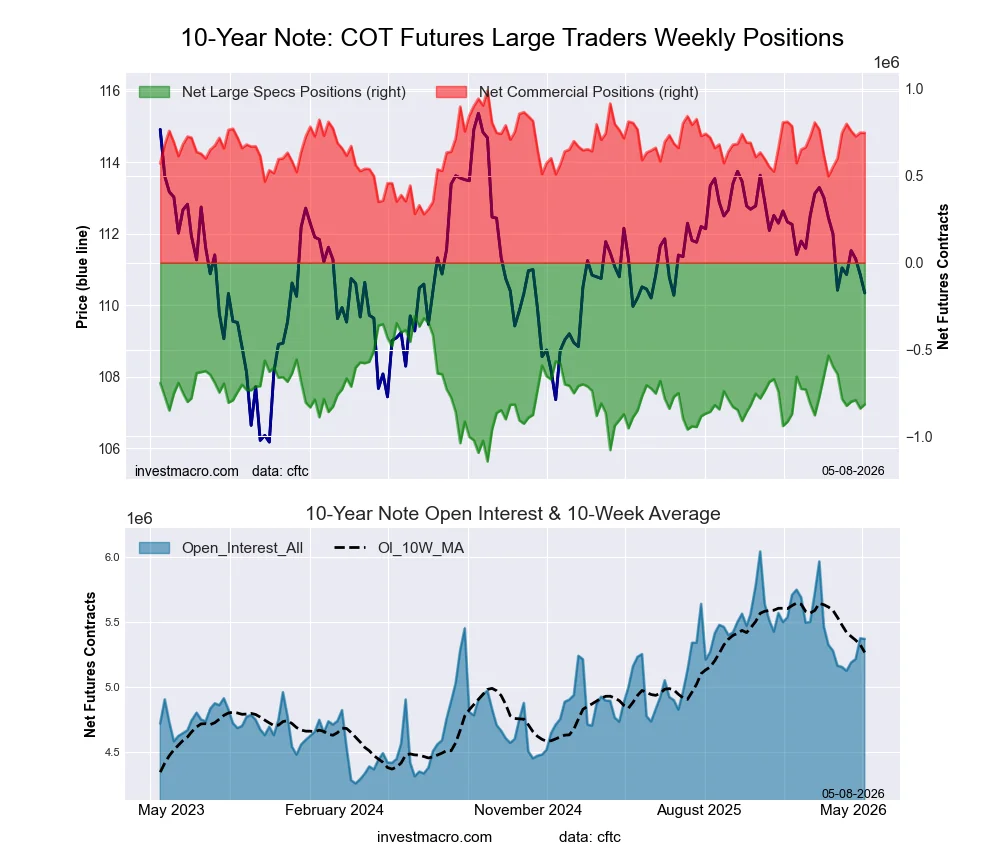
10-Year Treasury Note Futures:
 Positioning Notes:
- 10-Year Treasury Note large speculator standing this week was a net position of -815,269 contracts in the data reported through Tuesday.
- Weekly Speculator position rise of 23,868 contracts from the previous week which had a total of -839,137 net contracts.
- This week’s current strength score (range over the past 3 years, measured from 0 to 100) shows the speculators are currently Bearish with a score of 39.3 percent.
- The Commercials are Bullish with a score of 65.8 percent.
- The Small Traders (not shown in chart) are Bearish with a score of 45.2 percent.
Price Trend-Following Model: Strong Downtrend
Our weekly trend-following model classifies the current market price position as: Strong Downtrend.
| 10-Year Treasury Note Statistics | SPECULATORS | COMMERCIALS | SMALL TRADERS |
| – Percent of Open Interest Longs: | 11.4 | 77.5 | 7.8 |
| – Percent of Open Interest Shorts: | 26.6 | 63.5 | 6.5 |
| – Net Position: | -815,269 | 747,343 | 67,926 |
| – Gross Longs: | 610,543 | 4,158,508 | 418,672 |
| – Gross Shorts: | 1,425,812 | 3,411,165 | 350,746 |
| – Long to Short Ratio: | 0.4 to 1 | 1.2 to 1 | 1.2 to 1 |
| NET POSITION TREND: | |||
| – Strength Index Score (3 Year Range Pct): | 39.3 | 65.8 | 45.2 |
| – Strength Index Reading (3 Year Range): | Bearish | Bullish | Bearish |
| NET POSITION MOVEMENT INDEX: | |||
| – 6-Week Change in Strength Index: | -20.7 | 20.7 | 12.8 |
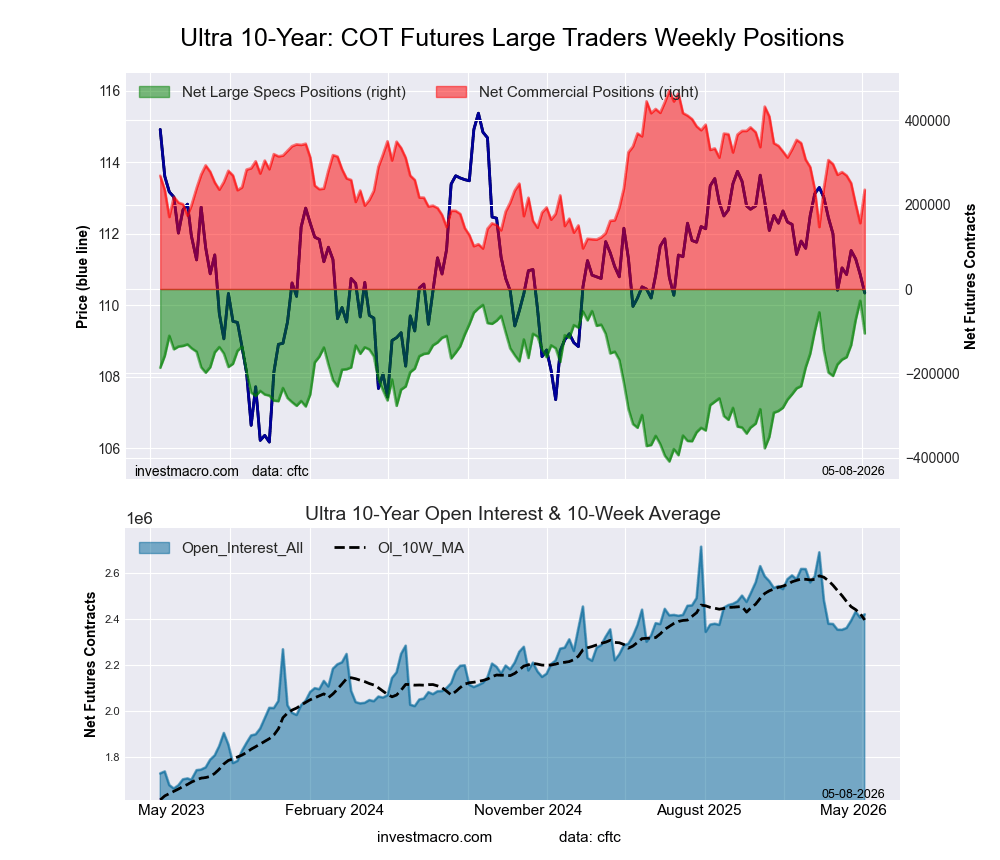
Ultra 10-Year Notes Futures:
 Positioning Notes:
- Ultra 10-Year Notes large speculator standing this week was a net position of -105,160 contracts in the data reported through Tuesday.
- Weekly Speculator position decrease of -77,320 contracts from the previous week which had a total of -27,840 net contracts.
- This week’s current strength score (range over the past 3 years, measured from 0 to 100) shows the speculators are currently Bullish with a score of 79.7 percent.
- The Commercials are Bearish with a score of 37.2 percent.
- The Small Traders (not shown in chart) are Bearish-Extreme with a score of 5.3 percent.
Price Trend-Following Model: Strong Downtrend
Our weekly trend-following model classifies the current market price position as: Strong Downtrend.
| Ultra 10-Year Notes Statistics | SPECULATORS | COMMERCIALS | SMALL TRADERS |
| – Percent of Open Interest Longs: | 9.4 | 81.3 | 8.3 |
| – Percent of Open Interest Shorts: | 13.8 | 71.6 | 13.6 |
| – Net Position: | -105,160 | 234,926 | -129,766 |
| – Gross Longs: | 228,236 | 1,968,305 | 200,190 |
| – Gross Shorts: | 333,396 | 1,733,379 | 329,956 |
| – Long to Short Ratio: | 0.7 to 1 | 1.1 to 1 | 0.6 to 1 |
| NET POSITION TREND: | |||
| – Strength Index Score (3 Year Range Pct): | 79.7 | 37.2 | 5.3 |
| – Strength Index Reading (3 Year Range): | Bullish | Bearish | Bearish-Extreme |
| NET POSITION MOVEMENT INDEX: | |||
| – 6-Week Change in Strength Index: | 19.3 | -9.5 | -29.6 |
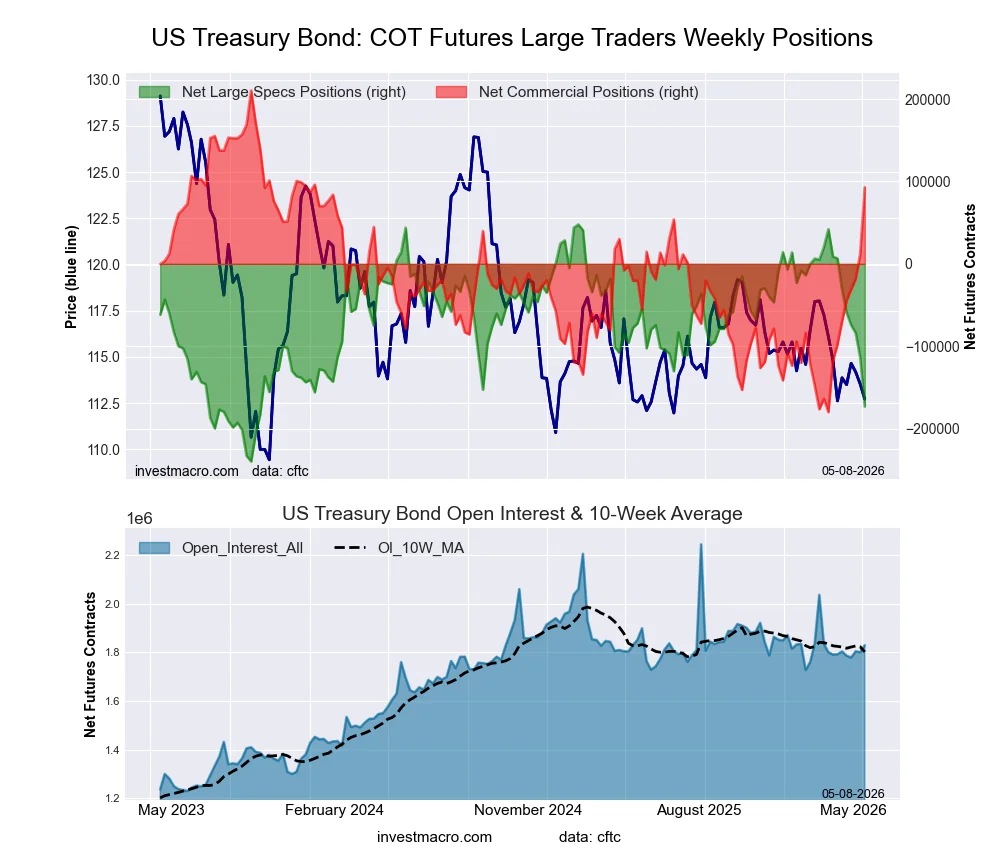
US Treasury Bonds Futures:
 Positioning Notes:
- US Treasury Bonds large speculator standing this week was a net position of -172,942 contracts in the data reported through Tuesday.
- Weekly Speculator position decline of -59,287 contracts from the previous week which had a total of -113,655 net contracts.
- This week’s current strength score (range over the past 3 years, measured from 0 to 100) shows the speculators are currently Bearish with a score of 23.2 percent.
- The Commercials are Bullish with a score of 69.9 percent.
- The Small Traders (not shown in chart) are Bearish with a score of 36.4 percent.
Price Trend-Following Model: Downtrend
Our weekly trend-following model classifies the current market price position as: Downtrend.
| US Treasury Bonds Statistics | SPECULATORS | COMMERCIALS | SMALL TRADERS |
| – Percent of Open Interest Longs: | 9.9 | 76.3 | 12.8 |
| – Percent of Open Interest Shorts: | 19.4 | 71.2 | 8.5 |
| – Net Position: | -172,942 | 93,024 | 79,918 |
| – Gross Longs: | 181,128 | 1,395,908 | 234,966 |
| – Gross Shorts: | 354,070 | 1,302,884 | 155,048 |
| – Long to Short Ratio: | 0.5 to 1 | 1.1 to 1 | 1.5 to 1 |
| NET POSITION TREND: | |||
| – Strength Index Score (3 Year Range Pct): | 23.2 | 69.9 | 36.4 |
| – Strength Index Reading (3 Year Range): | Bearish | Bullish | Bearish |
| NET POSITION MOVEMENT INDEX: | |||
| – 6-Week Change in Strength Index: | -62.5 | 48.9 | -7.7 |
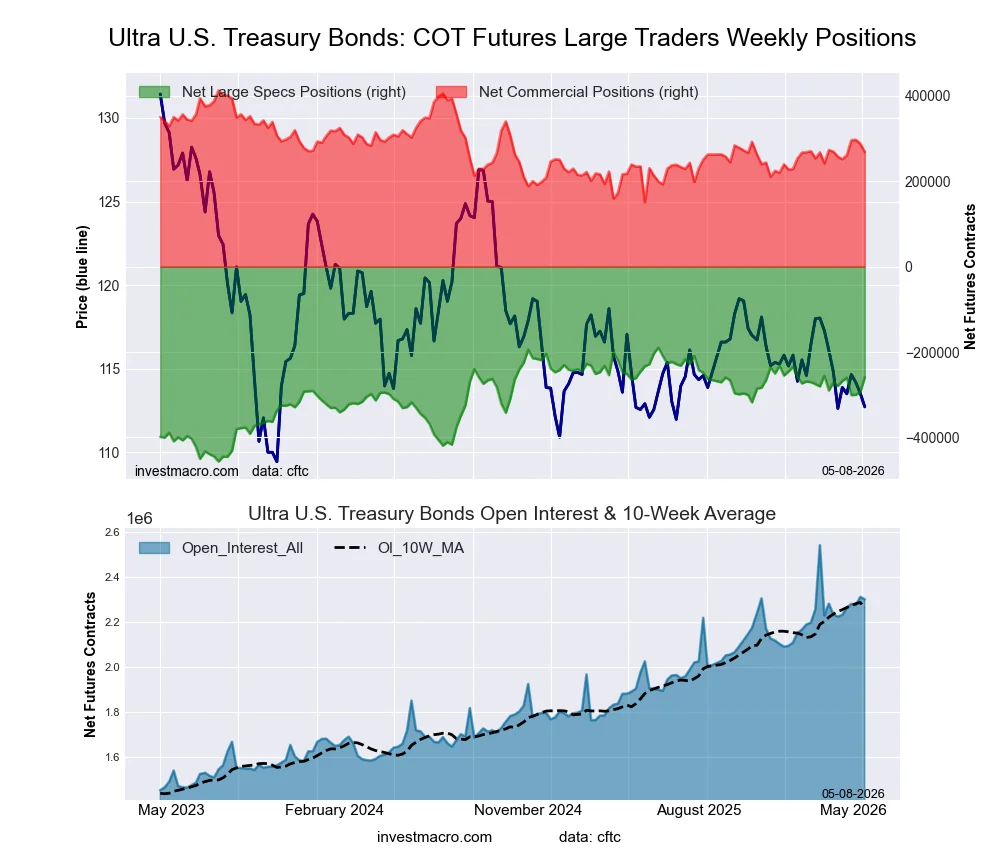
Ultra US Treasury Bonds Futures:
 Positioning Notes:
- Ultra US Treasury Bonds large speculator standing this week was a net position of -259,435 contracts in the data reported through Tuesday.
- Weekly Speculator position advance of 34,850 contracts from the previous week which had a total of -294,285 net contracts.
- This week’s current strength score (range over the past 3 years, measured from 0 to 100) shows the speculators are currently Bullish with a score of 73.9 percent.
- The Commercials are Bearish with a score of 45.1 percent.
- The Small Traders (not shown in chart) are Bearish-Extreme with a score of 5.4 percent.
Price Trend-Following Model: Downtrend
Our weekly trend-following model classifies the current market price position as: Downtrend.
| Ultra US Treasury Bonds Statistics | SPECULATORS | COMMERCIALS | SMALL TRADERS |
| – Percent of Open Interest Longs: | 5.9 | 85.4 | 7.8 |
| – Percent of Open Interest Shorts: | 17.2 | 73.7 | 8.2 |
| – Net Position: | -259,435 | 268,886 | -9,451 |
| – Gross Longs: | 136,694 | 1,964,862 | 179,461 |
| – Gross Shorts: | 396,129 | 1,695,976 | 188,912 |
| – Long to Short Ratio: | 0.3 to 1 | 1.2 to 1 | 0.9 to 1 |
| NET POSITION TREND: | |||
| – Strength Index Score (3 Year Range Pct): | 73.9 | 45.1 | 5.4 |
| – Strength Index Reading (3 Year Range): | Bullish | Bearish | Bearish-Extreme |
| NET POSITION MOVEMENT INDEX: | |||
| – 6-Week Change in Strength Index: | 7.4 | 4.3 | -31.9 |
Article By InvestMacro – Receive our weekly COT Newsletter
*COT Report: The COT data, released weekly to the public each Friday, is updated through the most recent Tuesday (data is 3 days old) and shows a quick view of how large speculators or non-commercials (for-profit traders) were positioned in the futures markets.
The CFTC categorizes trader positions according to commercial hedgers (traders who use futures contracts for hedging as part of the business), non-commercials (large traders who speculate to realize trading profits) and nonreportable traders (usually small traders/speculators) as well as their open interest (contracts open in the market at time of reporting). See CFTC criteria here.

- The Tech‑heavy NASDAQ Index jumped by more than 3.3%. The offshore yuan is trading at its highest level since 2023 Jul 31, 2026
- USD/JPY After Volatility: Multiple Events in One Day Jul 31, 2026
- The US indices sell off amid renewed US-Iran clashes. Oil jumps by 7% Jul 30, 2026
- USD/JPY Temporary in Equilibrium: Multiple Factors in Focus Jul 30, 2026
- GBP/USD at Month’s Lows: The Outlook Remains Weak Jul 29, 2026
- Crude oil falls below $80 per barrel. Australia sees inflation slowdown Jul 29, 2026
- The US Tech sector hit by sell‑off. Oil prices decline on renewed negotiations Jul 28, 2026
- Gold Declines, Focus on Fed and Falling Oil Prices Jul 28, 2026
- This week will be one of the most crowded for central‑bank meetings Jul 27, 2026
- EUR/USD Ahead of a Key Week: Holding Near Lows Jul 27, 2026