
By InvestMacro
Here are the latest charts and statistics for the Commitment of Traders (COT) data published by the Commodities Futures Trading Commission (CFTC).
The latest COT data is updated through Tuesday May 5th and shows a quick view of how large traders (for-profit speculators and commercial entities) were positioned in the futures markets.
Weekly Speculator Changes led by Brent Oil & Gasoline
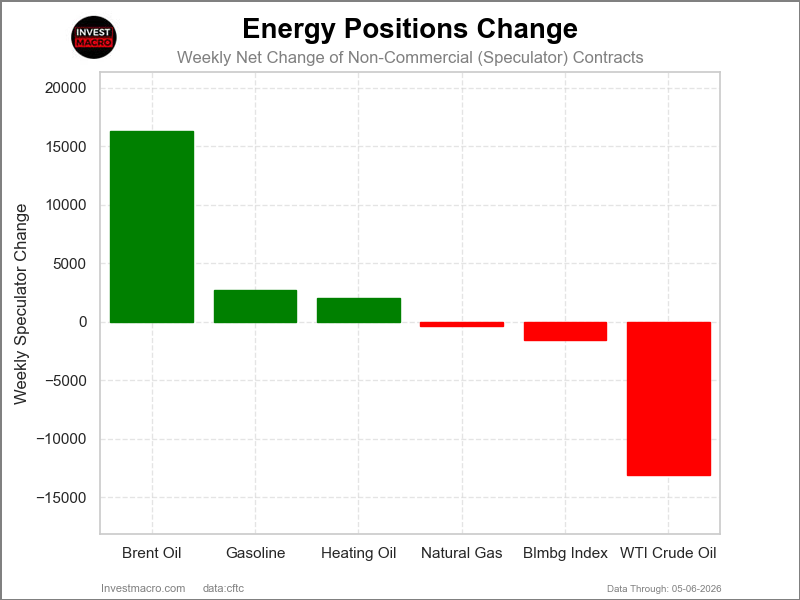
The COT energy market speculator bets were mixed this week as three out of the six energy markets we cover had higher positioning while the other three markets had lower speculator contracts.
Leading the gains for the energy markets was Brent Oil (16,333 contracts) with Gasoline (2,677 contracts) and Heating Oil (2,022 contracts) also having positive weeks.
The markets with declines in speculator bets for the week were WTI Crude (-13,125 contracts), Bloomberg Index (-1,552 contracts) and Natural Gas (-373 contracts) also seeing lower bets on the week.
Free Reports:
 Get our Weekly Commitment of Traders Reports - See where the biggest traders (Hedge Funds and Commercial Hedgers) are positioned in the futures markets on a weekly basis.
 Sign Up for Our Stock Market Newsletter – Get updated on News, Charts & Rankings of Public Companies when you join our Stocks Newsletter
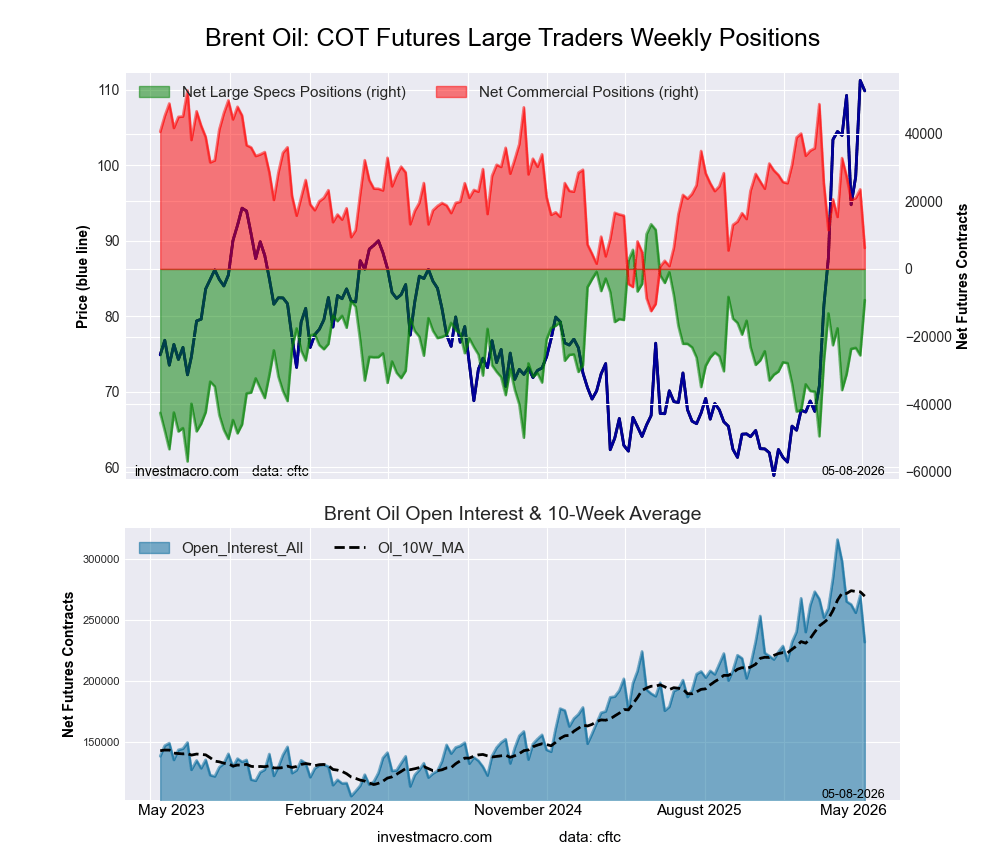
Brent Crude Oil Bearish Bets drop to lowest since October
Highlighting Energy futures markets this week is Brent Crude Oil. This market saw a jump by over 16,000 speculative net contracts this week and this market has seen gains in seven out of the past 10 weeks. The Brent Crude Oil futures market traditionally has a negative net large speculator standing due to a lot of hedging activity. This week, however, the market is close to an almost neutral overall position with a total of -9,224 net contracts. This is the least bearish level for Brent Crude Oil since October 2025. Typically, when bets have fallen this low, the oil price is also low. The last two times the net position has been this low, the Brent Crude Oil price has been trading around $60 per barrel. But due to the Iran war, the oil price is currently over $100 per barrel with perhaps more risk to the upside at the moment.
Energy market prices were down across the board this week.
In the Energy markets, In the Energy markets price performances, we saw lower markets all across the board for the week. Heating Oil dipped by -1.43%, followed by the Bloomberg Commodity Index, which fell by -1.63%.
Gasoline was lower by over 2% this week with a -2.02% decline. Natural Gas was also lower by -2.68%. Brent Oil fell by -6.58%, while WTI Crude Oil was the biggest negative returner on the week with a -7.32% decrease.
Energy Data:
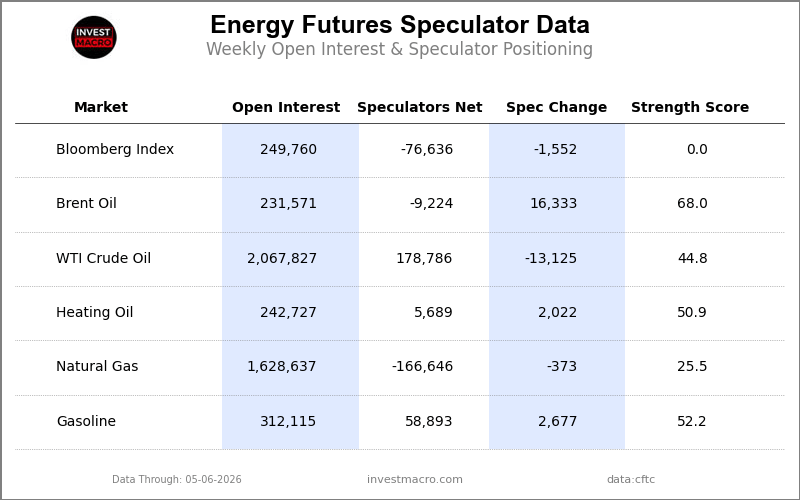
Legend: Weekly Speculators Change | Speculators Current Net Position | Speculators Strength Score compared to last 3-Years (0-100 range)
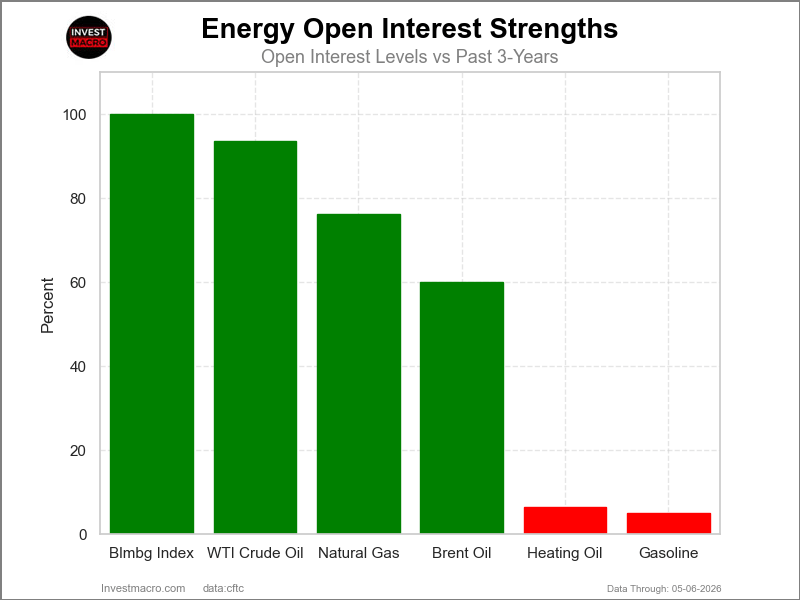
Strength Scores led by Brent Oil & Gasoline
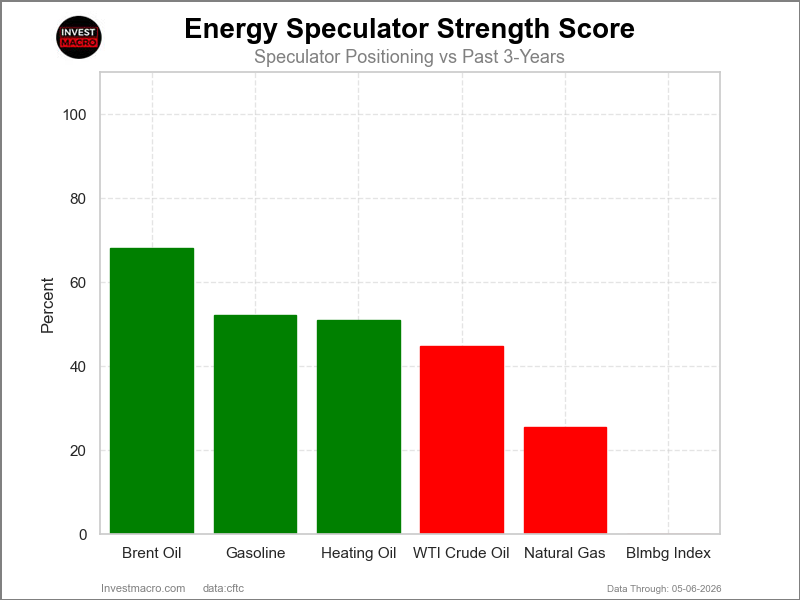
COT Strength Scores (a normalized measure of Speculator positions over a 3-Year range, from 0 to 100 where above 80 is Extreme-Bullish and below 20 is Extreme-Bearish) showed that Brent Oil (68.0 percent) and Gasoline (52.2 percent) lead the energy markets this week.
On the downside, the Bloomberg Index (0.0 percent) comes in at the lowest strength level currently and is in Extreme-Bearish territory (below 20 percent). The next lowest strength score was Natural Gas (25.5 percent).
Strength Statistics:
WTI Crude Oil (44.8 percent) vs WTI Crude Oil previous week (49.0 percent)
Brent Crude Oil (68.0 percent) vs Brent Crude Oil previous week (44.7 percent)
Natural Gas (25.5 percent) vs Natural Gas previous week (25.8 percent)
Gasoline (52.2 percent) vs Gasoline previous week (49.2 percent)
Heating Oil (50.9 percent) vs Heating Oil previous week (48.3 percent)
Bloomberg Commodity Index (0.0 percent) vs Bloomberg Commodity Index previous week (1.6 percent)
Brent Oil & Natural Gas top the 6-Week Strength Trends
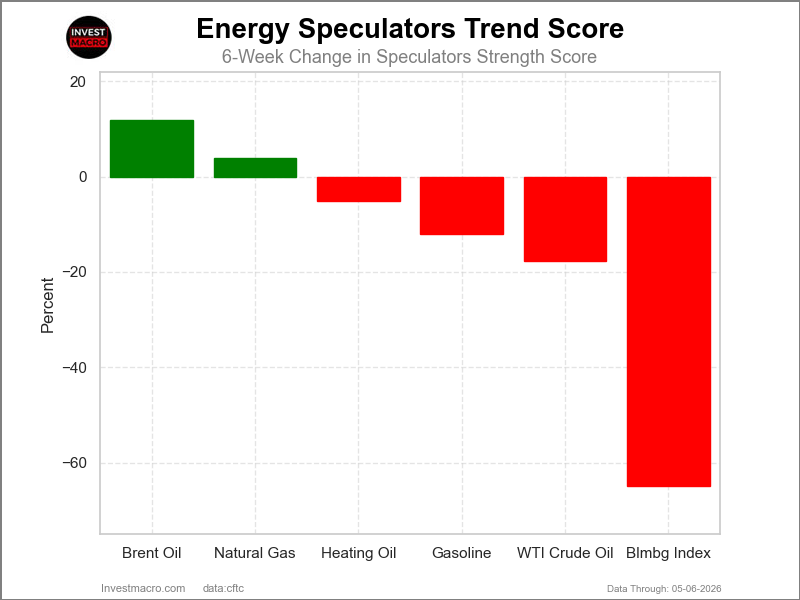
COT Strength Score Trends (or move index, calculates the 6-week changes in strength scores) showed that Brent Oil (11.9 percent) and Natural Gas (3.8 percent) lead the past six weeks trends for the energy markets.
The Bloomberg Index (-64.9 percent) leads the downside trend scores currently with WTI Crude Oil (-17.7 percent) as the next market with lower trend scores.
Move Statistics:
WTI Crude Oil (-17.7 percent) vs WTI Crude Oil previous week (-8.6 percent)
Brent Crude Oil (11.9 percent) vs Brent Crude Oil previous week (-4.3 percent)
Natural Gas (3.8 percent) vs Natural Gas previous week (7.5 percent)
Gasoline (-12.1 percent) vs Gasoline previous week (-22.5 percent)
Heating Oil (-5.1 percent) vs Heating Oil previous week (-15.5 percent)
Bloomberg Commodity Index (-64.9 percent) vs Bloomberg Commodity Index previous week (-62.5 percent)
Individual COT Market Charts:
WTI Crude Oil Futures Futures:
 Positioning Notes:
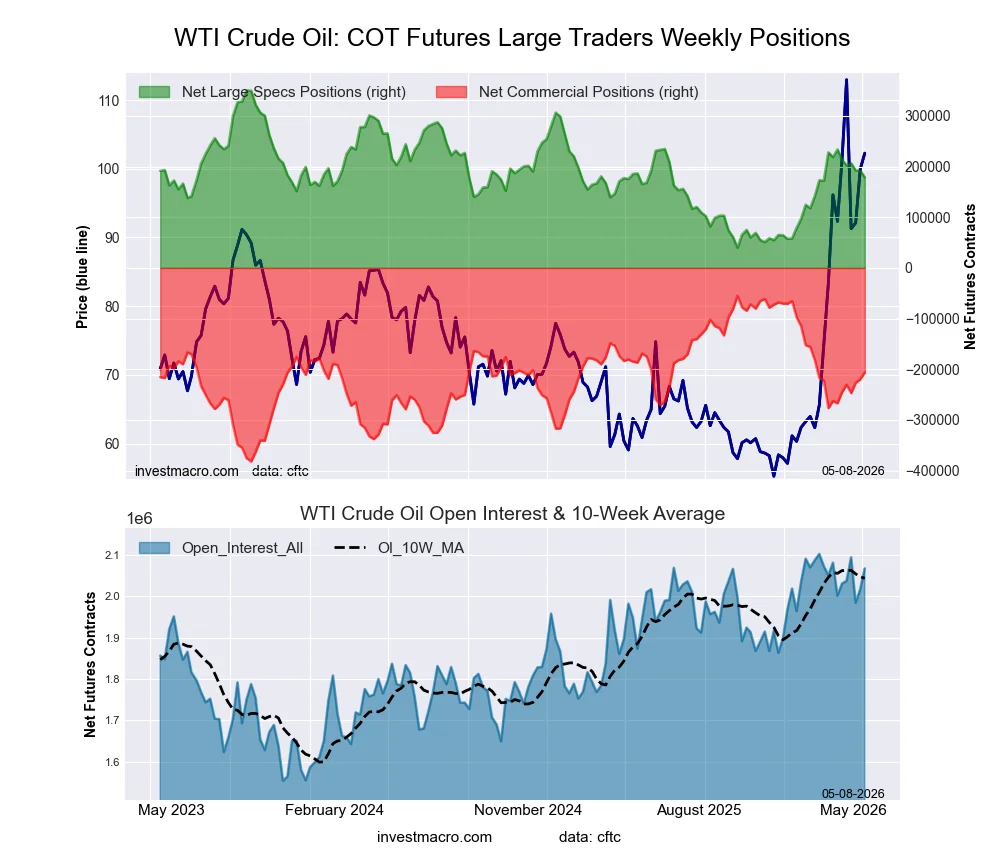
- WTI Crude Oil Futures large speculator standing this week resulted in a net position of 178,786 contracts in the data reported through Tuesday.
- Weekly Speculator position fall of -13,125 contracts from the previous week which had a total of 191,911 net contracts.
- This week’s current strength score (range over the past 3 years, measured from 0 to 100) shows the speculators are currently Bearish with a score of 44.8 percent.
- The Commercials are Bullish with a score of 53.8 percent.
- The Small Traders (not shown in chart) are Bullish with a score of 55.0 percent.
Price Trend-Following Model: Uptrend
Our weekly trend-following model classifies the current market price position as: Uptrend.
| WTI Crude Oil Futures Statistics | SPECULATORS | COMMERCIALS | SMALL TRADERS |
| – Percent of Open Interest Longs: | 18.5 | 45.1 | 3.8 |
| – Percent of Open Interest Shorts: | 9.8 | 55.1 | 2.5 |
| – Net Position: | 178,786 | -206,150 | 27,364 |
| – Gross Longs: | 381,542 | 933,442 | 79,154 |
| – Gross Shorts: | 202,756 | 1,139,592 | 51,790 |
| – Long to Short Ratio: | 1.9 to 1 | 0.8 to 1 | 1.5 to 1 |
| NET POSITION TREND: | |||
| – Strength Index Score (3 Year Range Pct): | 44.8 | 53.8 | 55.0 |
| – Strength Index Reading (3 Year Range): | Bearish | Bullish | Bullish |
| NET POSITION MOVEMENT INDEX: | |||
| – 6-Week Change in Strength Index: | -17.7 | 18.6 | -11.9 |
Brent Crude Oil Futures Futures:
 Positioning Notes:
- Brent Crude Oil Futures large speculator standing this week resulted in a net position of -9,224 contracts in the data reported through Tuesday.
- Weekly Speculator position advance of 16,333 contracts from the previous week which had a total of -25,557 net contracts.
- This week’s current strength score (range over the past 3 years, measured from 0 to 100) shows the speculators are currently Bullish with a score of 68.0 percent.
- The Commercials are Bearish with a score of 28.6 percent.
- The Small Traders (not shown in chart) are Bullish-Extreme with a score of 81.6 percent.
Price Trend-Following Model: Uptrend
Our weekly trend-following model classifies the current market price position as: Uptrend.
| Brent Crude Oil Futures Statistics | SPECULATORS | COMMERCIALS | SMALL TRADERS |
| – Percent of Open Interest Longs: | 30.9 | 32.0 | 4.1 |
| – Percent of Open Interest Shorts: | 34.9 | 29.3 | 2.8 |
| – Net Position: | -9,224 | 6,203 | 3,021 |
| – Gross Longs: | 71,485 | 74,079 | 9,396 |
| – Gross Shorts: | 80,709 | 67,876 | 6,375 |
| – Long to Short Ratio: | 0.9 to 1 | 1.1 to 1 | 1.5 to 1 |
| NET POSITION TREND: | |||
| – Strength Index Score (3 Year Range Pct): | 68.0 | 28.6 | 81.6 |
| – Strength Index Reading (3 Year Range): | Bullish | Bearish | Bullish-Extreme |
| NET POSITION MOVEMENT INDEX: | |||
| – 6-Week Change in Strength Index: | 11.9 | -14.1 | 11.3 |
Natural Gas Futures Futures:
 Positioning Notes:
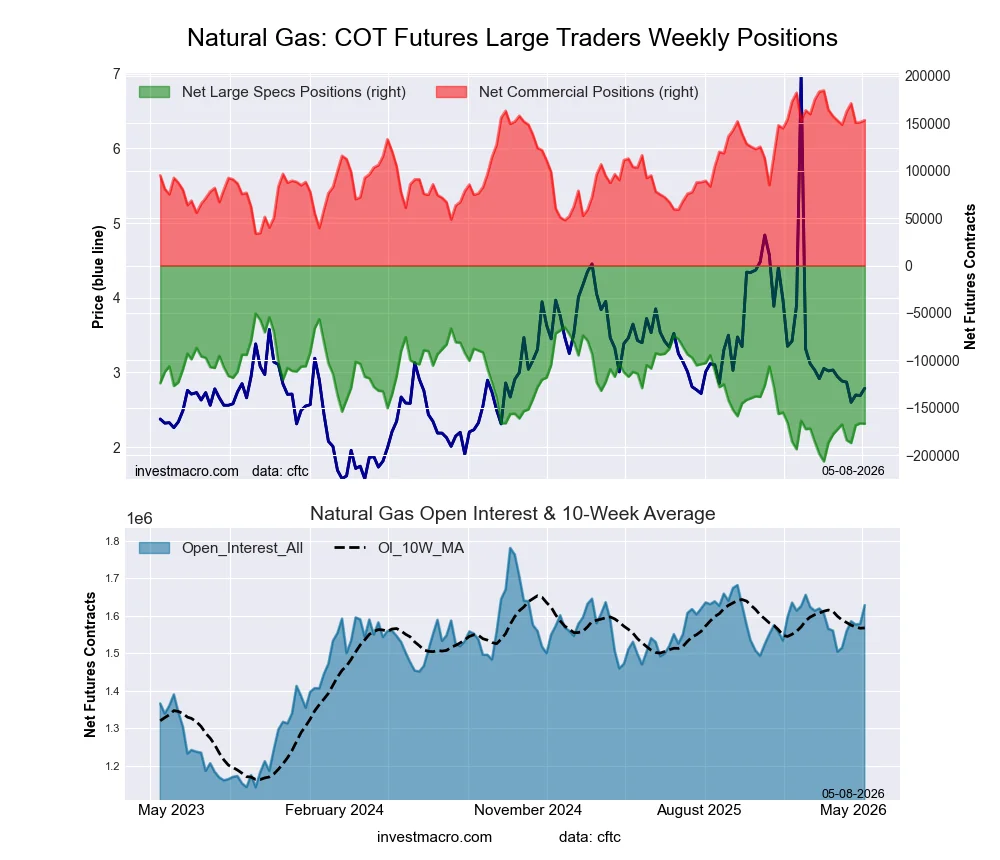
- Natural Gas Futures large speculator standing this week resulted in a net position of -166,646 contracts in the data reported through Tuesday.
- Weekly Speculator position lowering of -373 contracts from the previous week which had a total of -166,273 net contracts.
- This week’s current strength score (range over the past 3 years, measured from 0 to 100) shows the speculators are currently Bearish with a score of 25.5 percent.
- The Commercials are Bullish with a score of 79.3 percent.
- The Small Traders (not shown in chart) are Bearish with a score of 37.2 percent.
Price Trend-Following Model: Downtrend
Our weekly trend-following model classifies the current market price position as: Downtrend.
| Natural Gas Futures Statistics | SPECULATORS | COMMERCIALS | SMALL TRADERS |
| – Percent of Open Interest Longs: | 14.6 | 35.5 | 3.4 |
| – Percent of Open Interest Shorts: | 24.8 | 26.1 | 2.6 |
| – Net Position: | -166,646 | 153,150 | 13,496 |
| – Gross Longs: | 237,674 | 578,708 | 55,616 |
| – Gross Shorts: | 404,320 | 425,558 | 42,120 |
| – Long to Short Ratio: | 0.6 to 1 | 1.4 to 1 | 1.3 to 1 |
| NET POSITION TREND: | |||
| – Strength Index Score (3 Year Range Pct): | 25.5 | 79.3 | 37.2 |
| – Strength Index Reading (3 Year Range): | Bearish | Bullish | Bearish |
| NET POSITION MOVEMENT INDEX: | |||
| – 6-Week Change in Strength Index: | 3.8 | 0.3 | -16.1 |
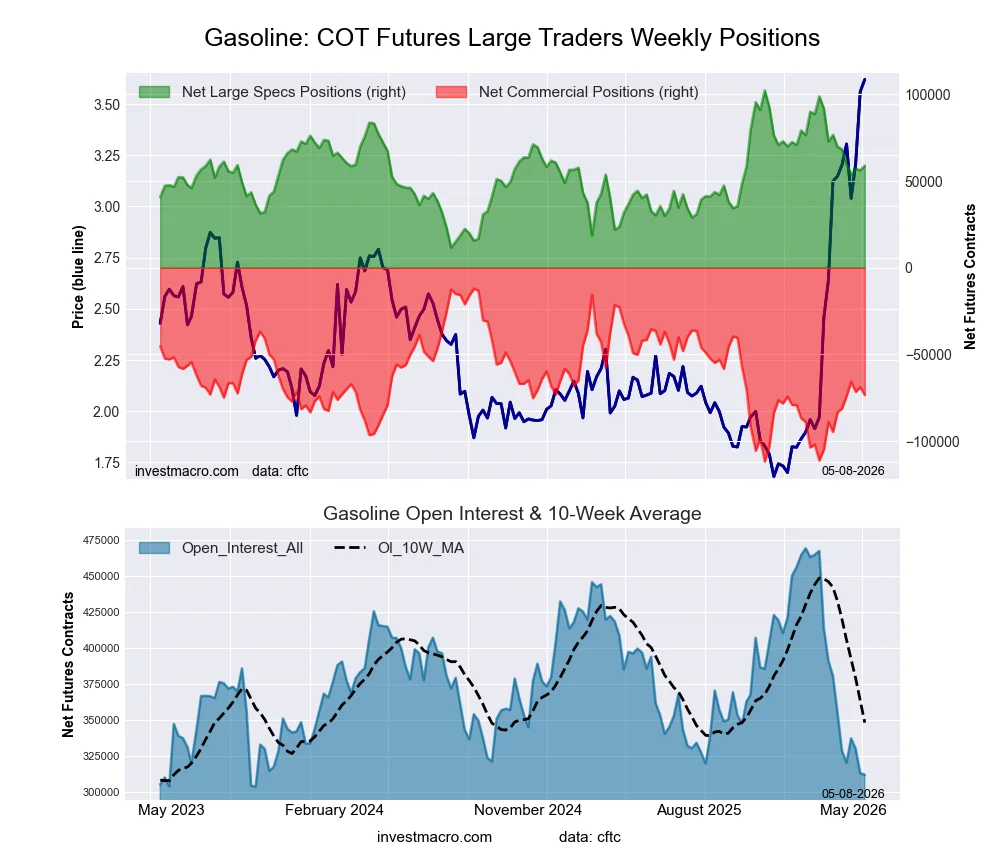
Gasoline Blendstock Futures Futures:
 Positioning Notes:
- Gasoline Blendstock Futures large speculator standing this week resulted in a net position of 58,893 contracts in the data reported through Tuesday.
- Weekly Speculator position lift of 2,677 contracts from the previous week which had a total of 56,216 net contracts.
- This week’s current strength score (range over the past 3 years, measured from 0 to 100) shows the speculators are currently Bullish with a score of 52.2 percent.
- The Commercials are Bearish with a score of 38.5 percent.
- The Small Traders (not shown in chart) are Bullish-Extreme with a score of 83.6 percent.
Price Trend-Following Model: Uptrend
Our weekly trend-following model classifies the current market price position as: Uptrend.
| Nasdaq Mini Futures Statistics | SPECULATORS | COMMERCIALS | SMALL TRADERS |
| – Percent of Open Interest Longs: | 26.7 | 47.8 | 8.4 |
| – Percent of Open Interest Shorts: | 7.8 | 71.4 | 3.8 |
| – Net Position: | 58,893 | -73,382 | 14,489 |
| – Gross Longs: | 83,248 | 149,329 | 26,330 |
| – Gross Shorts: | 24,355 | 222,711 | 11,841 |
| – Long to Short Ratio: | 3.4 to 1 | 0.7 to 1 | 2.2 to 1 |
| NET POSITION TREND: | |||
| – Strength Index Score (3 Year Range Pct): | 52.2 | 38.5 | 83.6 |
| – Strength Index Reading (3 Year Range): | Bullish | Bearish | Bullish-Extreme |
| NET POSITION MOVEMENT INDEX: | |||
| – 6-Week Change in Strength Index: | -12.1 | 10.1 | 4.2 |
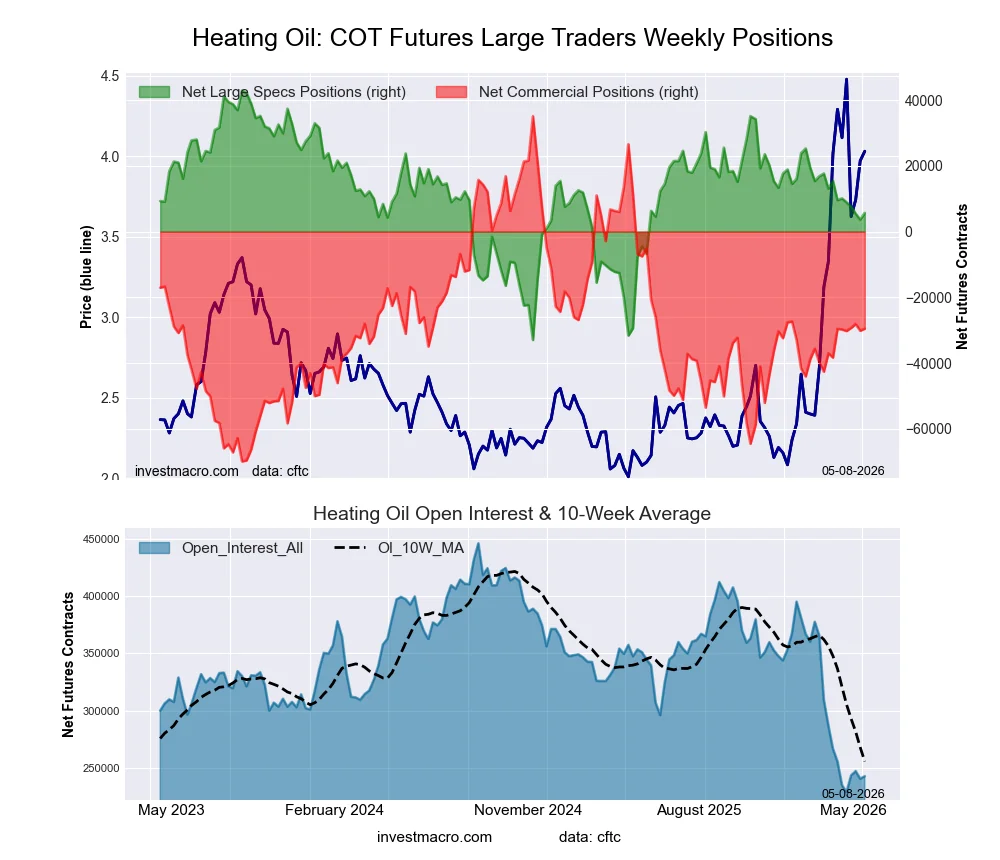
#2 Heating Oil NY-Harbor Futures Futures:
 Positioning Notes:
- #2 Heating Oil NY-Harbor Futures large speculator standing this week resulted in a net position of 5,689 contracts in the data reported through Tuesday.
- Weekly Speculator position lift of 2,022 contracts from the previous week which had a total of 3,667 net contracts.
- This week’s current strength score (range over the past 3 years, measured from 0 to 100) shows the speculators are currently Bullish with a score of 50.9 percent.
- The Commercials are Bearish with a score of 38.4 percent.
- The Small Traders (not shown in chart) are Bullish-Extreme with a score of 83.3 percent.
Price Trend-Following Model: Uptrend
Our weekly trend-following model classifies the current market price position as: Uptrend.
| Heating Oil Futures Statistics | SPECULATORS | COMMERCIALS | SMALL TRADERS |
| – Percent of Open Interest Longs: | 17.4 | 47.8 | 19.0 |
| – Percent of Open Interest Shorts: | 15.0 | 59.9 | 9.2 |
| – Net Position: | 5,689 | -29,537 | 23,848 |
| – Gross Longs: | 42,178 | 115,956 | 46,091 |
| – Gross Shorts: | 36,489 | 145,493 | 22,243 |
| – Long to Short Ratio: | 1.2 to 1 | 0.8 to 1 | 2.1 to 1 |
| NET POSITION TREND: | |||
| – Strength Index Score (3 Year Range Pct): | 50.9 | 38.4 | 83.3 |
| – Strength Index Reading (3 Year Range): | Bullish | Bearish | Bullish-Extreme |
| NET POSITION MOVEMENT INDEX: | |||
| – 6-Week Change in Strength Index: | -5.1 | 0.1 | 10.4 |
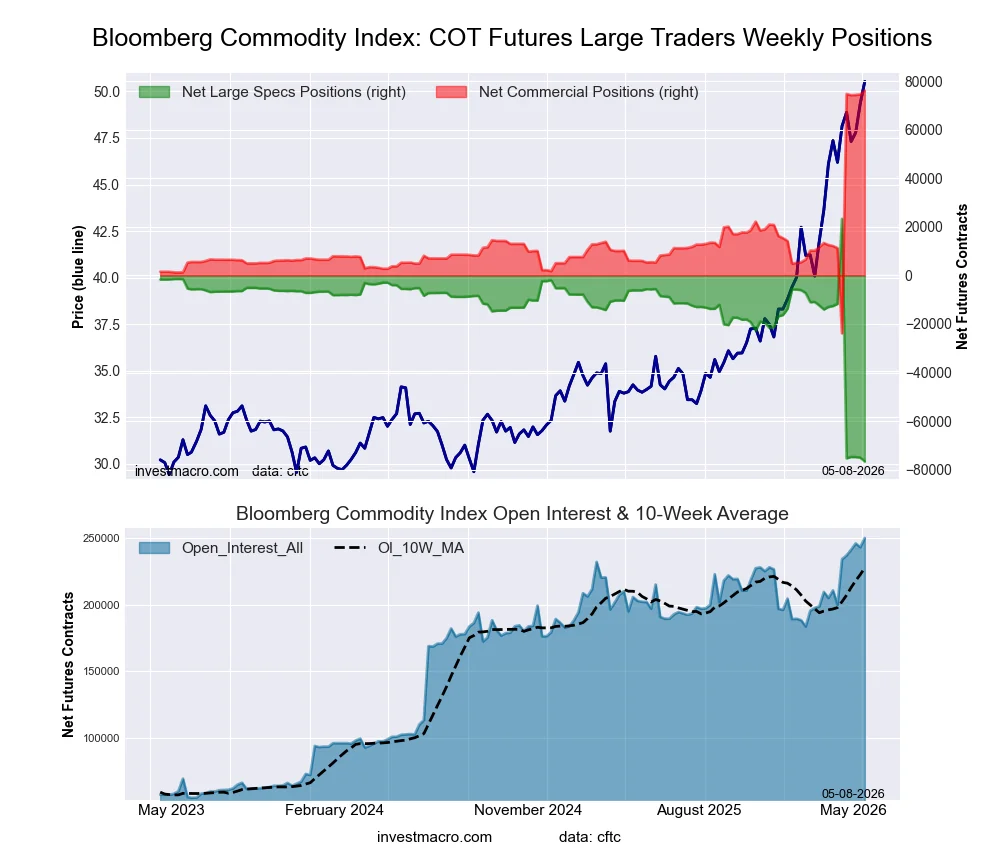
Bloomberg Commodity Index Futures Futures:
 Positioning Notes:
- Bloomberg Commodity Index Futures large speculator standing this week resulted in a net position of -76,636 contracts in the data reported through Tuesday.
- Weekly Speculator position lowering of -1,552 contracts from the previous week which had a total of -75,084 net contracts.
- This week’s current strength score (range over the past 3 years, measured from 0 to 100) shows the speculators are currently Bearish-Extreme with a score of 0.0 percent.
- The Commercials are Bullish-Extreme with a score of 100.0 percent.
- The Small Traders (not shown in chart) are Bullish with a score of 63.1 percent.
Price Trend-Following Model: Uptrend
Our weekly trend-following model classifies the current market price position as: Uptrend.
| Bloomberg Index Futures Statistics | SPECULATORS | COMMERCIALS | SMALL TRADERS |
| – Percent of Open Interest Longs: | 44.7 | 54.5 | 0.2 |
| – Percent of Open Interest Shorts: | 75.4 | 24.0 | 0.0 |
| – Net Position: | -76,636 | 76,162 | 474 |
| – Gross Longs: | 111,634 | 136,162 | 527 |
| – Gross Shorts: | 188,270 | 60,000 | 53 |
| – Long to Short Ratio: | 0.6 to 1 | 2.3 to 1 | 9.9 to 1 |
| NET POSITION TREND: | |||
| – Strength Index Score (3 Year Range Pct): | 0.0 | 100.0 | 63.1 |
| – Strength Index Reading (3 Year Range): | Bearish-Extreme | Bullish-Extreme | Bullish |
| NET POSITION MOVEMENT INDEX: | |||
| – 6-Week Change in Strength Index: | -64.9 | 64.9 | 1.8 |
Article By InvestMacro – Receive our weekly COT Newsletter
*COT Report: The COT data, released weekly to the public each Friday, is updated through the most recent Tuesday (data is 3 days old) and shows a quick view of how large speculators or non-commercials (for-profit traders) were positioned in the futures markets.
The CFTC categorizes trader positions according to commercial hedgers (traders who use futures contracts for hedging as part of the business), non-commercials (large traders who speculate to realize trading profits) and nonreportable traders (usually small traders/speculators) as well as their open interest (contracts open in the market at time of reporting). See CFTC criteria here.

- The Tech‑heavy NASDAQ Index jumped by more than 3.3%. The offshore yuan is trading at its highest level since 2023 Jul 31, 2026
- USD/JPY After Volatility: Multiple Events in One Day Jul 31, 2026
- The US indices sell off amid renewed US-Iran clashes. Oil jumps by 7% Jul 30, 2026
- USD/JPY Temporary in Equilibrium: Multiple Factors in Focus Jul 30, 2026
- GBP/USD at Month’s Lows: The Outlook Remains Weak Jul 29, 2026
- Crude oil falls below $80 per barrel. Australia sees inflation slowdown Jul 29, 2026
- The US Tech sector hit by sell‑off. Oil prices decline on renewed negotiations Jul 28, 2026
- Gold Declines, Focus on Fed and Falling Oil Prices Jul 28, 2026
- This week will be one of the most crowded for central‑bank meetings Jul 27, 2026
- EUR/USD Ahead of a Key Week: Holding Near Lows Jul 27, 2026