By InvestMacro
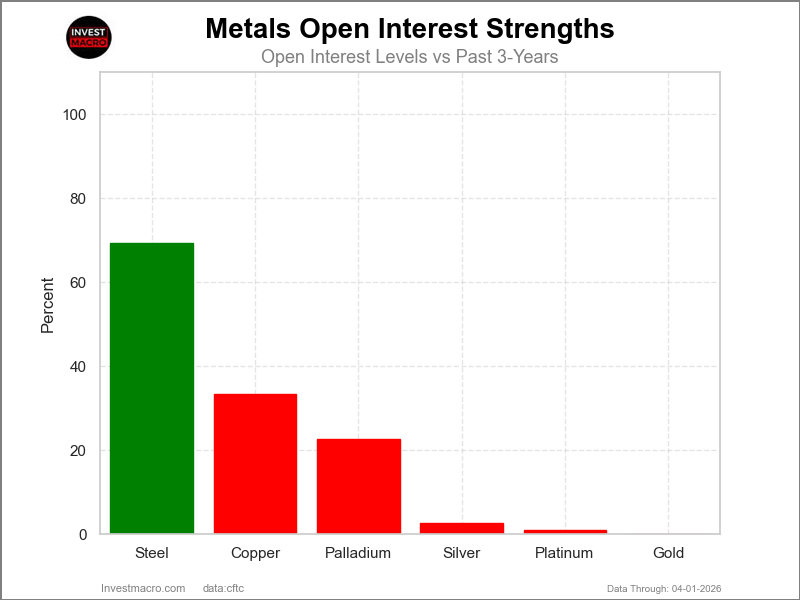
Open Interest (OI) is the amount of contracts that are currently live in the marketplace. OI Strength shows the current strength compared to the past 3-years.
Here are the latest charts and statistics for the Commitment of Traders (COT) data published by the Commodities Futures Trading Commission (CFTC).
The latest COT data is updated through Tuesday March 31st and shows a quick view of how large traders (for-profit speculators and commercial entities) were positioned in the futures markets.
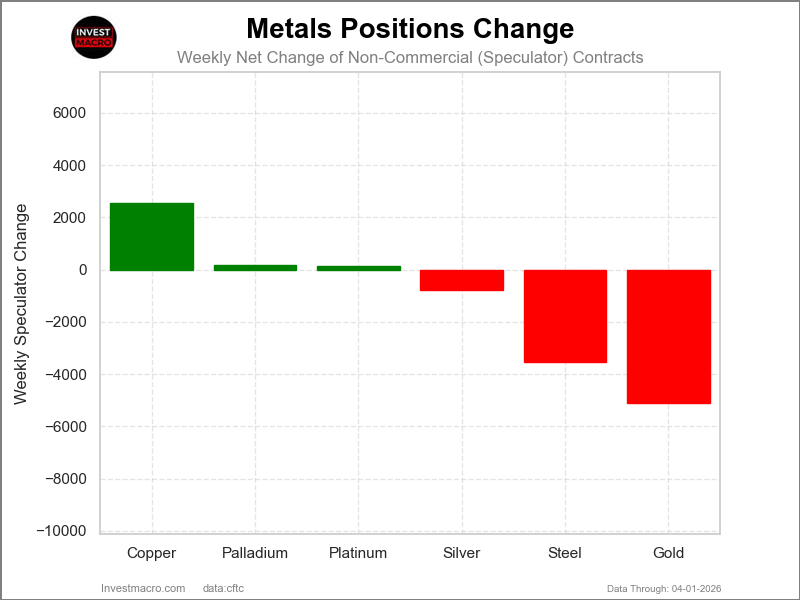
The COT metals markets speculator bets were overall mixed this week as three out of the six metals markets we cover had higher positioning while the other three markets had lower speculator contracts.
Leading the gains for the metals was Copper (2,567 contracts) with Palladium (192 contracts) and Platinum (139 contracts) also seeing positive weeks.
Free Reports:
The markets with declines in speculator bets for the week were Gold (-5,125 contracts), Steel (-3,544 contracts) and with Silver (-769 contracts) also having lower bets on the week.
In the Metals markets this week, Palladium was the biggest winner for price performance with a 7.20% gain over the past 5 days. Platinum was higher as well by 5.09%, while Silver came in third with a 4.48% advance. Gold also rose higher with a strong 4.17% rise. Steel was up by 1.84%, and Copper rounds out the gainers with a 1.62% advance.
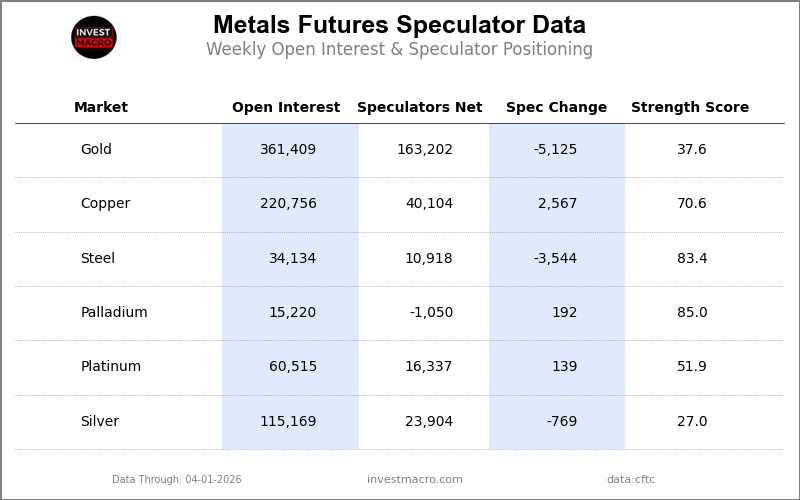
Legend: Weekly Speculators Change | Speculators Current Net Position | Speculators Strength Score compared to last 3-Years (0-100 range)
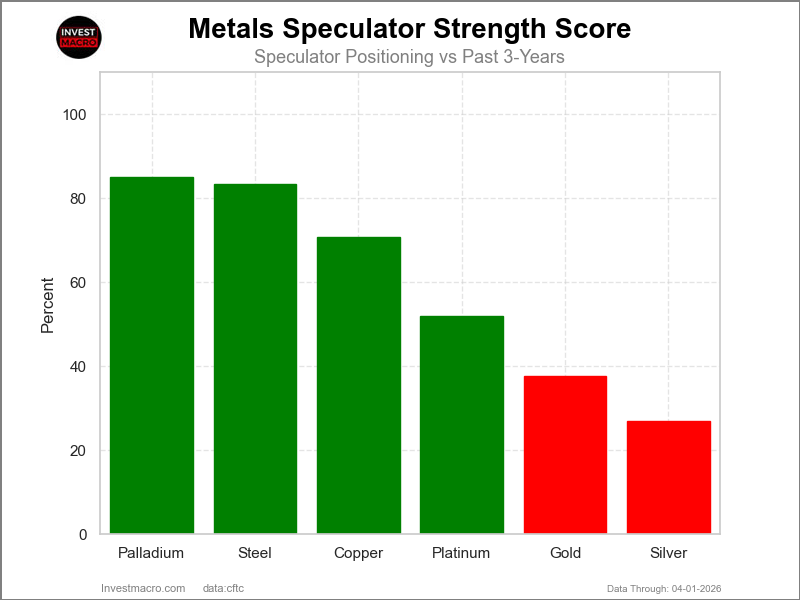
COT Strength Scores (a normalized measure of Speculator positions over a 3-Year range, from 0 to 100 where above 80 is Extreme-Bullish and below 20 is Extreme-Bearish) showed that Palladium (85 percent) and Steel (83 percent) lead the metals markets this week.
On the downside, Silver (27 percent) comes in at the lowest strength level currently and the next lowest strength score was Gold (38 percent).
Strength Statistics:
Gold (37.6 percent) vs Gold previous week (39.7 percent)
Silver (27.0 percent) vs Silver previous week (28.3 percent)
Copper (70.6 percent) vs Copper previous week (68.2 percent)
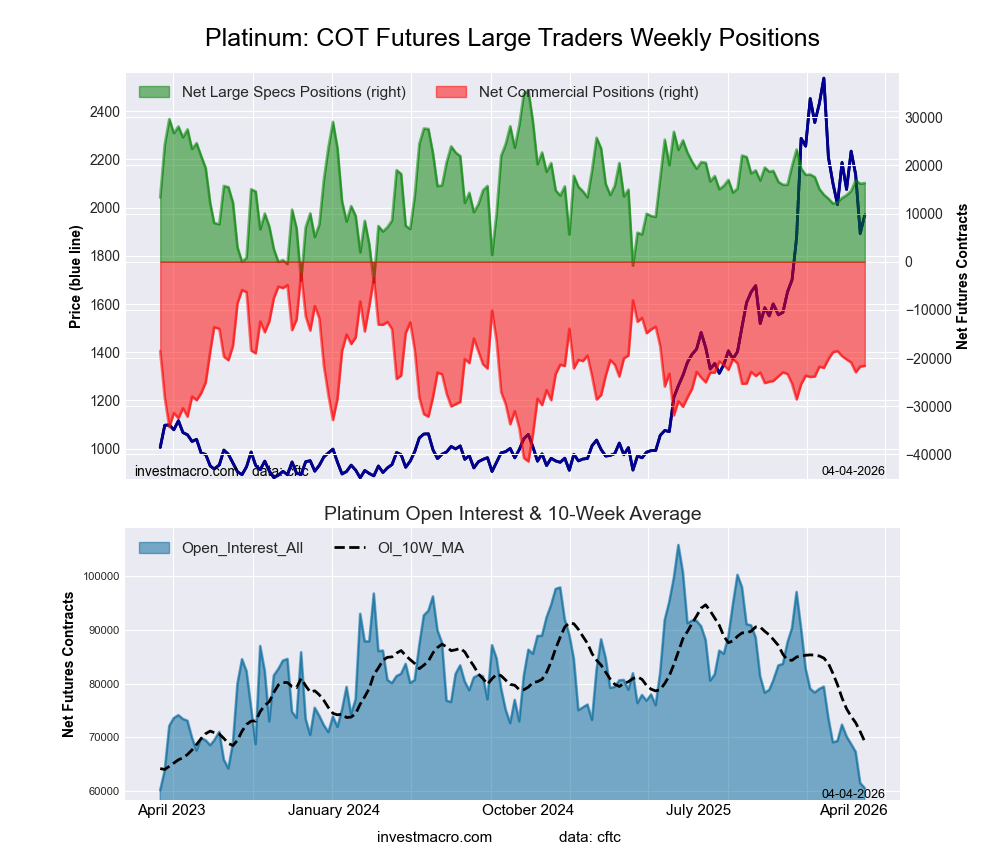
Platinum (51.9 percent) vs Platinum previous week (51.5 percent)
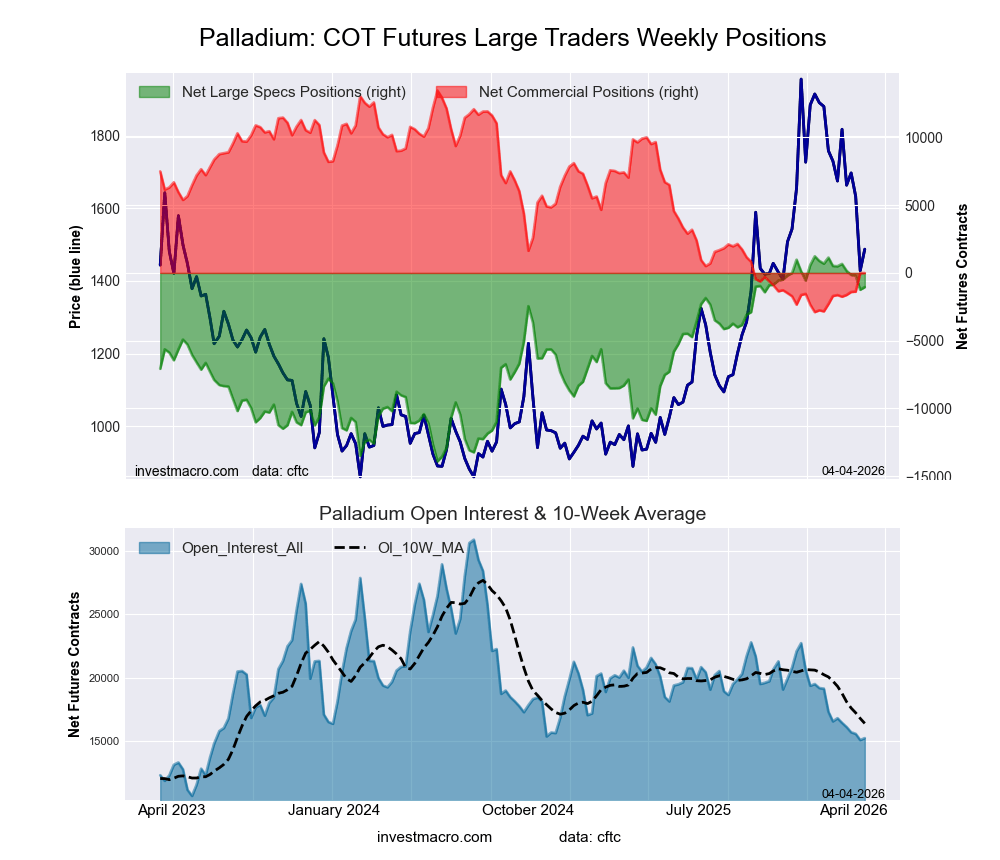
Palladium (85.0 percent) vs Palladium previous week (83.7 percent)
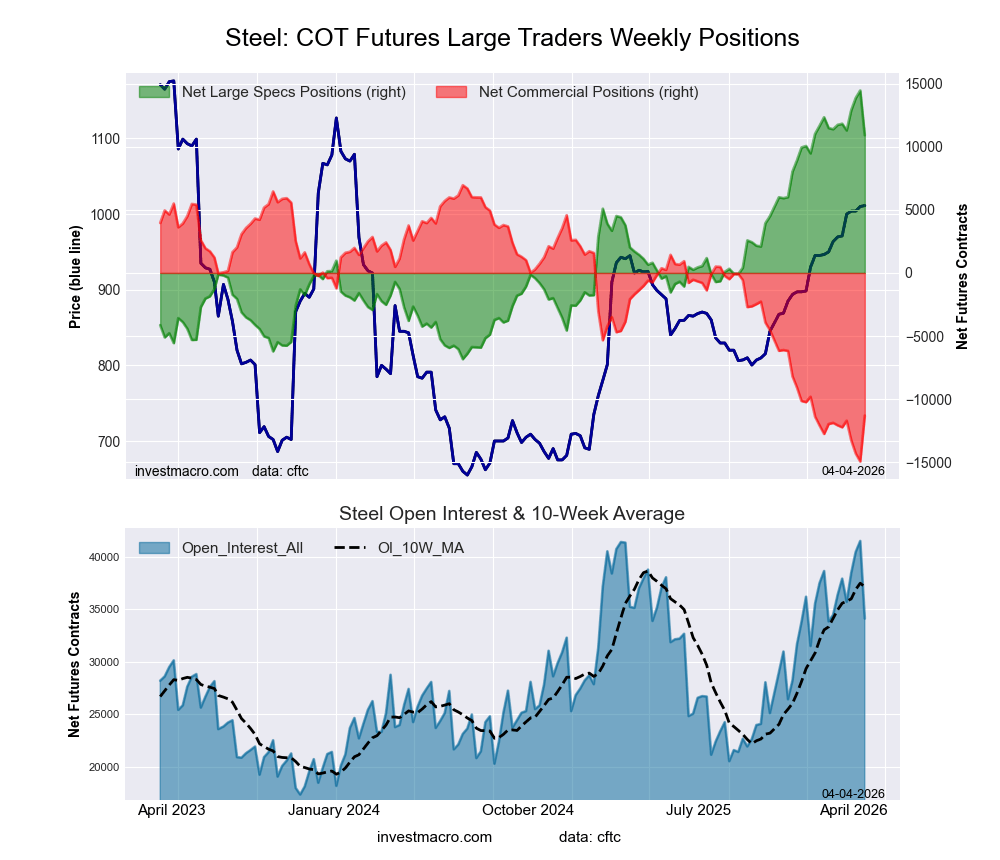
Steel (83.4 percent) vs Steel previous week (100.0 percent)
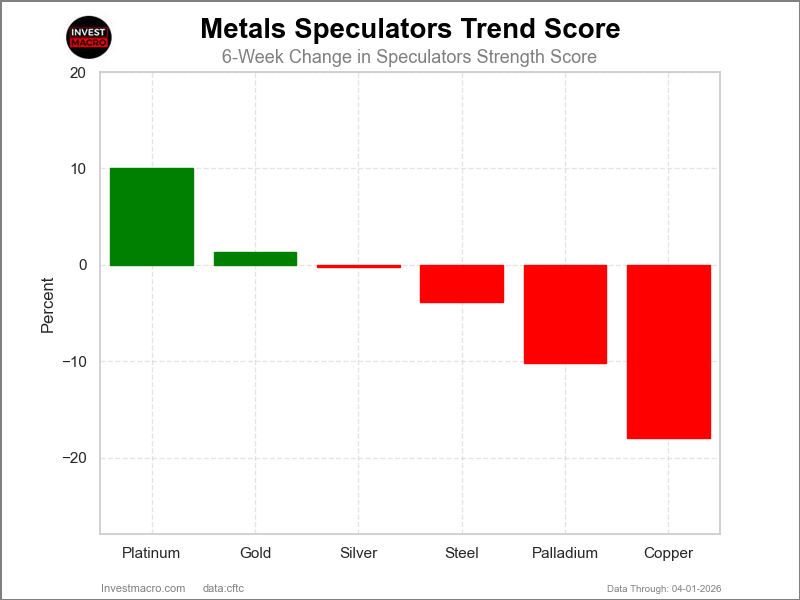
COT Strength Score Trends (or move index, calculates the 6-week changes in strength scores) showed that Platinum (10 percent) and Gold (1 percent) lead the past six weeks trends for metals.
Copper (-18 percent) leads the downside trend scores currently with Palladium (-10 percent) as the next market with lower trend scores.
Move Statistics:
Gold (1.3 percent) vs Gold previous week (3.4 percent)
Silver (-0.2 percent) vs Silver previous week (2.9 percent)
Copper (-17.9 percent) vs Copper previous week (-7.8 percent)
Platinum (10.0 percent) vs Platinum previous week (10.3 percent)
Palladium (-10.2 percent) vs Palladium previous week (-11.6 percent)
Steel (-3.8 percent) vs Steel previous week (14.4 percent)
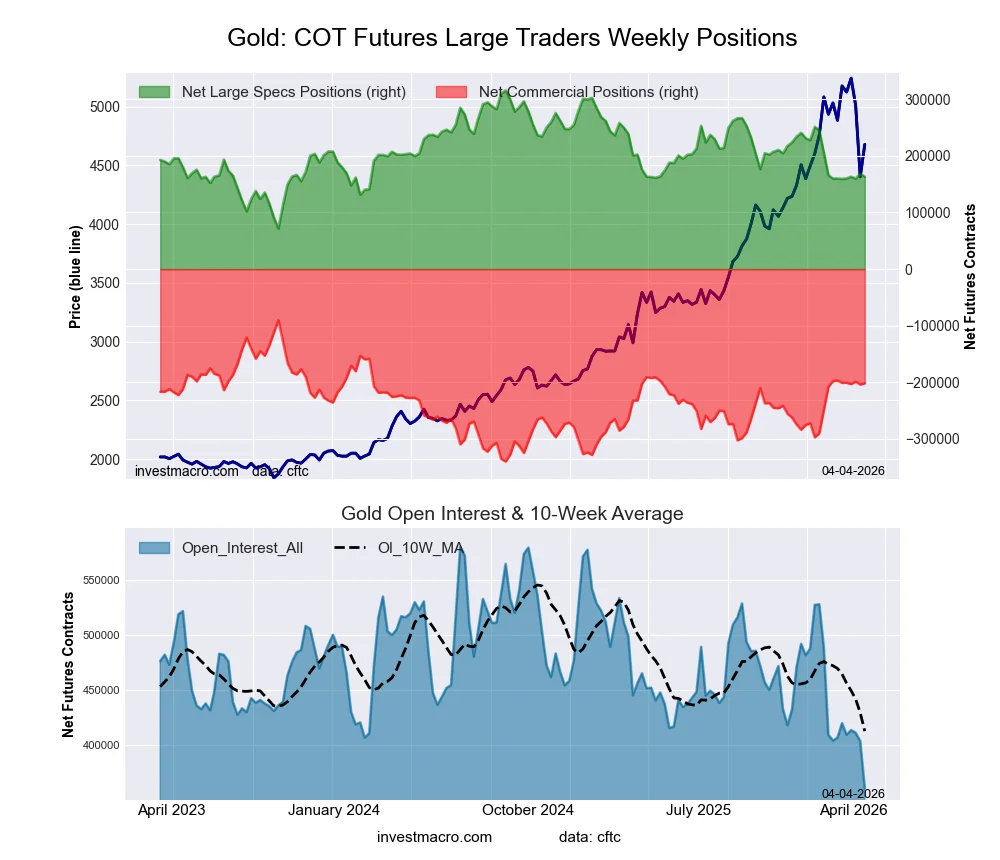
This week’s current strength score (the trader positioning range over the past three years, measured from 0 to 100) shows the speculators are currently Bearish with a score of 37.6 percent. The commercials are Bullish with a score of 55.4 percent and the small traders (not shown in chart) are Bullish with a score of 78.3 percent.
Our weekly trend-following model classifies the current market price position as: Uptrend.
| Gold Futures Statistics | SPECULATORS | COMMERCIALS | SMALL TRADERS |
| – Percent of Open Interest Longs: | 57.4 | 16.2 | 14.0 |
| – Percent of Open Interest Shorts: | 12.3 | 72.0 | 3.4 |
| – Net Position: | 163,202 | -201,640 | 38,438 |
| – Gross Longs: | 207,602 | 58,697 | 50,617 |
| – Gross Shorts: | 44,400 | 260,337 | 12,179 |
| – Long to Short Ratio: | 4.7 to 1 | 0.2 to 1 | 4.2 to 1 |
| NET POSITION TREND: | |||
| – Strength Index Score (3 Year Range Pct): | 37.6 | 55.4 | 78.3 |
| – Strength Index Reading (3 Year Range): | Bearish | Bullish | Bullish |
| NET POSITION MOVEMENT INDEX: | |||
| – 6-Week Change in Strength Index: | 1.3 | -1.9 | 4.6 |
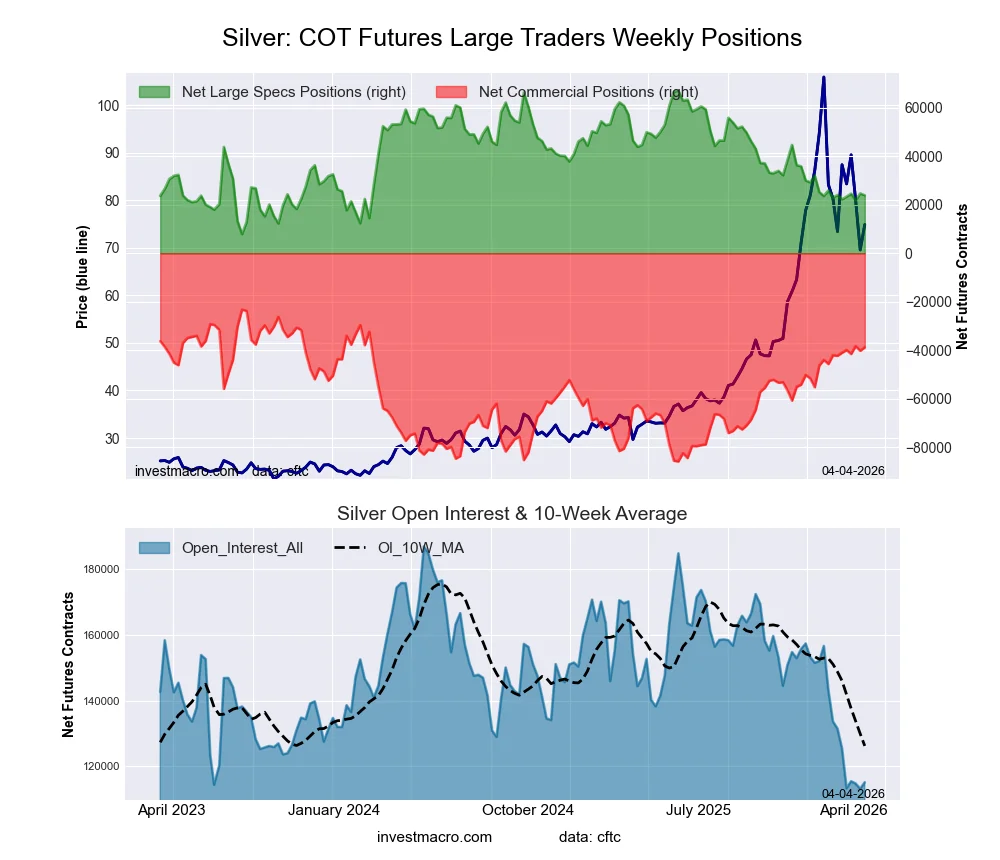
This week’s current strength score (the trader positioning range over the past three years, measured from 0 to 100) shows the speculators are currently Bearish with a score of 27.0 percent. The commercials are Bullish with a score of 75.1 percent and the small traders (not shown in chart) are Bearish with a score of 34.9 percent.
Our weekly trend-following model classifies the current market price position as: Weak Uptrend.
| Silver Futures Statistics | SPECULATORS | COMMERCIALS | SMALL TRADERS |
| – Percent of Open Interest Longs: | 29.1 | 26.0 | 21.2 |
| – Percent of Open Interest Shorts: | 8.3 | 59.7 | 8.3 |
| – Net Position: | 23,904 | -38,857 | 14,953 |
| – Gross Longs: | 33,463 | 29,892 | 24,465 |
| – Gross Shorts: | 9,559 | 68,749 | 9,512 |
| – Long to Short Ratio: | 3.5 to 1 | 0.4 to 1 | 2.6 to 1 |
| NET POSITION TREND: | |||
| – Strength Index Score (3 Year Range Pct): | 27.0 | 75.1 | 34.9 |
| – Strength Index Reading (3 Year Range): | Bearish | Bullish | Bearish |
| NET POSITION MOVEMENT INDEX: | |||
| – 6-Week Change in Strength Index: | -0.2 | 5.6 | -18.8 |
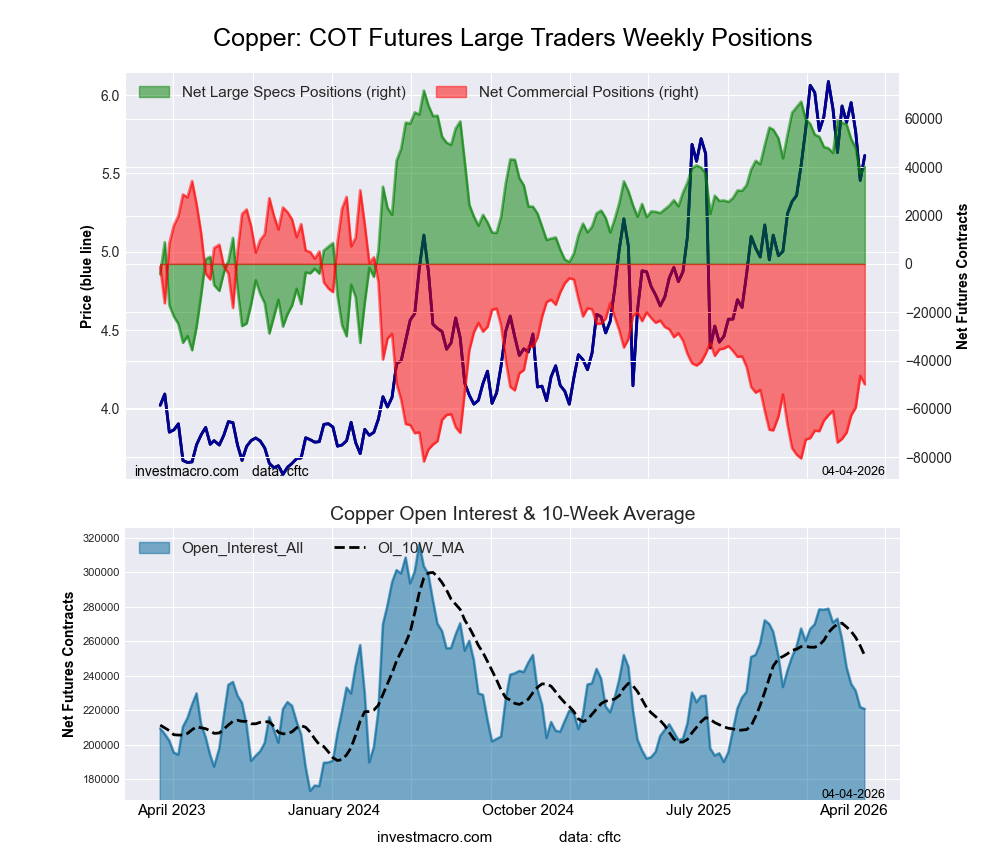
This week’s current strength score (the trader positioning range over the past three years, measured from 0 to 100) shows the speculators are currently Bullish with a score of 70.6 percent. The commercials are Bearish with a score of 27.5 percent and the small traders (not shown in chart) are Bullish with a score of 64.4 percent.
Our weekly trend-following model classifies the current market price position as: Weak Uptrend.
| Copper Futures Statistics | SPECULATORS | COMMERCIALS | SMALL TRADERS |
| – Percent of Open Interest Longs: | 32.2 | 38.3 | 9.3 |
| – Percent of Open Interest Shorts: | 14.0 | 60.9 | 4.9 |
| – Net Position: | 40,104 | -49,809 | 9,705 |
| – Gross Longs: | 71,107 | 84,546 | 20,448 |
| – Gross Shorts: | 31,003 | 134,355 | 10,743 |
| – Long to Short Ratio: | 2.3 to 1 | 0.6 to 1 | 1.9 to 1 |
| NET POSITION TREND: | |||
| – Strength Index Score (3 Year Range Pct): | 70.6 | 27.5 | 64.4 |
| – Strength Index Reading (3 Year Range): | Bullish | Bearish | Bullish |
| NET POSITION MOVEMENT INDEX: | |||
| – 6-Week Change in Strength Index: | -17.9 | 20.8 | -25.0 |
This week’s current strength score (the trader positioning range over the past three years, measured from 0 to 100) shows the speculators are currently Bullish with a score of 51.9 percent. The commercials are Bullish with a score of 50.8 percent and the small traders (not shown in chart) are Bullish with a score of 59.2 percent.
Our weekly trend-following model classifies the current market price position as: Weak Uptrend.
| Platinum Futures Statistics | SPECULATORS | COMMERCIALS | SMALL TRADERS |
| – Percent of Open Interest Longs: | 43.5 | 30.5 | 13.3 |
| – Percent of Open Interest Shorts: | 16.5 | 66.1 | 4.6 |
| – Net Position: | 16,337 | -21,603 | 5,266 |
| – Gross Longs: | 26,303 | 18,427 | 8,060 |
| – Gross Shorts: | 9,966 | 40,030 | 2,794 |
| – Long to Short Ratio: | 2.6 to 1 | 0.5 to 1 | 2.9 to 1 |
| NET POSITION TREND: | |||
| – Strength Index Score (3 Year Range Pct): | 51.9 | 50.8 | 59.2 |
| – Strength Index Reading (3 Year Range): | Bullish | Bullish | Bullish |
| NET POSITION MOVEMENT INDEX: | |||
| – 6-Week Change in Strength Index: | 10.0 | -7.8 | -10.6 |
This week’s current strength score (the trader positioning range over the past three years, measured from 0 to 100) shows the speculators are currently Bullish-Extreme with a score of 85.0 percent. The commercials are Bearish-Extreme with a score of 17.6 percent and the small traders (not shown in chart) are Bullish with a score of 56.7 percent.
Our weekly trend-following model classifies the current market price position as: Strong Downtrend.
| Palladium Futures Statistics | SPECULATORS | COMMERCIALS | SMALL TRADERS |
| – Percent of Open Interest Longs: | 44.9 | 35.7 | 14.6 |
| – Percent of Open Interest Shorts: | 51.8 | 35.8 | 7.7 |
| – Net Position: | -1,050 | -9 | 1,059 |
| – Gross Longs: | 6,835 | 5,433 | 2,228 |
| – Gross Shorts: | 7,885 | 5,442 | 1,169 |
| – Long to Short Ratio: | 0.9 to 1 | 1.0 to 1 | 1.9 to 1 |
| NET POSITION TREND: | |||
| – Strength Index Score (3 Year Range Pct): | 85.0 | 17.6 | 56.7 |
| – Strength Index Reading (3 Year Range): | Bullish-Extreme | Bearish-Extreme | Bullish |
| NET POSITION MOVEMENT INDEX: | |||
| – 6-Week Change in Strength Index: | -10.2 | 9.9 | -2.9 |
This week’s current strength score (the trader positioning range over the past three years, measured from 0 to 100) shows the speculators are currently Bullish-Extreme with a score of 83.4 percent. The commercials are Bearish-Extreme with a score of 16.6 percent and the small traders (not shown in chart) are Bullish-Extreme with a score of 87.3 percent.
Our weekly trend-following model classifies the current market price position as: Strong Uptrend.
| Steel Futures Statistics | SPECULATORS | COMMERCIALS | SMALL TRADERS |
| – Percent of Open Interest Longs: | 34.8 | 61.1 | 1.4 |
| – Percent of Open Interest Shorts: | 2.8 | 94.2 | 0.2 |
| – Net Position: | 10,918 | -11,312 | 394 |
| – Gross Longs: | 11,871 | 20,848 | 473 |
| – Gross Shorts: | 953 | 32,160 | 79 |
| – Long to Short Ratio: | 12.5 to 1 | 0.6 to 1 | 6.0 to 1 |
| NET POSITION TREND: | |||
| – Strength Index Score (3 Year Range Pct): | 83.4 | 16.6 | 87.3 |
| – Strength Index Reading (3 Year Range): | Bullish-Extreme | Bearish-Extreme | Bullish-Extreme |
| NET POSITION MOVEMENT INDEX: | |||
| – 6-Week Change in Strength Index: | -3.8 | 3.5 | 5.7 |
Article By InvestMacro – Receive our weekly COT Reports by Email
*COT Report: The COT data, released weekly to the public each Friday, is updated through the most recent Tuesday (data is 3 days old) and shows a quick view of how large speculators or non-commercials (for-profit traders) were positioned in the futures markets.
The CFTC categorizes trader positions according to commercial hedgers (traders who use futures contracts for hedging as part of the business), non-commercials (large traders who speculate to realize trading profits) and nonreportable traders (usually small traders/speculators) as well as their open interest (contracts open in the market at time of reporting).See CFTC criteria here.
All information and opinions on this website and contained in this article are for general informational purposes only and do not constitute investment advice.
By JustMarkets The US stock indices ended Friday’s session in the red. By the end…
By Analytical Department RoboForex USD/JPY opens the week at 162.36 on Monday. The Japanese yen…
By InvestMacro Here are the latest charts and statistics for the Commitment of Traders (COT)…
By InvestMacro The latest update for the weekly Commitment of Traders (COT) report was released…
By InvestMacro Here are the latest charts and statistics for the Commitment of Traders (COT)…
By InvestMacro Here are the latest charts and statistics for the Commitment of Traders (COT)…
This website uses cookies.