By RoboForex Analytical Department
Gold is trading in a holding pattern near 4,200 USD per ounce on Tuesday, as markets remain in a state of suspended animation ahead of the Federal Reserve’s policy decision.
While a 25-basis-point rate cut is almost fully priced in, investors will scrutinise the updated economic projections and Chair Jerome Powell’s subsequent press conference for clarity on the policy trajectory into 2026 and beyond.
Market-implied probabilities currently assign an 87% likelihood to a cut today. However, expectations for future easing have moderated, with just two rounds of cuts now anticipated for next year, down from three a week ago.
Before the Fed announcement, traders will also assess the latest JOLTS job openings data for additional labour market insights.
In a supportive development for the metal, the People’s Bank of China expanded its gold reserves for the 13th consecutive month, bringing its total holdings to 74.12 million troy ounces.
Free Reports:
Technical Analysis: XAU/USD
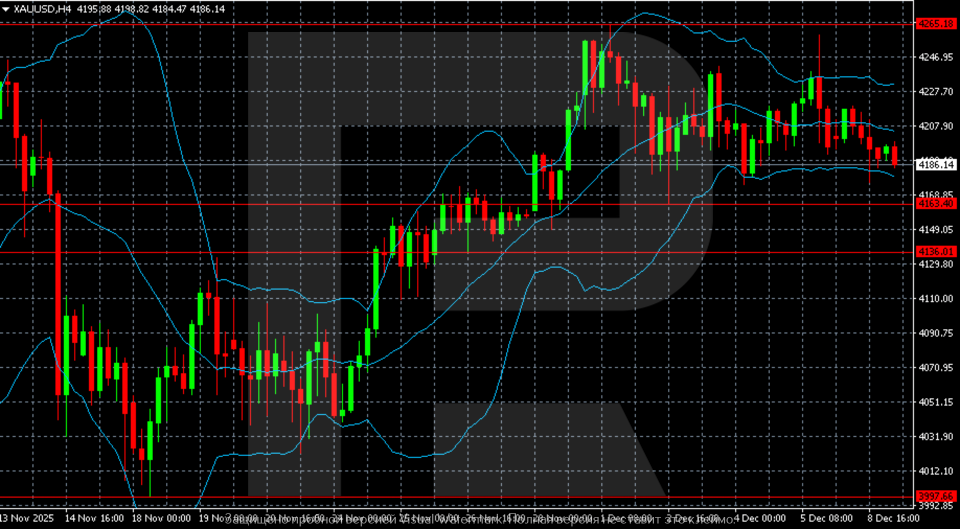
H4 Chart:
On the H4 chart, XAU/USD continues to consolidate in a sideways range following its late-November advance. The price is currently trading below the middle Bollinger Band, suggesting a gradual loss of bullish momentum. The upper band has flattened, confirming the consolidation phase within the 4,163–4,240 USD zone.
Support at 4,163 USD remains critical, with the price having rebounded from this level multiple times in recent sessions. A decisive break below would open the way to the next significant support near 4,136 USD, which aligns with the lower Bollinger Band.
Resistance is clearly defined at 4,240 USD. A sustained move above this level would provide the first strong signal for a renewed upward move, initially targeting 4,265 USD.
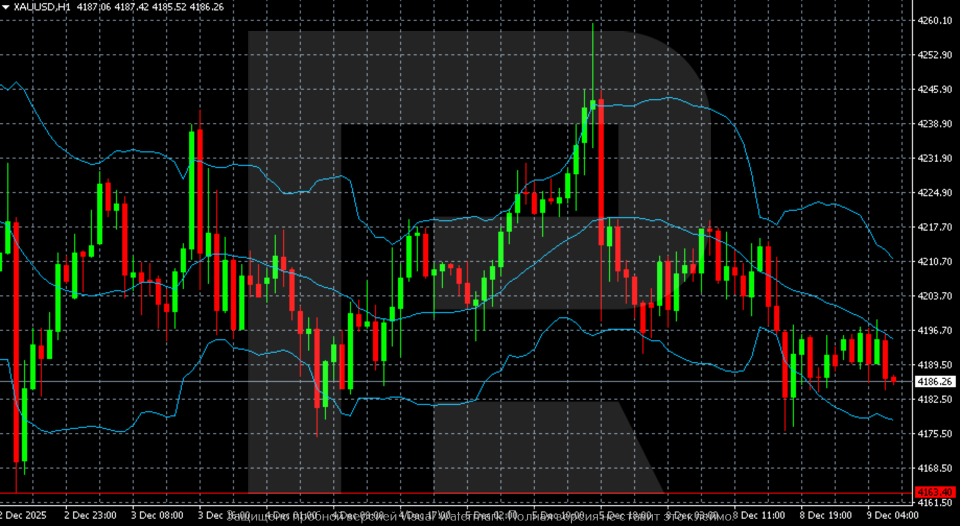
H1 Chart:
On the H1 chart, gold shows a near-term bearish bias after failing to break above resistance at 4,240 USD. The price is consistently positioned below the middle Bollinger Band, with the lower band reinforcing the selling pressure. Local support has solidified around 4,163 USD, a level tested repeatedly in recent trading.
The Stochastic oscillator remains near oversold territory, indicating weak momentum, though a clear reversal signal has yet to emerge.
Should buyers defend the 4,163 USD support and propel the price back above the middle Bollinger Band, a recovery toward 4,200 USD and later 4,240 USD would become likely. Conversely, a breakdown below 4,163 USD would signal a deeper corrective move toward 4,136–4,100 USD.
Conclusion
Gold remains in a state of cautious equilibrium as traders await the Fed’s policy signal and updated economic forecasts. While underlying physical demand – particularly from central banks – continues to provide a supportive floor, the technical picture reflects consolidation with a slight near-term bearish tilt.
Disclaimer:
Any forecasts contained herein are based on the author’s particular opinion. This analysis may not be treated as trading advice. RoboForex bears no responsibility for trading results based on trading recommendations and reviews contained herein.
By InvestMacro Here are the latest charts and statistics for the Commitment of Traders (COT)…
By InvestMacro The latest update for the weekly Commitment of Traders (COT) report was released…
By InvestMacro Here are the latest charts and statistics for the Commitment of Traders (COT)…
By InvestMacro Here are the latest charts and statistics for the Commitment of Traders (COT)…
By InvestMacro Here are the latest charts and statistics for the Commitment of Traders (COT)…
By InvestMacro Here are the latest charts and statistics for the Commitment of Traders (COT)…
This website uses cookies.