By InvestMacro
Here are the latest charts and statistics for the Commitment of Traders (COT) data published by the Commodities Futures Trading Commission (CFTC).
The latest COT data is updated through Tuesday June 3rd and shows a quick view of how large market participants (for-profit speculators and commercial traders) were positioned in the futures markets. All currency positions are in direct relation to the US dollar where, for example, a bet for the euro is a bet that the euro will rise versus the dollar while a bet against the euro will be a bet that the euro will decline versus the dollar.
The COT currency market speculator bets were overall lower this week as four out of the eleven currency markets we cover had higher positioning while the other seven markets had lower speculator contracts.
Free Reports:
Leading the gains for the currency markets was the EuroFX (3,290 contracts), the Mexican Peso (3,047 contracts), the New Zealand Dollar (712 contracts) and the US Dollar Index (703 contracts) also showing positive weeks.
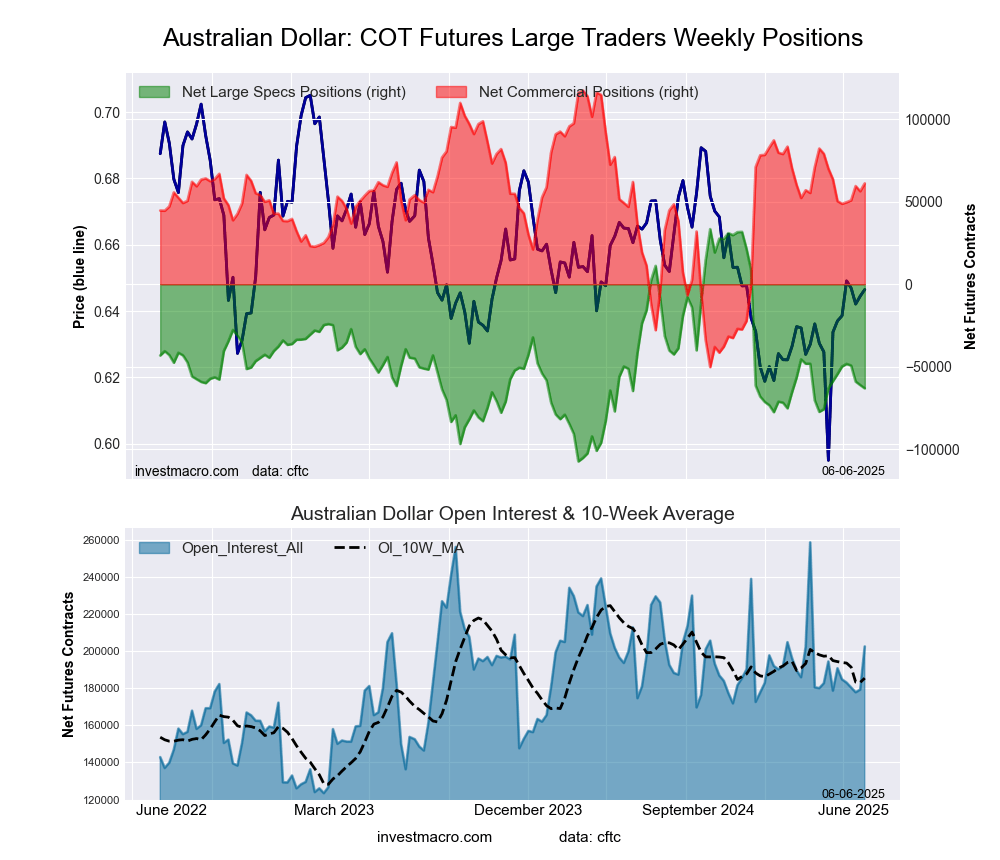
The currencies seeing declines in speculator bets on the week were the Brazilian Real (-16,046 contracts), the Japanese Yen (-12,863 contracts), the Canadian Dollar (-4,548 contracts), the Australian Dollar (-1,975 contracts), the Swiss Franc (-583 contracts), the British Pound (-164 contracts) and with Bitcoin (-38 contracts) also registering lower bets on the week.
Highlighting the Currency Speculator data this week, was a bounce back into bullish territory for the U.S. Dollar Index. This week’s data marks the first bullish level in the past seven weeks as speculators have now advanced their weekly bullish bets modestly for a fourth straight week.
The U.S. Dollar has been on the defensive against most of the other major currencies this year and the Dollar Index price has fallen under the significant psychological level of 100.00 for the first time since July of 2023. The U.S. Dollar is currently down approximately 10% since the beginning of the new year coinciding with a dip in speculator sentiment as well.
Roundup: Currency Speculator Positioning
Currency Markets 5-Day Price Performance:
– The Brazilian Real rose by over 2.35% in the past 5 days.
– The Mexican Peso was up by 1.5%.
– The Swiss Franc, the Canadian Dollar, the Euro, the British Pound, the New Zealand Dollar and the Australian Dollar all were higher by less than 1%.
– The US Dollar Index was virtually unchanged with a small decline on the week.
– Bitcoin was also virtually unchanged, while the Japanese Yen fell by -0.5%.
Legend: Open Interest | Speculators Current Net Position | Weekly Specs Change | Specs Strength Score compared to last 3-Years (0-100 range)
COT Strength Scores (a normalized measure of Speculator positions over a 3-Year range, from 0 to 100 where above 80 is Extreme-Bullish and below 20 is Extreme-Bearish) showed that the Japanese Yen (92 percent) and the Brazilian Real (70 percent) lead the currency markets this week. The Mexican Peso (62 percent) and the EuroFX (60 percent) come in as the next highest in the weekly strength scores.
On the downside, the Bitcoin (1 percent) and the US Dollar Index (8 percent) come in at the lowest strength levels currently and are in Extreme-Bearish territory (below 20 percent). The next lowest strength scores are the Australian Dollar (31 percent) and the New Zealand Dollar (37 percent).
3-Year Strength Statistics:
US Dollar Index (8.0 percent) vs US Dollar Index previous week (6.5 percent)
EuroFX (60.3 percent) vs EuroFX previous week (59.0 percent)
British Pound Sterling (49.1 percent) vs British Pound Sterling previous week (49.2 percent)
Japanese Yen (92.3 percent) vs Japanese Yen previous week (95.8 percent)
Swiss Franc (48.1 percent) vs Swiss Franc previous week (49.3 percent)
Canadian Dollar (39.4 percent) vs Canadian Dollar previous week (41.4 percent)
Australian Dollar (31.5 percent) vs Australian Dollar previous week (32.9 percent)
New Zealand Dollar (37.1 percent) vs New Zealand Dollar previous week (36.3 percent)
Mexican Peso (61.6 percent) vs Mexican Peso previous week (60.1 percent)
Brazilian Real (69.5 percent) vs Brazilian Real previous week (82.6 percent)
Bitcoin (0.9 percent) vs Bitcoin previous week (1.7 percent)
COT Strength Score Trends (or move index, calculates the 6-week changes in strength scores) showed that the Mexican Peso (12 percent) and the EuroFX (7 percent) lead the past six weeks trends for the currencies. The British Pound (7 percent), the New Zealand Dollar (4 percent) and the US Dollar Index (3 percent) are the next highest positive movers in the 3-Year trends data.
Bitcoin (-33 percent) leads the downside trend scores currently with the Canadian Dollar (-18 percent), Brazilian Real (-15 percent) and the Japanese Yen (-7 percent) following next with lower trend scores.
3-Year Strength Trends:
US Dollar Index (3.3 percent) vs US Dollar Index previous week (-4.0 percent)
EuroFX (6.8 percent) vs EuroFX previous week (3.9 percent)
British Pound Sterling (7.0 percent) vs British Pound Sterling previous week (13.7 percent)
Japanese Yen (-7.3 percent) vs Japanese Yen previous week (-2.2 percent)
Swiss Franc (-1.2 percent) vs Swiss Franc previous week (6.3 percent)
Canadian Dollar (-18.5 percent) vs Canadian Dollar previous week (-9.0 percent)
Australian Dollar (-6.1 percent) vs Australian Dollar previous week (-1.7 percent)
New Zealand Dollar (3.7 percent) vs New Zealand Dollar previous week (10.0 percent)
Mexican Peso (11.9 percent) vs Mexican Peso previous week (14.3 percent)
Brazilian Real (-15.5 percent) vs Brazilian Real previous week (-1.8 percent)
Bitcoin (-32.9 percent) vs Bitcoin previous week (-62.4 percent)
This week’s current strength score (the trader positioning range over the past three years, measured from 0 to 100) shows the speculators are currently Bearish-Extreme with a score of 8.0 percent. The commercials are Bullish-Extreme with a score of 96.0 percent and the small traders (not shown in chart) are Bearish-Extreme with a score of 8.8 percent.
Our weekly trend-following model classifies the current market price position as: Downtrend.
| US DOLLAR INDEX Statistics | SPECULATORS | COMMERCIALS | SMALL TRADERS |
| – Percent of Open Interest Longs: | 56.2 | 28.6 | 7.6 |
| – Percent of Open Interest Shorts: | 54.0 | 25.2 | 13.2 |
| – Net Position: | 617 | 968 | -1,585 |
| – Gross Longs: | 15,748 | 8,021 | 2,123 |
| – Gross Shorts: | 15,131 | 7,053 | 3,708 |
| – Long to Short Ratio: | 1.0 to 1 | 1.1 to 1 | 0.6 to 1 |
| NET POSITION TREND: | |||
| – Strength Index Score (3 Year Range Pct): | 8.0 | 96.0 | 8.8 |
| – Strength Index Reading (3 Year Range): | Bearish-Extreme | Bullish-Extreme | Bearish-Extreme |
| NET POSITION MOVEMENT INDEX: | |||
| – 6-Week Change in Strength Index: | 3.3 | -2.0 | -7.8 |
This week’s current strength score (the trader positioning range over the past three years, measured from 0 to 100) shows the speculators are currently Bullish with a score of 60.3 percent. The commercials are Bearish with a score of 34.1 percent and the small traders (not shown in chart) are Bullish-Extreme with a score of 96.6 percent.
Our weekly trend-following model classifies the current market price position as: Uptrend.
| EURO Currency Statistics | SPECULATORS | COMMERCIALS | SMALL TRADERS |
| – Percent of Open Interest Longs: | 26.0 | 56.0 | 12.9 |
| – Percent of Open Interest Shorts: | 15.4 | 73.7 | 5.8 |
| – Net Position: | 82,764 | -138,285 | 55,521 |
| – Gross Longs: | 202,786 | 437,677 | 100,625 |
| – Gross Shorts: | 120,022 | 575,962 | 45,104 |
| – Long to Short Ratio: | 1.7 to 1 | 0.8 to 1 | 2.2 to 1 |
| NET POSITION TREND: | |||
| – Strength Index Score (3 Year Range Pct): | 60.3 | 34.1 | 96.6 |
| – Strength Index Reading (3 Year Range): | Bullish | Bearish | Bullish-Extreme |
| NET POSITION MOVEMENT INDEX: | |||
| – 6-Week Change in Strength Index: | 6.8 | -6.9 | 5.8 |
This week’s current strength score (the trader positioning range over the past three years, measured from 0 to 100) shows the speculators are currently Bearish with a score of 49.1 percent. The commercials are Bearish with a score of 43.6 percent and the small traders (not shown in chart) are Bullish-Extreme with a score of 91.1 percent.
Our weekly trend-following model classifies the current market price position as: Uptrend.
| BRITISH POUND Statistics | SPECULATORS | COMMERCIALS | SMALL TRADERS |
| – Percent of Open Interest Longs: | 44.4 | 31.9 | 15.8 |
| – Percent of Open Interest Shorts: | 29.3 | 52.9 | 9.9 |
| – Net Position: | 35,215 | -48,965 | 13,750 |
| – Gross Longs: | 103,672 | 74,588 | 36,963 |
| – Gross Shorts: | 68,457 | 123,553 | 23,213 |
| – Long to Short Ratio: | 1.5 to 1 | 0.6 to 1 | 1.6 to 1 |
| NET POSITION TREND: | |||
| – Strength Index Score (3 Year Range Pct): | 49.1 | 43.6 | 91.1 |
| – Strength Index Reading (3 Year Range): | Bearish | Bearish | Bullish-Extreme |
| NET POSITION MOVEMENT INDEX: | |||
| – 6-Week Change in Strength Index: | 7.0 | -9.7 | 18.5 |
This week’s current strength score (the trader positioning range over the past three years, measured from 0 to 100) shows the speculators are currently Bullish-Extreme with a score of 92.3 percent. The commercials are Bearish-Extreme with a score of 6.7 percent and the small traders (not shown in chart) are Bullish-Extreme with a score of 100.0 percent.
Our weekly trend-following model classifies the current market price position as: Uptrend.
| JAPANESE YEN Statistics | SPECULATORS | COMMERCIALS | SMALL TRADERS |
| – Percent of Open Interest Longs: | 51.8 | 27.4 | 12.2 |
| – Percent of Open Interest Shorts: | 10.5 | 75.3 | 5.5 |
| – Net Position: | 151,149 | -175,508 | 24,359 |
| – Gross Longs: | 189,514 | 100,151 | 44,497 |
| – Gross Shorts: | 38,365 | 275,659 | 20,138 |
| – Long to Short Ratio: | 4.9 to 1 | 0.4 to 1 | 2.2 to 1 |
| NET POSITION TREND: | |||
| – Strength Index Score (3 Year Range Pct): | 92.3 | 6.7 | 100.0 |
| – Strength Index Reading (3 Year Range): | Bullish-Extreme | Bearish-Extreme | Bullish-Extreme |
| NET POSITION MOVEMENT INDEX: | |||
| – 6-Week Change in Strength Index: | -7.3 | 6.4 | 2.8 |
This week’s current strength score (the trader positioning range over the past three years, measured from 0 to 100) shows the speculators are currently Bearish with a score of 48.1 percent. The commercials are Bearish with a score of 41.7 percent and the small traders (not shown in chart) are Bullish with a score of 79.5 percent.
Our weekly trend-following model classifies the current market price position as: Uptrend.
| SWISS FRANC Statistics | SPECULATORS | COMMERCIALS | SMALL TRADERS |
| – Percent of Open Interest Longs: | 8.8 | 63.8 | 18.9 |
| – Percent of Open Interest Shorts: | 40.8 | 32.0 | 18.7 |
| – Net Position: | -26,066 | 25,884 | 182 |
| – Gross Longs: | 7,145 | 51,879 | 15,409 |
| – Gross Shorts: | 33,211 | 25,995 | 15,227 |
| – Long to Short Ratio: | 0.2 to 1 | 2.0 to 1 | 1.0 to 1 |
| NET POSITION TREND: | |||
| – Strength Index Score (3 Year Range Pct): | 48.1 | 41.7 | 79.5 |
| – Strength Index Reading (3 Year Range): | Bearish | Bearish | Bullish |
| NET POSITION MOVEMENT INDEX: | |||
| – 6-Week Change in Strength Index: | -1.2 | -1.4 | 6.1 |
This week’s current strength score (the trader positioning range over the past three years, measured from 0 to 100) shows the speculators are currently Bearish with a score of 39.4 percent. The commercials are Bullish with a score of 60.5 percent and the small traders (not shown in chart) are Bearish with a score of 37.7 percent.
Our weekly trend-following model classifies the current market price position as: Strong Uptrend.
| CANADIAN DOLLAR Statistics | SPECULATORS | COMMERCIALS | SMALL TRADERS |
| – Percent of Open Interest Longs: | 6.9 | 79.5 | 8.9 |
| – Percent of Open Interest Shorts: | 47.1 | 38.5 | 9.7 |
| – Net Position: | -108,446 | 110,625 | -2,179 |
| – Gross Longs: | 18,667 | 214,704 | 23,967 |
| – Gross Shorts: | 127,113 | 104,079 | 26,146 |
| – Long to Short Ratio: | 0.1 to 1 | 2.1 to 1 | 0.9 to 1 |
| NET POSITION TREND: | |||
| – Strength Index Score (3 Year Range Pct): | 39.4 | 60.5 | 37.7 |
| – Strength Index Reading (3 Year Range): | Bearish | Bullish | Bearish |
| NET POSITION MOVEMENT INDEX: | |||
| – 6-Week Change in Strength Index: | -18.5 | 15.9 | 10.9 |
This week’s current strength score (the trader positioning range over the past three years, measured from 0 to 100) shows the speculators are currently Bearish with a score of 31.5 percent. The commercials are Bullish with a score of 66.4 percent and the small traders (not shown in chart) are Bullish with a score of 54.3 percent.
Our weekly trend-following model classifies the current market price position as: Strong Uptrend.
| AUSTRALIAN DOLLAR Statistics | SPECULATORS | COMMERCIALS | SMALL TRADERS |
| – Percent of Open Interest Longs: | 11.8 | 64.5 | 11.5 |
| – Percent of Open Interest Shorts: | 43.0 | 34.3 | 10.5 |
| – Net Position: | -63,155 | 61,195 | 1,960 |
| – Gross Longs: | 23,969 | 130,735 | 23,307 |
| – Gross Shorts: | 87,124 | 69,540 | 21,347 |
| – Long to Short Ratio: | 0.3 to 1 | 1.9 to 1 | 1.1 to 1 |
| NET POSITION TREND: | |||
| – Strength Index Score (3 Year Range Pct): | 31.5 | 66.4 | 54.3 |
| – Strength Index Reading (3 Year Range): | Bearish | Bullish | Bullish |
| NET POSITION MOVEMENT INDEX: | |||
| – 6-Week Change in Strength Index: | -6.1 | 6.4 | -5.8 |
This week’s current strength score (the trader positioning range over the past three years, measured from 0 to 100) shows the speculators are currently Bearish with a score of 37.1 percent. The commercials are Bullish with a score of 60.7 percent and the small traders (not shown in chart) are Bullish with a score of 54.4 percent.
Our weekly trend-following model classifies the current market price position as: Strong Uptrend.
| NEW ZEALAND DOLLAR Statistics | SPECULATORS | COMMERCIALS | SMALL TRADERS |
| – Percent of Open Interest Longs: | 14.0 | 75.8 | 6.5 |
| – Percent of Open Interest Shorts: | 48.9 | 41.1 | 6.4 |
| – Net Position: | -23,674 | 23,601 | 73 |
| – Gross Longs: | 9,531 | 51,514 | 4,419 |
| – Gross Shorts: | 33,205 | 27,913 | 4,346 |
| – Long to Short Ratio: | 0.3 to 1 | 1.8 to 1 | 1.0 to 1 |
| NET POSITION TREND: | |||
| – Strength Index Score (3 Year Range Pct): | 37.1 | 60.7 | 54.4 |
| – Strength Index Reading (3 Year Range): | Bearish | Bullish | Bullish |
| NET POSITION MOVEMENT INDEX: | |||
| – 6-Week Change in Strength Index: | 3.7 | -4.3 | 8.0 |
This week’s current strength score (the trader positioning range over the past three years, measured from 0 to 100) shows the speculators are currently Bullish with a score of 61.6 percent. The commercials are Bearish with a score of 39.8 percent and the small traders (not shown in chart) are Bearish with a score of 36.6 percent.
Our weekly trend-following model classifies the current market price position as: Strong Uptrend.
| MEXICAN PESO Statistics | SPECULATORS | COMMERCIALS | SMALL TRADERS |
| – Percent of Open Interest Longs: | 55.4 | 32.7 | 3.6 |
| – Percent of Open Interest Shorts: | 17.2 | 72.4 | 2.1 |
| – Net Position: | 64,449 | -66,946 | 2,497 |
| – Gross Longs: | 93,401 | 55,198 | 6,108 |
| – Gross Shorts: | 28,952 | 122,144 | 3,611 |
| – Long to Short Ratio: | 3.2 to 1 | 0.5 to 1 | 1.7 to 1 |
| NET POSITION TREND: | |||
| – Strength Index Score (3 Year Range Pct): | 61.6 | 39.8 | 36.6 |
| – Strength Index Reading (3 Year Range): | Bullish | Bearish | Bearish |
| NET POSITION MOVEMENT INDEX: | |||
| – 6-Week Change in Strength Index: | 11.9 | -12.6 | 7.3 |
This week’s current strength score (the trader positioning range over the past three years, measured from 0 to 100) shows the speculators are currently Bullish with a score of 69.5 percent. The commercials are Bearish with a score of 29.4 percent and the small traders (not shown in chart) are Bearish with a score of 38.5 percent.
Our weekly trend-following model classifies the current market price position as: Strong Uptrend.
| BRAZIL REAL Statistics | SPECULATORS | COMMERCIALS | SMALL TRADERS |
| – Percent of Open Interest Longs: | 64.3 | 30.9 | 4.7 |
| – Percent of Open Interest Shorts: | 28.3 | 70.6 | 1.0 |
| – Net Position: | 30,793 | -33,919 | 3,126 |
| – Gross Longs: | 54,954 | 26,403 | 4,014 |
| – Gross Shorts: | 24,161 | 60,322 | 888 |
| – Long to Short Ratio: | 2.3 to 1 | 0.4 to 1 | 4.5 to 1 |
| NET POSITION TREND: | |||
| – Strength Index Score (3 Year Range Pct): | 69.5 | 29.4 | 38.5 |
| – Strength Index Reading (3 Year Range): | Bullish | Bearish | Bearish |
| NET POSITION MOVEMENT INDEX: | |||
| – 6-Week Change in Strength Index: | -15.5 | 14.2 | 7.5 |
This week’s current strength score (the trader positioning range over the past three years, measured from 0 to 100) shows the speculators are currently Bearish-Extreme with a score of 0.9 percent. The commercials are Bullish-Extreme with a score of 100.0 percent and the small traders (not shown in chart) are Bullish with a score of 56.1 percent.
Our weekly trend-following model classifies the current market price position as: Strong Uptrend.
| BITCOIN Statistics | SPECULATORS | COMMERCIALS | SMALL TRADERS |
| – Percent of Open Interest Longs: | 80.9 | 8.1 | 4.5 |
| – Percent of Open Interest Shorts: | 88.7 | 1.5 | 3.3 |
| – Net Position: | -2,312 | 1,949 | 363 |
| – Gross Longs: | 24,084 | 2,407 | 1,341 |
| – Gross Shorts: | 26,396 | 458 | 978 |
| – Long to Short Ratio: | 0.9 to 1 | 5.3 to 1 | 1.4 to 1 |
| NET POSITION TREND: | |||
| – Strength Index Score (3 Year Range Pct): | 0.9 | 100.0 | 56.1 |
| – Strength Index Reading (3 Year Range): | Bearish-Extreme | Bullish-Extreme | Bullish |
| NET POSITION MOVEMENT INDEX: | |||
| – 6-Week Change in Strength Index: | -32.9 | 29.8 | 8.8 |
Article By InvestMacro – Receive our weekly COT Newsletter
*COT Report: The COT data, released weekly to the public each Friday, is updated through the most recent Tuesday (data is 3 days old) and shows a quick view of how large speculators or non-commercials (for-profit traders) were positioned in the futures markets.
The CFTC categorizes trader positions according to commercial hedgers (traders who use futures contracts for hedging as part of the business), non-commercials (large traders who speculate to realize trading profits) and nonreportable traders (usually small traders/speculators) as well as their open interest (contracts open in the market at time of reporting). See CFTC criteria here.
By ForexTime FXTM’s USDInd ↑ 2% MTD Dollar best performing G10 currency MTD Geopolitical risk…
By JustMarkets The US stock market concluded Thursday’s session in the red as the escalating…
By Analytical Department RoboForex EUR/USD is holding near 1.1620 on Friday, with the US dollar…
By JustMarkets The US stock market rose on Wednesday. By the end of the day,…
By Daniele D'Alvia, Queen Mary University of London When a conflict escalates, financial markets respond…
By Analytical Department RoboForex GBP/USD contracted to 1.3350 on Thursday, with the pound remaining under…
This website uses cookies.